Main Page/SlicerCommunity/2016
Go to 2022 :: 2021 :: 2020 :: 2019 :: 2018 :: 2017 :: 2016 :: 2015 :: 2014-2011 :: 2010-2000
The community that relies on 3D Slicer is large and active: (numbers below updated on December 1st, 2023)
- 1,467,466+ downloads in the last 11 years (269,677 in 2023, 206,541 in 2022)
- over 17.900+ literature search results on Google Scholar
- 2,147+ papers on PubMed citing the Slicer platform paper
- Fedorov A., Beichel R., Kalpathy-Cramer J., Finet J., Fillion-Robin J-C., Pujol S., Bauer C., Jennings D., Fennessy F.M., Sonka M., Buatti J., Aylward S.R., Miller J.V., Pieper S., Kikinis R. 3D Slicer as an Image Computing Platform for the Quantitative Imaging Network. Magnetic Resonance Imaging. 2012 Nov;30(9):1323-41. PMID: 22770690. PMCID: PMC3466397.
- 39 events in open source hackathon series continuously running since 2005 with 3260 total participants
- Slicer Forum with +8,138 subscribers has approximately 275 posts every week
The following is a sample of the research performed using 3D Slicer outside of the group that develops it. in 2016
We monitor PubMed and related databases to update these lists, but if you know of other research related to the Slicer community that should be included here please email: marianna (at) bwh.harvard.edu.
Contents
- 1 2016
- 1.1 Making Three-Dimensional Echocardiography More Tangible: A Workflow for Three-Dimensional Printing with Echocardiographic Data
- 1.2 A Patient-Specific Polylactic Acid Bolus Made by a 3D Printer for Breast Cancer Radiation Therapy
- 1.3 Three-Dimensional Arrangement of Human Bone Marrow Microvessels Revealed by Immunohistology in Undecalcified Sections
- 1.4 Viable Ednra Y129F Mice Feature Human Mandibulofacial Dysostosis with Alopecia (MFDA) Syndrome Due to the Homologue Mutation
- 1.5 3D Finite Element Electrical Model of Larval Zebrafish ECG Signals
- 1.6 Extracted Magnetic Resonance Texture Features Discriminate between Phenotypes and are Associated with Overall Survival in Glioblastoma Multiforme Patients
- 1.7 Presurgical Visualization of the Neurovascular Relationship in Trigeminal Neuralgia with 3D Modeling using Free Slicer Software
- 1.8 An Exploratory Study to Detect Ménière's Disease in Conventional MRI Scans Using Radiomics
- 1.9 Fully Automated Enhanced Tumor Compartmentalization: Man vs. Machine Reloaded
- 1.10 Glioblastoma Segmentation: Comparison of Three Different Software Packages
- 1.11 A New Giant Titanosauria (Dinosauria: Sauropoda) from the Late Cretaceous Bauru Group, Brazil
- 1.12 Two-Center Prospective, Randomized, Clinical, and Radiographic Study Comparing Osteotome Sinus Floor Elevation with or without Bone Graft and Simultaneous Implant Placement
- 1.13 Mapping 3D fiber Orientation in Tissue using Dual-angle Optical Polarization Tractography
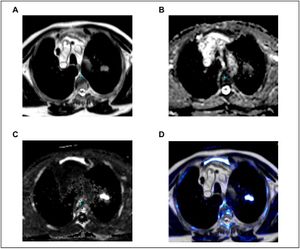
- 1.14 The Impact of Diffusion-Weighted MRI on the Definition of Gross Tumor Volume in Radiotherapy of Non-Small-Cell Lung Cancer
- 1.15 Multicenter Evaluation of Geometric Accuracy of MRI Protocols Used in Experimental Stroke
- 1.16 Three-Dimensional Simulation of Collision-Free Paths for Combined Endoscopic Third Ventriculostomy and Pineal Region Tumor Biopsy: Implications for the Design Specifications of Future Flexible Endoscopic Instruments
- 1.17 An Open-Source Label Atlas Correction Tool and Preliminary Results on Huntingtons Disease Whole-Brain MRI Atlases
- 1.18 An Open Tool for Input Function Estimation and Quantification of Dynamic PET FDG Brain Scans
- 1.19 Congenital and Acquired Mandibular Asymmetry: Mapping Growth and Remodeling in 3 Dimensions
- 1.20 Evaluating the Utility of "3D Slicer" as a Fast and Independent Tool to Assess Intrafractional Organ Dose Variations in Gynecological Brachytherapy
- 1.21 Quantification of Diaphragm Mechanics in Pompe Disease using Dynamic 3D MRI
- 1.22 Development of a Nomogram Combining Clinical Staging with 18F-FDG PET/CT Image Features in Non-small-cell Lung Cancer Stage I-III
- 1.23 Patient and Aneurysm Characteristics Associated with Rupture Risk of Multiple Intracranial Aneurysms in the Anterior Circulation System
- 1.24 Optimizing Timing of Immunotherapy Improves Control of Tumors by Hypofractionated Radiation Therapy
- 1.25 X-ray Computed Tomography Datasets for Forensic Analysis of Vertebrate Fossils
- 1.26 Subregional Shape Alterations in the Amygdala in Patients with Panic Disorder
- 1.27 3D Mandibular Superimposition: Comparison of Regions of Reference for Voxel-Based Registration
- 1.28 Morphological and Volumetric Assessment of Cerebral Ventricular System with 3D Slicer Software
- 1.29 Visualization of the 3D Dosimetry for a Leipzig Brachytherapy Applicator Using 3D Slicer
- 1.30 Common 3-dimensional Coordinate System for Assessment of Directional Changes
- 1.31 Cranial Morphology of the Late Oligocene Patagonian Notohippid Rhynchippus equinus Ameghino, 1897 (Mammalia, Notoungulata) with Emphases in Basicranial and Auditory Region
- 1.32 3D Printing and 3D Slicer - Powerful Tools in Understanding and Treating Structural Lung Disease
- 1.33 STN-DBS Reduces Saccadic Hypometria but Not Visuospatial Bias in Parkinson's Disease Patients
- 1.34 Study Of Bppv Precise Manipulation Treatment
- 1.35 Single-Breath Clinical Imaging of Hyperpolarized (129)Xe in the Airspaces, Barrier, and Red Blood Cells using an Interleaved 3D Radial 1-Point Dixon Acquisition
- 1.36 Low-cost Interactive Image-based Virtual Endoscopy for the Diagnosis and Surgical Planning of Suprasellar Arachnoid Cysts
- 1.37 A Method for the Assessment of Time-varying Brain Shift during Navigated Epilepsy Surgery
- 1.38 Deformable Image Registration with a Featurelet Algorithm: Implementation as a 3D Slicer Extension and Validation
- 1.39 Accuracy of Lesion Boundary Tracking in Navigated Breast Tumor Excision
- 1.40 Effects of Voxelization on Dose Volume Histogram Accuracy
- 1.41 Real-time Self-calibration of a Tracked Augmented Reality Display
- 1.42 Accuracy of Open-Source Software Segmentation and Paper-based Printed Three-Dimensional Models
- 1.43 Validation of a Novel Geometric Coordination Registration using Manual and Semi-automatic Registration in Cone-beam Computed Tomogram
- 1.44 Effect of Decompressive Craniectomy on Perihematomal Edema in Patients with Intracerebral Hemorrhage
- 1.45 Multi Texture Analysis of Colorectal Cancer Continuum using Multispectral Imagery
- 1.46 Cranial Anatomy and Palaeoneurology of the Archosaur Riojasuchus tenuisceps from the Los Colorados Formation, La Rioja, Argentina
- 1.47 Diffusion Tensor Imaging Assessment of Microstructural Brainstem Integrity in Chiari Malformation Type I
- 1.48 Large Area 3-D Optical Coherence Tomography Imaging of Lumpectomy Specimens for Radiation Treatment Planning
- 1.49 Development and Evaluation of an Open-Source 3D Virtual Simulator with Integrated Motion-Tracking as a Teaching Tool for Pedicle Screw Insertion
- 1.50 Current Smoking Status is Associated with Lower Quantitative CT Measures of Emphysema and Gas Trapping
- 1.51 A Proposed Method for Accurate 3D Analysis of Cochlear Implant Migration using Fusion of Cone Beam CT
- 1.52 Estimates of The Levator Ani Subtended Volume Based on Magnetic Resonance Linear Measurements
- 1.53 Boolean Combinations of Implicit Functions for Model Clipping in Computer-Assisted Surgical Planning
- 1.54 Three-Dimensional Visualization of the Distribution of Melanin-Concentrating Hormone Producing Neurons in the Mouse Hypothalamus
- 1.55 Patient-Specific Quantitation of Mitral Valve Strain by Computer Analysis of Three-Dimensional Echocardiography: A Pilot Study
- 1.56 In Vivo Visualization of the Facial Nerve in Patients with Acoustic Neuroma using Diffusion Tensor Imaging-Based Fiber Tracking
- 1.57 Head Circumference as a Useful Surrogate for Intracranial Volume in Older Adults
- 1.58 A Proposed Method for Accurate 3D Analysis of Cochlear Implant Migration Using Fusion of Cone Beam CT
- 1.59 Assessing the Effects of Software Platforms on Volumetric Segmentation of Glioblastoma
- 1.60 The Role of Micro-CT in 3D Histology Imaging
- 1.61 Preoperative Visualization of Cranial Nerves in Skull Base Tumor Surgery Using Diffusion Tensor Imaging Technology
- 1.62 Patch-Based Segmentation with Spatial Consistency: Application to MS Lesions in Brain MRI
- 1.63 Optic Nerve Tractography Prediction of Visual Deficit in Pituitary Macroadenoma
2016
Making Three-Dimensional Echocardiography More Tangible: A Workflow for Three-Dimensional Printing with Echocardiographic Data
|
Publication: Echo Res Pract. 2016 Dec;3(4):R57-R64. PMID: 27974356 | PDF Authors: Mashari A, Montealegre-Gallegos M, Knio Z, Yeh L, Jeganathan J, Matyal R, Khabbaz KR, Mahmood F. Institution: Department of Anesthesia and Pain Management, Toronto General Hospital, University Health Network, University of Toronto, Toronto, Canada. Background/Purpose: Three-dimensional (3D) printing is a rapidly evolving technology with several potential applications in the diagnosis and management of cardiac disease. Recently, 3D printing (i.e. rapid prototyping) derived from 3D transesophageal echocardiography (TEE) has become possible. Due to the multiple steps involved and the specific equipment required for each step, it might be difficult to start implementing echocardiography-derived 3D printing in a clinical setting. In this review, we provide an overview of this process, including its logistics and organization of tools and materials, 3D TEE image acquisition strategies, data export, format conversion, segmentation, and printing. Generation of patient-specific models of cardiac anatomy from echocardiographic data is a feasible, practical application of 3D printing technology. |
 3D-printed model of the blood volume in the left atrial appendage (LAA). The model on the far right is a negative mold of the LAA. The 3D TEE data set was exported as a Philips’ Cartesian DICOM and converted to NRRD format using 3D Slicer SlicerHeart extension. The NRRD file was then segmented using ITK-Snap. Model was exported as STL. Clipping and inversion to the negative model were performed using openSCAD. Models were printed using a desktop fused deposition modeling printer (Aleph Objects Taz 5). |
A Patient-Specific Polylactic Acid Bolus Made by a 3D Printer for Breast Cancer Radiation Therapy
|
Publication: PLoS One. 2016 Dec 8;11(12):e0168063. PMID: 27930717 | PDF
Institution: Department of Radiation Oncology, Seoul National University Hospital, Seoul, Republic of Korea. Background/Purpose: The aim of this study was to assess the feasibility and advantages of a patient-specific breast bolus made using a 3D printer technique. METHODS: We used the anthropomorphic female phantom with breast attachments, which volumes are 200, 300, 400, 500 and 650 cc. We simulated the treatment for a right breast patient using parallel opposed tangential fields. Treatment plans were used to investigate the effect of unwanted air gaps under bolus on the dose distribution of the whole breast. The commercial Super-Flex bolus and 3D-printed polylactic acid (PLA) bolus were applied to investigate the skin dose of the breast with the MOSFET measurement. Two boluses of 3 and 5 mm thicknesses were selected. RESULTS: There was a good agreement between the dose distribution for a virtual bolus generated by the TPS and PLA bolus. The difference in dose distribution between the virtual bolus and Super-Flex bolus was significant within the bolus and breast due to unwanted air gaps. The average differences between calculated and measured doses in a 200 and 300 cc with PLA bolus were not significant, which were -0.7% and -0.6% for 3mm, and -1.1% and -1.1% for 5 mm, respectively. With the Super-Flex bolus, however, significant dose differences were observed (-5.1% and -3.2% for 3mm, and -6.3% and -4.2% for 5 mm). CONCLUSION: The 3D-printed solid bolus can reduce the uncertainty of the daily setup and help to overcome the dose discrepancy by unwanted air gaps in the breast cancer radiation therapy. |
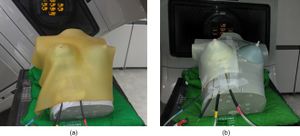 MOSFET placement for measurements under (a) Super-Flex bolus and (b) PLA bolus. All bolus structures of 10 (two boluses for one breast attachment) were exported to 3D Slicer, which is the open source software that converts a structure file to the standard tessellation language (STL) file. |
Three-Dimensional Arrangement of Human Bone Marrow Microvessels Revealed by Immunohistology in Undecalcified Sections
|
Publication: PLoS One. 2016 Dec 20;11(12):e0168173. PMID: 27997569 | PDF Authors: Steiniger BS, Stachniss V, Wilhelmi V, Seiler A, Lampp K, Neff A, Guthe M, Lobachev O. Institution: Department of Immunobiology, Institute of Anatomy and Cell Biology, Universität Marburg, Marburg, Germany. Background/Purpose: The arrangement of microvessels in human bone marrow is so far unknown. We combined monoclonal antibodies against CD34 and against CD141 to visualise all microvessel endothelia in 21 serial sections of about 1 cm2 size derived from a human iliac crest. The specimen was not decalcified and embedded in Technovit® 9100. In different regions of interest, the microvasculature was reconstructed in three dimensions using automatic methods. The three-dimensional models were subject to a rigid semiautomatic and manual quality control. In iliac crest bone marrow, the adipose tissue harbours irregularly distributed haematopoietic areas. These are fed by networks of large sinuses, which are loosely connected to networks of small capillaries prevailing in areas of pure adipose tissue. Our findings are compatible with the hypothesis that capillaries and sinuses in human iliac crest bone marrow are partially arranged in parallel. |
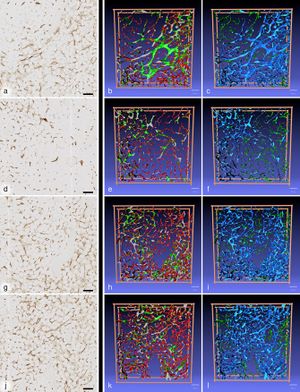 First scan of R1 (a), R2 (d), R3 (g) and R4 (j) immunostaining in combination with front views of the 3D models coloured for shape diameter (b,e,h,k) and connectivity visualisation (c,f,i,l). In (b), (e), (h) and (k) a shape diameter below 12 μm is depicted in red and above 30 μm in green. A transition from red to green occurs in microvessels of shape diameters from 12 μm to 30 μm. In (c), (i) and (l) the largest continuous microvessel network is depicted in light blue and all smaller networks are green. In (f) there are several large networks coloured light and dark blue. Small structures sized between 7 μm and 28 μm are red in (c), (f), (i) and (l) and all structures with a diameter less than 7μm in any dimension are omitted. (b,c) R1; (e,f) R2; (h,i) R3; (k,l) R4. Scale bar for all images: 100 μm. Imaging Methods are performed in the open source software 3D Slicer. |
Viable Ednra Y129F Mice Feature Human Mandibulofacial Dysostosis with Alopecia (MFDA) Syndrome Due to the Homologue Mutation
|
Publication: Mamm Genome. 2016 Dec;27(11-12):587-98. PMID: 27671791 | PDF Authors: Sabrautzki S, Sandholzer MA, et al. Institution: Institute of Experimental Genetics and German Mouse Clinic, Helmholtz Centrum Munich, German Research Center for Environmental Health (GmbH), Neuherberg, Germany. Background/Purpose: Animal models resembling human mutations are valuable tools to research the features of complex human craniofacial syndromes. This is the first report on a viable dominant mouse model carrying a non-synonymous sequence variation within the endothelin receptor type A gene (Ednra c.386A>T, p.Tyr129Phe) derived by an ENU mutagenesis program. The identical amino acid substitution was reported recently as disease causing in three individuals with the mandibulofacial dysostosis with alopecia (MFDA, OMIM 616367) syndrome. We performed standardized phenotyping of wild-type, heterozygous, and homozygous Ednra Y129F mice within the German Mouse Clinic. Mutant mice mimic the craniofacial phenotypes of jaw dysplasia, micrognathia, dysplastic temporomandibular joints, auricular dysmorphism, and missing of the squamosal zygomatic process as described for MFDA-affected individuals. As observed in MFDA-affected individuals, mutant Ednra Y129F mice exhibit hearing impairment in line with strong abnormalities of the ossicles and further, reduction of some lung volumetric parameters. In general, heterozygous and homozygous mice demonstrated inter-individual diversity of expression of the craniofacial phenotypes as observed in MFDA patients but without showing any cleft palates, eyelid defects, or alopecia. Mutant Ednra Y129F mice represent a valuable viable model for complex human syndromes of the first and second pharyngeal arches and for further studies and analysis of impaired endothelin 1 (EDN1)-endothelin receptor type A (EDNRA) signaling. Above all, Ednra Y129F mice model the recently published human MFDA syndrome and may be helpful for further disease understanding and development of therapeutic interventions. |
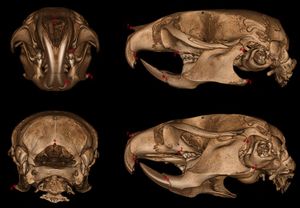 Landmarks of cephalometric/mandibular measurement. In total, eight datasets were evaluated by two experienced osteologists using the distance measurement tool of 3D Slicer 4.5 . Cranial and mandibular reference points on the bone surface were selected based on previously described landmarks (De Carlos et al. 2011). |
3D Finite Element Electrical Model of Larval Zebrafish ECG Signals
|
Publication: PLoS One. 2016 Nov 8;11(11):e0165655. PMID: 27824910 | PDF Authors: Crowcombe J, Dhillon SS, Hurst RM, Egginton S, Müller F, Sík A, Tarte E. Institution: School of Engineering, University of Birmingham, Birmingham, UK. Background/Purpose: Assessment of heart function in zebrafish larvae using electrocardiography (ECG) is a potentially useful tool in developing cardiac treatments and the assessment of drug therapies. In order to better understand how a measured ECG waveform is related to the structure of the heart, its position within the larva and the position of the electrodes, a 3D model of a 3 days post fertilisation (dpf) larval zebrafish was developed to simulate cardiac electrical activity and investigate the voltage distribution throughout the body. The geometry consisted of two main components; the zebrafish body was modelled as a homogeneous volume, while the heart was split into five distinct regions (sinoatrial region, atrial wall, atrioventricular band, ventricular wall and heart chambers). Similarly, the electrical model consisted of two parts with the body described by Laplace's equation and the heart using a bidomain ionic model based upon the Fitzhugh-Nagumo equations. Each region of the heart was differentiated by action potential (AP) parameters and activation wave conduction velocities, which were fitted and scaled based on previously published experimental results. ECG measurements in vivo at different electrode recording positions were then compared to the model results. The model was able to simulate action potentials, wave propagation and all the major features (P wave, R wave, T wave) of the ECG, as well as polarity of the peaks observed at each position. This model was based upon our current understanding of the structure of the normal zebrafish larval heart. Further development would enable us to incorporate features associated with the diseased heart and hence assist in the interpretation of larval zebrafish ECGs in these conditions. Funding:
|
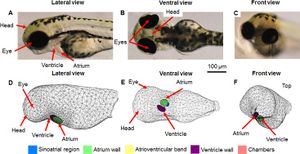 Comparison of 3D model geometry to 3 dpf zebrafish anatomy. A) lateral, B) ventral, C) front brightfield views; D) lateral, E) ventral F) front view of model. Different coloured regions highlight the distinct heart regions within the model. 3D Slicer was used to visualise the image stack and extract the main shape of the zebrafish] |
Extracted Magnetic Resonance Texture Features Discriminate between Phenotypes and are Associated with Overall Survival in Glioblastoma Multiforme Patients
|
Publication: Med Biol Eng Comput. 2016 Nov;54(11):1707-18. PMID: 26960324 Authors: Chaddad A, Tanougast C. Institution: Laboratory of Design, Optimization and Modeling (LCOMS), University of Lorraine, Metz, France. Background/Purpose: GBM is a markedly heterogeneous brain tumor consisting of three main volumetric phenotypes identifiable on magnetic resonance imaging: necrosis (vN), active tumor (vAT), and edema/invasion (vE). The goal of this study is to identify the three glioblastoma multiforme (GBM) phenotypes using a texture-based gray-level co-occurrence matrix (GLCM) approach and determine whether the texture features of phenotypes are related to patient survival. MR imaging data in 40 GBM patients were analyzed. Phenotypes vN, vAT, and vE were segmented in a preprocessing step using 3D Slicer for rigid registration by T1-weighted imaging and corresponding fluid attenuation inversion recovery images. The GBM phenotypes were segmented using 3D Slicer tools. Texture features were extracted from GLCM of GBM phenotypes. Thereafter, Kruskal-Wallis test was employed to select the significant features. Robust predictive GBM features were identified and underwent numerous classifier analyses to distinguish phenotypes. Kaplan-Meier analysis was also performed to determine the relationship, if any, between phenotype texture features and survival rate. The simulation results showed that the 22 texture features were significant with p value <0.05. GBM phenotype discrimination based on texture features showed the best accuracy, sensitivity, and specificity of 79.31, 91.67, and 98.75 %, respectively. Three texture features derived from active tumor parts: difference entropy, information measure of correlation, and inverse difference were statistically significant in the prediction of survival, with log-rank p values of 0.001, 0.001, and 0.008, respectively. Among 22 features examined, three texture features have the ability to predict overall survival for GBM patients demonstrating the utility of GLCM analyses in both the diagnosis and prognosis of this patient population. |
Presurgical Visualization of the Neurovascular Relationship in Trigeminal Neuralgia with 3D Modeling using Free Slicer Software
|
Publication: Acta Neurochir (Wien). 2016 Nov;158(11):2195-2201. PMID: 27543280 Authors: Han KW, Zhang DF, Chen JG, Hou LJ. Institution: Department of Neurosurgery, Shanghai Neurosurgical Institute, Changzheng Hospital, Shanghai, China. Background/Purpose: o explore whether segmentation and 3D modeling are more accurate in the preoperative detection of the neurovascular relationship (NVR) in patients with trigeminal neuralgia (TN) compared to MRI fast imaging employing steady-state acquisition (FIESTA). METHOD: Segmentation and 3D modeling using 3D Slicer were conducted for 40 patients undergoing MRI FIESTA and microsurgical vascular decompression (MVD). The NVR, as well as the offending vessel determined by MRI FIESTA and 3D Slicer, was reviewed and compared with intraoperative manifestations using SPSS. RESULTS: The k agreement between the MRI FIESTA and operation in determining the NVR was 0.232 and that between the 3D modeling and operation was 0.6333. There was no significant difference between these two procedures (χ2 = 8.09, P = 0.088). The k agreement between the MRI FIESTA and operation in determining the offending vessel was 0.373, and that between the 3D modeling and operation was 0.922. There were significant differences between two of them (χ2 = 82.01, P = 0.000). The sensitivity and specificity for MRI FIESTA in determining the NVR were 87.2 % and 100 %, respectively, and for 3D modeling were both 100 %. CONCLUSION: The segmentation and 3D modeling were more accurate than MRI FIESTA in preoperative verification of the NVR and offending vessel. This was consistent with surgical manifestations and was more helpful for the preoperative decision and surgical plan. |
An Exploratory Study to Detect Ménière's Disease in Conventional MRI Scans Using Radiomics
|
Publication: Front Neurol. 2016 Nov 7;7:190. PMID: 27872606 | PDF Authors: van den Burg EL, van Hoof M, Postma AA, Janssen AM, Stokroos RJ, Kingma H, van de Berg R. Institution: Department of Otorhinolaryngology and Head and Neck Surgery, Maastricht University Medical Center, Maastricht, Netherlands. Background/Purpose: OBJECTIVE: The purpose of this exploratory study was to investigate whether a quantitative image analysis of the labyrinth in conventional magnetic resonance imaging (MRI) scans using a radiomics approach showed differences between patients with Ménière's disease (MD) and the control group. MATERIALS AND METHODS: In this retrospective study, MRI scans of the affected labyrinths of 24 patients with MD were compared to the MRI scans of labyrinths of 29 patients with an idiopathic asymmetrical sensorineural hearing loss. The 1.5- and 3-T MRI scans had been previously made in a clinical setting between 2008 and 2015. 3D Slicer 4.4 was used to extract several substructures of the labyrinth. A quantitative analysis of the normalized radiomic image features was performed in Mathematica 10. The image features of the two groups were statistically compared. RESULTS: For numerous image features, there was a statistically significant difference (p-value <0.05) between the MD group and the control group. The statistically significant differences in image features were localized in all the substructures of the labyrinth: 43 in the anterior semicircular canal, 10 in the vestibule, 22 in the cochlea, 12 in the posterior semicircular canal, 24 in the horizontal semicircular canal, 11 in the common crus, and 44 in the volume containing the reuniting duct. Furthermore, some figures contain vertical or horizontal bands (three or more statistically significant image features in the same image feature). Several bands were seen: 9 bands in the anterior semicircular canal, 1 band in the vestibule, 3 bands in the cochlea, 0 bands in the posterior semicircular canal, 5 bands in the horizontal semicircular canal, 3 bands in the common crus, and 10 bands in the volume containing the reuniting duct. CONCLUSION: In this exploratory study, several differences were found in image features between the MD group and the control group by using a quantitative radiomics approach on high resolution T2-weighted MRI scans of the labyrinth. Further research should be aimed at validating these results and translating them in a potential clinical diagnostic method to detect MD in MRI scans. |
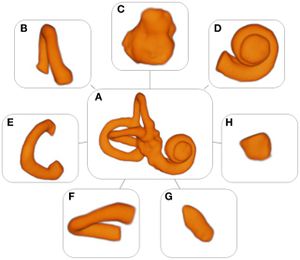 Models of the labyrinth and its substructures. (A) Labyrinth, (B) anterior semicircular canal, (C) vestibule, (D) cochlea, (E) posterior semicircular canal, (F) horizontal semicircular canal, (G) common crus, and (H) volume containing the reuniting duct. 3D Slicer 4.4, an open source software package for visualization and image analysis was used to extract the (sub)volumes from the MRI scans. |
Fully Automated Enhanced Tumor Compartmentalization: Man vs. Machine Reloaded
|
Publication: PLoS One. 2016 Nov 2;11(11):e0165302. PMID: 27806121 | PDF Authors: Porz N, Habegger S, Meier R, Verma R, Jilch A, Fichtner J, Knecht U, Radina C, Schucht P, Beck J, Raabe A, Slotboom J, Reyes M, Wiest R. Institution: Support Center for Advanced Neuroimaging, Institute for Diagnostic and Interventional Neuroradiology, University Hospital and University of Bern, Bern, Switzerland. Background/Purpose: Comparison of a fully-automated segmentation method that uses compartmental volume information to a semi-automatic user-guided and FDA-approved segmentation technique. METHODS: Nineteen patients with a recently diagnosed and histologically confirmed glioblastoma (GBM) were included and MR images were acquired with a 1.5 T MR scanner. Manual segmentation for volumetric analyses was performed using the open source software 3D Slicer version 4.2.2.3. Semi-automatic segmentation was done by four independent neurosurgeons and neuroradiologists using the computer-assisted segmentation tool SmartBrush® (referred to as SB), a semi-automatic user-guided and FDA-approved tumor-outlining program that uses contour expansion. Fully automatic segmentations were performed with the Brain Tumor Image Analysis (BraTumIA, referred to as BT) software. We compared manual (ground truth, referred to as GT), computer-assisted (SB) and fully-automated (BT) segmentations with regard to: (1) products of two maximum diameters for 2D measurements, (2) the Dice coefficient, (3) the positive predictive value, (4) the sensitivity and (5) the volume error. RESULTS: Segmentations by the four expert raters resulted in a mean Dice coefficient between 0.72 and 0.77 using SB. BT achieved a mean Dice coefficient of 0.68. Significant differences were found for intermodal (BT vs. SB) and for intramodal (four SB expert raters) performances. The BT and SB segmentations of the contrast-enhancing volumes achieved a high correlation with the GT. Pearson correlation was 0.8 for BT; however, there were a few discrepancies between raters (BT and SB 1 only). Additional non-enhancing tumor tissue extending the SB volumes was found with BT in 16/19 cases. The clinically motivated sum of products of diameters measure (SPD) revealed neither significant intermodal nor intramodal variations. The analysis time for the four expert raters was faster (1 minute and 47 seconds to 3 minutes and 39 seconds) than with BT (5 minutes). CONCLUSION: BT and SB provide comparable segmentation results in a clinical setting. SB provided similar SPD measures to BT and GT, but differed in the volume analysis in one of the four clinical raters. A major strength of BT may its independence from human interactions, it can thus be employed to handle large datasets and to associate tumor volumes with clinical and/or molecular datasets ("-omics") as well as for clinical analyses of brain tumor compartment volumes as baseline outcome parameters. Due to its multi-compartment segmentation it may provide information about GBM subcompartment compositions that may be subjected to clinical studies to investigate the delineation of the target volumes for adjuvant therapies in the future. |
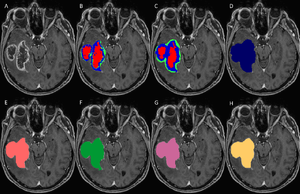 Set of MRI sequences used in this study for manual, automatic, and semi-automatic tumor volumetry. Original T1-weighted post-contrast MRI slice (A), manual subcompartmental segmentation into non-enhancing tumor (green), enhancing tumor (blue), and necrotic tissue (red) (B). BT subcompartmental segmentation into non-enhancing tumor (green), enhancing tumor (blue) and necrotic tissue (red) (C). BT core tumor segmentation (dark blue, D), SB1 core tumor segmentation (light red, E), SB2 core tumor segmentation (green, F), SB3 core tumor segmentation (purple, G) and SB4 core tumor segmentation (yellow, H). |
Glioblastoma Segmentation: Comparison of Three Different Software Packages
|
Publication: PLoS One. 2016 Oct 25;11(10):e0164891. PMID: 27780224 | PDF Authors: Fyllingen EH, Stensjøen AL, Berntsen EM, Solheim O, Reinertsen I. Institution: Department of Neurosurgery, St. Olav's University Hospital, Trondheim, Norway. Background/Purpose: To facilitate a more widespread use of volumetric tumor segmentation in clinical studies, there is an urgent need for reliable, user-friendly segmentation software. The aim of this study was therefore to compare three different software packages for semi-automatic brain tumor segmentation of glioblastoma; namely BrainVoyagerTM QX, ITK-Snap and 3D Slicer, and to make data available for future reference. Pre-operative, contrast enhanced T1-weighted 1.5 or 3 Tesla Magnetic Resonance Imaging (MRI) scans were obtained in 20 consecutive patients who underwent surgery for glioblastoma. MRI scans were segmented twice in each software package by two investigators. Intra-rater, inter-rater and between-software agreement was compared by using differences of means with 95% limits of agreement (LoA), Dice's similarity coefficients (DSC) and Hausdorff distance (HD). Time expenditure of segmentations was measured using a stopwatch. Eighteen tumors were included in the analyses. Inter-rater agreement was highest for BrainVoyager with difference of means of 0.19 mL and 95% LoA from -2.42 mL to 2.81 mL. Between-software agreement and 95% LoA were very similar for the different software packages. Intra-rater, inter-rater and between-software DSC were ≥ 0.93 in all analyses. Time expenditure was approximately 41 min per segmentation in BrainVoyager, and 18 min per segmentation in both 3D Slicer and ITK-Snap. Our main findings were that there is a high agreement within and between the software packages in terms of small intra-rater, inter-rater and between-software differences of means and high Dice's similarity coefficients. Time expenditure was highest for BrainVoyager, but all software packages were relatively time-consuming, which may limit usability in an everyday clinical setting. |
 Examples of user-interface for segmentation in the 3D Slicer software package. |
A New Giant Titanosauria (Dinosauria: Sauropoda) from the Late Cretaceous Bauru Group, Brazil
|
Publication: PLoS One. 2016 Oct 5;11(10):e0163373. PMID: 27706250 | PDF Authors: Bandeira KL, Medeiros Simbras F, Batista Machado E, de Almeida Campos D, Oliveira GR, Kellner AW. Institution: Laboratory of Systematics and Tafonomia of Fossil Vertebrates, Department of Geology and Paleontology, National Museum / Federal University of Rio de Janeiro, Brazil. Background/Purpose: Titanosaurian dinosaurs include some of the largest land-living animals that ever existed, and most were discovered in Cretaceous deposits of Argentina. Here we describe the first Brazilian gigantic titanosaur, Austroposeidon magnificus gen. et sp. nov., from the Late Cretaceous Presidente Prudente Formation (Bauru Group, Paraná Basin), São Paulo State, southeast Brazil. The size of this animal is estimated around 25 meters. It consists of a partial vertebral column composed by the last two cervical and the first dorsal vertebrae, all fairly complete and incomplete portions of at least one sacral and seven dorsal elements. The new species displays four autapomorphies: robust and tall centropostzygapophyseal laminae (cpol) in the last cervical vertebrae; last cervical vertebra bearing the posterior centrodiapophyseal lamina (pcdl) bifurcated; first dorsal vertebra with the anterior and posterior centrodiapophyseal laminae (acdl/pcdl) curved ventrolaterally, and the diapophysis reaching the dorsal margin of the centrum; posterior dorsal vertebra bearing forked spinoprezygapophyseal laminae (sprl). The phylogenetic analysis presented here reveals that Austroposeidon magnificus is the sister group of the Lognkosauria. CT scans reveal some new osteological internal features in the cervical vertebrae such as the intercalation of dense growth rings with camellae, reported for the first time in sauropods. The new taxon further shows that giant titanosaurs were also present in Brazil during the Late Cretaceous and provides new information about the evolution and internal osteological structures in the vertebrae of the Titanosauria clade. |
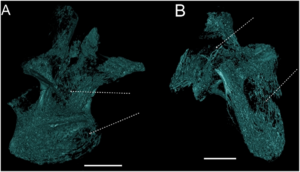 The tentatively 3D reconstruction of the internal pneumatic structures in Austroposeidon magnificus gen. et sp. nov. (A) The last cervical vertebra (Cv13) in posterolateral view. (B) First dorsal vertebra in left posterolateral view. The internal pneumatic connections suggest a possible interconnection of all the internal pneumatic structures throughout the entire vertebral body (light green). Scale bar: 100mm. Data were reconstructed in a free software 3D Slicer, version 4.4.0 [41]. |
Two-Center Prospective, Randomized, Clinical, and Radiographic Study Comparing Osteotome Sinus Floor Elevation with or without Bone Graft and Simultaneous Implant Placement
|
Publication: Clin Implant Dent Relat Res. 2016 Oct;18(5):873-82. PMID: 26315564 Authors: Markovic A, Misic T, Calvo-Guirado JL, Delgado-Ruiz RA, Janjic B, Abboud M. Institution: Clinic of Oral Surgery, School of Dental Medicine, University of Belgrade, Belgrade, Serbia. Background/Purpose: To evaluate stability and success rate of hydrophilic nanostructured implants placed via osteotome sinus floor elevation (OSFE) without grafting material or using β-tricalcium phosphate (β-TCP), deproteinized bovine bone (DBB), or their combination, and also to assess three-dimensional volumetric stability of endo-sinus bone gained in the aforementioned conditions. MATERIALS AND METHODS: OSFE with simultaneous implant placement (10-mm long SLActive-BL® , Straumann, Basel, Switzerland) was performed. Grafting materials were randomly allocated to implant sites, whereas one site was left without graft. Implant stability was measured by resonance frequency analysis over 6 months. Implant success was evaluated after 2 years of loading. Volume of new endo-sinus bone was calculated from CBCT images using 3D Slicer software. RESULTS: A total of 180 implants were inserted into posterior maxilla of 45 patients with 6.59 ± 0.45 mm of residual bone height, and all remained successful after 2 years. Implant stability steadily increased during healing, without significant difference between groups (p = .658). After 2 years, endo-sinus bone significantly shrank (p < .001) in all groups (DBB:66.34%; β-TCP:61.44%; new bone formed from coagulum: 53.02%; β-TCP + DBB:33.47%). CONCLUSIONS: Endo-sinus bone gained after OSFE inevitably and significantly shrinks regardless of whether grafting material is applied or not. Grafting material offers no significant advantage to stability nor clinical success of hydrophilic and nanostructured implants placed simultaneously with OSFE. |
Mapping 3D fiber Orientation in Tissue using Dual-angle Optical Polarization Tractography
|
Publication: Biomed Opt Express. 2016 Sep 1;7(10):3855-70. PMID: 27867698 | PDF Authors: Wang Y, Ravanfar M, Zhang K, Duan D, Yao G. Institution: Department of Bioengineering, University of Missouri, Columbia, MO, USA. Background/Purpose: Optical polarization tractography (OPT) has recently been applied to map fiber organization in the heart, skeletal muscle, and arterial vessel wall with high resolution. The fiber orientation measured in OPT represents the 2D projected fiber angle in a plane that is perpendicular to the incident light. We report here a dual-angle extension of the OPT technology to measure the actual 3D fiber orientation in tissue. This method was first verified by imaging the murine extensor digitorum muscle placed at various known orientations in space. The accuracy of the method was further studied by analyzing the 3D fiber orientation of the mouse tibialis anterior muscle. Finally we showed that dual-angle OPT successfully revealed the unique 3D "arcade" fiber structure in the bovine articular cartilage. |
 3D visualization of a piece of the bovine cartilage in (a) intensity, (b) 3D fiber tractography from dual-angle measurements, and (c) the 2D tractography by projecting the 3D fibers shown in (b) to the AB-, AC-, and BC-plane as labeled in (a). The 3D Slicer software was used for visualizing the 3D OPT results. |
The Impact of Diffusion-Weighted MRI on the Definition of Gross Tumor Volume in Radiotherapy of Non-Small-Cell Lung Cancer
|
Publication: PLoS One. 2016 Sep 9;11(9):e0162816. PMID: 27612171 | PDF Authors: Fleckenstein J, Jelden M, Kremp S, Jagoda P, Stroeder J, Khreish F, Ezziddin S, Buecker A, Rübe C, Schneider GK. Institution: Department of Radiotherapy and Radiation Oncology, Saarland University Medical Center, Homburg, Germany. Background/Purpose: The study was designed to evaluate diffusion-weighted magnetic resonance imaging (DWI) vs. PET-CT of the thorax in the determination of gross tumor volume (GTV) in radiotherapy planning of non-small-cell lung cancer (NSCLC). MATERIALS AND METHODS: Eligible patients with NSCLC who were supposed to receive definitive radio(chemo)therapy were prospectively recruited. For MRI, a respiratory gated T2-weighted sequence in axial orientation and non-gated DWI (b = 0, 800, 1,400 and apparent diffusion coefficient map [ADC]) were acquired on a 1.5 Tesla scanner. Primary tumors were delineated on FDG-PET/CT (stGTV) and DWI images (dwGTV). The definition of stGTV was based on the CT and visually adapted to the FDG-PET component if indicated (e.g., in atelectasis). For DWI, dwGTV was visually determined and adjusted for anatomical plausibility on T2w sequences. Beside a statistical comparison of stGTV and dwGTB, spatial agreement was determined with the "Hausdorff-Distance" (HD) and the "Dice Similarity Coefficient" (DSC). RESULTS: Fifteen patients (one patient with two synchronous NSCLC) were evaluated. For 16 primary tumors with UICC stages I (n = 4), II (n = 3), IIIA (n = 2) and IIIB (n = 7) mean values for dwGTV were significantly larger than those of stGTV (76.6 ± 84.5 ml vs. 66.6 ± 75.2 ml, p<0.01). The correlation of stGTV and dwGTV was highly significant (r = 0.995, p<0.001). Yet, some considerable volume deviations between these two methods were observed (median 27.5%, range 0.4-52.1%). An acceptable agreement between dwGTV and stGTV regarding the spatial extent of primary tumors was found (average HD: 2.25 ± 0.7 mm; DC 0.68 ± 0.09). CONCLUSION: The overall level of agreement between PET-CT and MRI based GTV definition is acceptable. Tumor volumes may differ considerably in single cases. DWI-derived GTVs are significantly, yet modestly, larger than their PET-CT based counterparts. Prospective studies to assess the safety and efficacy of DWI-based radiotherapy planning in NSCLC are warranted. |
Multicenter Evaluation of Geometric Accuracy of MRI Protocols Used in Experimental Stroke
|
Publication: PLoS One. 2016 Sep 7;11(9):e0162545. PMID: 27603704 | PDF Authors: Milidonis X, Lennen RJ, Jansen MA, Mueller S, Boehm-Sturm P, Holmes WM, Sena ES, Macleod MR, Marshall I. Institution: Centre for Clinical Brain Sciences, University of Edinburgh, Edinburgh, UK. Background/Purpose: It has recently been suggested that multicenter preclinical stroke studies should be carried out to improve translation from bench to bedside, but the accuracy of magnetic resonance imaging (MRI) scanners routinely used in experimental stroke has not yet been evaluated. We aimed to assess and compare geometric accuracy of preclinical scanners and examine the longitudinal stability of one scanner using a simple quality assurance (QA) protocol. Six 7 Tesla animal scanners across six different preclinical imaging centers throughout Europe were used to scan a small structural phantom and estimate linear scaling errors in all orthogonal directions and volumetric errors. Between-scanner imaging consisted of a standard sequence and each center's preferred sequence for the assessment of infarct size in rat models of stroke. The standard sequence was also used to evaluate the drift in accuracy of the worst performing scanner over a period of six months following basic gradient calibration. Scaling and volumetric errors using the standard sequence were less variable than corresponding errors using different stroke sequences. The errors for one scanner, estimated using the standard sequence, were very high (above 4% scaling errors for each orthogonal direction, 18.73% volumetric error). Calibration of the gradient coils in this system reduced scaling errors to within ±1.0%; these remained stable during the subsequent 6-month assessment. In conclusion, despite decades of use in experimental studies, preclinical MRI still suffers from poor and variable geometric accuracy, influenced by the use of miscalibrated systems and various types of sequences for the same purpose. For effective pooling of data in multicenter studies, centers should adopt standardized procedures for system QA and in vivo imaging. |
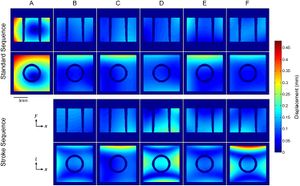 Deformation needed to recover reference CT scans from MRI data. The maps show the in-plane absolute Euclidean displacement required to recover the true shape of the phantom in axial (x-y) and coronal (x-z) MRI data from the between-scanner variability assessment. Phase encoding is in the horizontal direction (x) in both planes. It is evident that scanning using an identical (standard) sequence ensures better correspondence between images from scanners “B”-“F” in terms of distortion effects. Correspondence declined when stroke sequences “b”-“f” were used, particularly in the coronal plane. Furthermore, overall distortion was characterized by two differing patterns; images from system “A” were uniformly stretched in both directions, whereas minor non-linearities were present in images from systems “B”-“F”. It should be emphasized that while these deformation maps successfully demonstrate the overall distortion of the MRI data compared to reference images, they do not represent the true geometric distortion in the MRI systems; a phantom with a large number of equidistant control points (grid structure) is often required for this purpose. Corresponding MRI images are shown in S2 Fig. |
Three-Dimensional Simulation of Collision-Free Paths for Combined Endoscopic Third Ventriculostomy and Pineal Region Tumor Biopsy: Implications for the Design Specifications of Future Flexible Endoscopic Instruments
|
Publication: Oper Neurosurg (Hagerstown). 2016 Sep 1;12(3):231-238. PMID: 29506110 Authors: Eastwood KW, Bodani VP, Drake JM. Institution: Institute of Biomaterials and Biomedical Engineering, Faculty of Medicine, University of Toronto, Toronto, Ontario, Canada. Abstract: BACKGROUND: Recent innovations to expand the scope of intraventricular neuroendoscopy have focused on transitioning multiple-incision procedures into single-corridor approaches. However, the successful adoption of these combined procedures requires minimizing the unwanted torques applied to surrounding healthy structures. OBJECTIVE: To define the geometry of relevant anatomical structures in endoscopic third ventriculostomy (ETV) and pineal region tumor biopsy (ETB). Second, to determine the optimal instrument shaft path required for collision-free single burr hole combined ETV/ETB. METHODS: Magnetic resonance and computed tomography data from 15 pediatric patients who underwent both ETV and ETB procedures between 2006 and 2014 was segmented by using the 3D Slicer software package to create virtual 3-D patient models. Anatomical regions of interest were measured including the foramen of Monro, the massa intermedia, the floor of the third ventricle, and the tumor margin. Utilizing the MATLAB software package, virtual dexterous instruments were inserted into the models and optimal dimensions were calculated. RESULTS: The diameters of the foramen of Monro, massa intermedia (anterior-posterior, superior-inferior), anterior third ventricle, and tumor margin are 6.85, 4.01, 5.05, 14.2, and 28.5 mm, respectively. The average optimal burr placement was determined to be 22.5 mm anterior to the coronal and 30 mm lateral to the sagittal sutures. Optimal flexible instrument geometries for novel instruments were calculated. CONCLUSION: We have established a platform for estimating the shape of novel curved dexterous instruments for collision-free targeting of multiple intraventricular points, which is both patient and tool specific and can be integrated with image guidance. These data will aid in developing novel dexterous instruments. |
An Open-Source Label Atlas Correction Tool and Preliminary Results on Huntingtons Disease Whole-Brain MRI Atlases
|
Publication: Front Neuroinform. 2016 Aug 3;10:29. PMID: 27536233 | PDF Authors: Forbes JL, Kim RE, Paulsen JS, Johnson HJ. Institution: Department of Psychiatry, University of IowaIowa City, IA, USA. Abstract: The creation of high-quality medical imaging reference atlas datasets with consistent dense anatomical region labels is a challenging task. Reference atlases have many uses in medical image applications and are essential components of atlas-based segmentation tools commonly used for producing personalized anatomical measurements for individual subjects. The process of manual identification of anatomical regions by experts is regarded as a so-called gold standard; however, it is usually impractical because of the labor-intensive costs. Further, as the number of regions of interest increases, these manually created atlases often contain many small inconsistently labeled or disconnected regions that need to be identified and corrected. This project proposes an efficient process to drastically reduce the time necessary for manual revision in order to improve atlas label quality. We introduce the LabelAtlasEditor tool, a SimpleITK-based open-source label atlas correction tool distributed within the image visualization software 3D Slicer. LabelAtlasEditor incorporates several 3D Slicer widgets into one consistent interface and provides label-specific correction tools, allowing for rapid identification, navigation, and modification of the small, disconnected erroneous labels within an atlas. The technical details for the implementation and performance of LabelAtlasEditor are demonstrated using an application of improving a set of 20 Huntingtons Disease-specific multi-modal brain atlases. Additionally, we present the advantages and limitations of automatic atlas correction. After the correction of atlas inconsistencies and small, disconnected regions, the number of unidentified voxels for each dataset was reduced on average by 68.48%. |
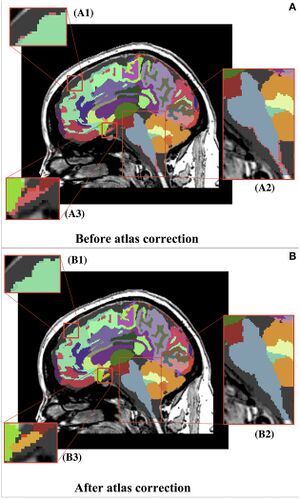 Before (A) and after (B) representation of the whole brain atlas and zoomed-in views of atlas corrections. (A) Thousands of undefined voxels occur at label borders (pink) because of partial volume effects. (B) The automatic dust removal process assigned previously undefined voxels and isolated islands. (B1) Displays the reassignment of unsegmented voxels (pink) from (A1) to the superior frontal label (teal). (B2) Displays the reassignment of unsegmented voxels (pink) from (A2) to the brainstem label (blue). (B3) Displays the reassignment of unsegmented voxels (pink) from (A3) to a new, manually identified label for the optic chiasm (yellow). It can be seen that the overall segmentations were maintained. |
An Open Tool for Input Function Estimation and Quantification of Dynamic PET FDG Brain Scans
|
Publication: Int J Comput Assist Radiol Surg. 2016 Aug;11(8):1419-30. PMID: 26514683 Authors: Bertran M, Martinez N, Carbajal G, Fernandez A, Gomez A. Institution: Institute of Electrical Engineering, Faculty of Engineering, University of the Republic, Montevideo, Uruguay. Background/Purpose: Positron emission tomography (PET) analysis of clinical studies is mostly restricted to qualitative evaluation. Quantitative analysis of PET studies is highly desirable to be able to compute an objective measurement of the process of interest in order to evaluate treatment response and/or compare patient data. But implementation of quantitative analysis generally requires the determination of the input function: the arterial blood or plasma activity which indicates how much tracer is available for uptake in the brain. The purpose of our work was to share with the community an open software tool that can assist in the estimation of this input function, and the derivation of a quantitative map from the dynamic PET study. Methods: Arterial blood sampling during the PET study is the gold standard method to get the input function, but is uncomfortable and risky for the patient so it is rarely used in routine studies. To overcome the lack of a direct input function, different alternatives have been devised and are available in the literature. These alternatives derive the input function from the PET image itself (image-derived input function) or from data gathered from previous similar studies (population-based input function). In this article, we present ongoing work that includes the development of a software tool that integrates several methods with novel strategies for the segmentation of blood pools and parameter estimation. Results: The tool is available as an extension to the 3D Slicer software. Tests on phantoms were conducted in order to validate the implemented methods. We evaluated the segmentation algorithms over a range of acquisition conditions and vasculature size. Input function estimation algorithms were evaluated against ground truth of the phantoms, as well as on their impact over the final quantification map. End-to-end use of the tool yields quantification maps with [Formula: see text] relative error in the estimated influx versus ground truth on phantoms. Conclusions: The main contribution of this article is the development of an open-source, free to use tool that encapsulates several well-known methods for the estimation of the input function and the quantification of dynamic PET FDG studies. Some alternative strategies are also proposed and implemented in the tool for the segmentation of blood pools and parameter estimation. The tool was tested on phantoms with encouraging results that suggest that even bloodless estimators could provide a viable alternative to blood sampling for quantification using graphical analysis. The open tool is a promising opportunity for collaboration among investigators and further validation on real studies. |
Congenital and Acquired Mandibular Asymmetry: Mapping Growth and Remodeling in 3 Dimensions
|
Publication: Am J Orthod Dentofacial Orthop. 2016 Aug;150(2):238-51. PMID: 27476356 | PDF Authors: Solem RC, Ruellas A, Miller A, Kelly K, Ricks-Oddie JL, Cevidanes L. Institution: Section of Orthodontics, University of California, Los Angeles, CA, USA. Background/Purpose: Disordered craniofacial development frequently results in definitive facial asymmetries that can significantly impact a person's social and functional well-being. The mandible plays a prominent role in defining facial symmetry and, as an active region of growth, commonly acquires asymmetric features. Additionally, syndromic mandibular asymmetry characterizes craniofacial microsomia (CFM), the second most prevalent congenital craniofacial anomaly (1:3000 to 1:5000 live births) after cleft lip and palate. We hypothesized that asymmetric rates of mandibular growth occur in the context of syndromic and acquired facial asymmetries. METHODS: To test this hypothesis, a spherical harmonic-based shape correspondence algorithm was applied to quantify and characterize asymmetries in mandibular growth and remodeling in 3 groups during adolescence. Longitudinal time points were automatically registered, and regions of the condyle and posterior ramus were selected for growth quantification. The first group (n = 9) had a diagnosis of CFM, limited to Pruzansky-Kaban type I or IIA mandibular deformities. The second group (n = 10) consisted of subjects with asymmetric, nonsyndromic dentofacial asymmetry requiring surgical intervention. A control group (n = 10) of symmetric patients was selected for comparison. A linear mixed model was used for the statistical comparison of growth asymmetry between the groups. RESULTS: Initial mandibular shape and symmetry displayed distinct signatures in the 3 groups (P <0.001), with the greatest asymmetries in the condyle and ramus. Similarly, mandibular growth had unique patterns in the groups. The dentofacial asymmetry group was characterized by significant asymmetry in condylar and posterior ramal remodeling with growth (P <0.001). The CFM group was characterized by asymmetric growth of the posterior ramus (P <0.001) but relatively symmetric growth of the condyles (P = 0.47). CONCLUSIONS: Forms of CFM are characterized by active and variable growth of the dysplastic side, which has a distinct pattern from other disorders of mandibular growth. Funding:
|
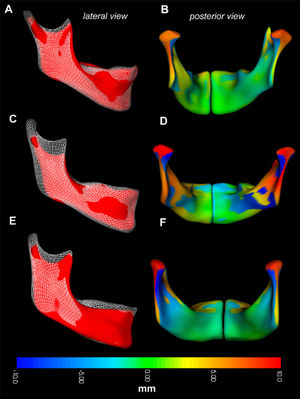 Regional growth in the control group. Regional growth of the mandible is shown in the control group as an overlay of registered longitudinal mandibular surfaces of the same subject. Three subjects are shown from a lateral perspective, with T0 shown as a red surface, and T1 shown as a white mesh overlay (lateral views: A, C, and E). Growth in the same 3 subjects is measured as the displacement between corresponding points, show as a millimeter color scale in B, D, and F. Separate right and left hemimandibles required for shape correspondence analysis are fused into a single image. On the colored surfaces, outward apposition is shown in yellow-red color. Inward resorption is shown in turquoise-blue color. Areas in green had undetectable changes. A and B, Mandibular growth in a boy (patient A2) from T0 (age, 10.7 years) to T1 (12.4 years). C and D, Mandibular growth in a girl (patient A1) from T0 (age, 12.3 years) to T1 (14.2 years). E and F, Mandibular growth in a girl (patient A3) from T0 (age, 10.8 years) to T1 (13.8 years). The CMF growing registration module in the free open-source software 3D Slicer. |
Evaluating the Utility of "3D Slicer" as a Fast and Independent Tool to Assess Intrafractional Organ Dose Variations in Gynecological Brachytherapy
|
Publication: Brachytherapy. 2016 Jul-Aug;15(4):514-23. PMID: 27180127 Authors: Siavashpour Z, Aghamiri MR, Jaberi R, Dehghan-Manshadi HR, Sedaghat M, Kirisits C. Institution: Department of Medical Radiation Engineering, Shahid Beheshti University, Tehran, Iran. Background/Purpose: To demonstrate the utility of 3D Slicer for easy treatment verification by comparing dose-volume histograms (DVHs) calculated on pretreatment and post-treatment images. Methods and Materials: Thirty cervical cancer patients were CT scanned twice: first for treatment planning and a second time after the dose delivery. The initial plan was manually duplicated on the post-treatment image set in Flexiplan treatment planning system, and DVH parameters were calculated. Pretreatment and post-treatment images, organ structures, and plan data were exported from the treatment planning system to 3D Slicer to validate DVH parameter calculation with 3D Slicer. The gamma analysis was used to compare Flexiplan and 3D Slicer DVHs. Post-treatment images were rigidly fused on the initial CT to automatically transfer the data of the pretreatment plan onto the post-treatment images. DVH parameters were calculated in 3D Slicer for both image sets, and their relative variations were compared. Results: In calculating DVH parameter variations, no significant differences were observed between Flexiplan and 3D Slicer. Where the registration accuracy was better than 0.03, they returned similar results for D2 cm3 of bladder, rectum, and sigmoid. Mean and standard deviation of DVH parameters were calculated on pretreatment and posttreatment images for several organs; both the manually duplicated plan and the automatically registered plan in SlicerRT returned comparable relative variations of these parameters. For 88% of the organs, more than 95% of the DVH dose bins passed the gamma analysis. Conclusions: We tested an automated DVH assessment method with an imaging freeware, 3D Slicer, for use in image-guided adaptive brachytherapy. SlicerRT is a viable verification tool to report and detect DVH variations between different contoured images series. |
Quantification of Diaphragm Mechanics in Pompe Disease using Dynamic 3D MRI
|
Publication: PLoS One. 2016 Jul 8;11(7):e0158912. PMID: 27391236 | PDF Authors: Mogalle K, Perez-Rovira A, Ciet P, Wens SC, van Doorn PA, Tiddens HA, van der Ploeg AT, de Bruijne M. Institution: Biomedical Imaging Group Rotterdam, Departments of Medical Informatics & Radiology, Erasmus MC, Rotterdam, the Netherlands. Background/Purpose: Diaphragm weakness is the main reason for respiratory dysfunction in patients with Pompe disease, a progressive metabolic myopathy affecting respiratory and limb-girdle muscles. Since respiratory failure is the major cause of death among adult patients, early identification of respiratory muscle involvement is necessary to initiate treatment in time and possibly prevent irreversible damage. In this paper we investigate the suitability of dynamic MR imaging in combination with state-of-the-art image analysis methods to assess respiratory muscle weakness. Methods: The proposed methodology relies on image registration and lung surface extraction to quantify lung kinematics during breathing. This allows for the extraction of geometry and motion features of the lung that characterize the independent contribution of the diaphragm and the thoracic muscles to the respiratory cycle. Results: Results in 16 3D+t MRI scans (10 Pompe patients and 6 controls) of a slow expiratory maneuver show that kinematic analysis from dynamic 3D images reveals important additional information about diaphragm mechanics and respiratory muscle involvement when compared to conventional pulmonary function tests. Pompe patients with severely reduced pulmonary function showed severe diaphragm weakness presented by minimal motion of the diaphragm. In patients with moderately reduced pulmonary function, cranial displacement of posterior diaphragm parts was reduced and the diaphragm dome was oriented more horizontally at full inspiration compared to healthy controls. Conclusion: Dynamic 3D MRI provides data for analyzing the contribution of both diaphragm and thoracic muscles independently. The proposed image analysis method has the potential to detect less severe diaphragm weakness and could thus be used to determine the optimal start of treatment in adult patients with Pompe disease in prospect of increased treatment response. Funding:
|
 Mesh representation of 3D lung segmentation. A trained medical observer manually segmented right and left lung in both static scans (inspiration and expiration) of each subject by tracing the lung surface in every second axial slice using 3D Slicer. |
Development of a Nomogram Combining Clinical Staging with 18F-FDG PET/CT Image Features in Non-small-cell Lung Cancer Stage I-III
|
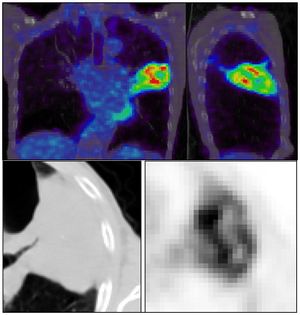
Publication: Eur J Nucl Med Mol Imaging. 2016 Jul;43(8):1477-85. PMID: 26896298 | PDF Authors: Desseroit MC, Visvikis D, Tixier F, Majdoub M, Perdrisot R, Guillevin R, Cheze Le Rest, Hatt M. Institution: Nuclear Medicine, University Hospital, Poitiers, France. Background/Purpose: Our goal was to develop a nomogram by exploiting intratumor heterogeneity on CT and PET images from routine 18F-FDG PET/CT acquisitions to identify patients with the poorest prognosis. Methods: This retrospective study included 116 patients with NSCLC stage I, II or III and with staging 18F-FDG PET/CT imaging. Primary tumor volumes were delineated using the FLAB algorithm and 3D Slicer on PET and CT images, respectively. PET and CT heterogeneities were quantified using texture analysis. The reproducibility of the CT features was assessed on a separate test-retest dataset. The stratification power of the PET/CT features was evaluated using the Kaplan-Meier method and the log-rank test. The best standard metric (functional volume) was combined with the least redundant and most prognostic PET/CT heterogeneity features to build the nomogram. Results: PET entropy and CT zone percentage had the highest complementary values with clinical stage and functional volume. The nomogram improved stratification amongst patients with stage II and III disease, allowing identification of patients with the poorest prognosis (clinical stage III, large tumor volume, high PET heterogeneity and low CT heterogeneity). Conclusion: Intratumor heterogeneity quantified using textural features on both CT and PET images from routine staging18F-FDG PET/CT acquisitions can be used to create a nomogram with higher stratification power than staging alone. |
] |
Patient and Aneurysm Characteristics Associated with Rupture Risk of Multiple Intracranial Aneurysms in the Anterior Circulation System
|
Publication: Acta Neurochir (Wien). 2016 Jul;158(7):1367-75. PMID: 27165300 Authors: Jiang H, Weng YX, Zhu Y, Shen J, Pan JW, Zhan RY. Institution: Department of Neurosurgery, The First Affiliated Hospital, School of Medicine, Zhejiang University, Zhejiang, China. Background/Purpose: Multiple intracranial aneurysms (MIAs) are associated with poorer outcomes after rupture than are single intracranial aneurysms (SIAs). Although the risk factors for intracranial aneurysm rupture have been widely investigated, few studies have focused on MIAs. Thus, the present study aimed to determine whether there are differences in the patient and aneurysm characteristics between those with ruptured and unruptured anterior circulation MIAs (AC-MIAs). Method: The present study included 97 patients with AC-MIAs (58 ruptured, 39 unruptured). Data regarding patient characteristics, aneurysm location, mirror aneurysms (MirAns), and bleb formations were collected from medical records and angiography images. Three-dimensional (3D) geometries generated with a 3D Slicer were evaluated to determine the range of morphological parameters. A univariate analysis was conducted to identify significant differences between the groups and receiver-operating characteristic (ROC) analyses were performed for each morphological parameter. Results: There are significantly fewer patients younger than 40 years of age in the ruptured group (P = 0.04); although the groups did not significantly differ with regard to smoking and hypertension, the ruptured group included significantly more current smokers who smoked more than 20 cigarettes per day (P = 0.025) and significantly more patients with a history of hypertension but an irregular use of anti-hypertensive medications (P = 0.043). Ruptured AC-MIAs were more likely to be located in the internal carotid artery (ICA) communicating artery (ICA C7) and anterior communicating artery (AComA; P = 0.000), to have formed a pair of MirAns (P = 0.001), and to have a bleb formation (P = 0.000). In terms of morphological parameters, the two groups differed significantly regarding aneurysm size (P = 0.000), neck width (P = 0.016), bottleneck factor (BNF; P = 0.000), height/width ratio (H/W; P = 0.031), aspect ratio (AR; P = 0.000) and size ratio (SR; P = 0.000). Additionally, the ROC analyses revealed that the optimal threshold size for rupture was 4.00 mm and that the SR had the highest area under the curve (AUC) value (0.826). Conclusions: The present study found that current smokers who smoked more than 20 cigarettes per day and those with hypertension but an irregular use of anti-hypertensive medications were more likely to suffer from rupture. Aneurysm location and bleb formation were closely related to the rupture of AC-MIAs, and SR was a better predictor of AC-MIAs rupture status than size, neck width, BNF, H/W and AR. These findings should be verified by future prospective follow-up studies of AC-MIAs. |
Optimizing Timing of Immunotherapy Improves Control of Tumors by Hypofractionated Radiation Therapy
|
Publication: PLoS One. 2016 Jun 9;11(6):e0157164. PMID: 27281029 | PDF Authors: Young KH, Baird JR, Savage T, Cottam B, Friedman D, Bambina S, Messenheimer DJ, Fox B, Newell P, Bahjat KS, Gough MJ, Crittenden MR. Institution: Earle A. Chiles Research Institute, Robert W. Franz Cancer Center, Providence Portland Medical Center, Portland, OR, USA. Background/Purpose: The anecdotal reports of promising results seen with immunotherapy and radiation in advanced malignancies have prompted several trials combining immunotherapy and radiation. However, the ideal timing of immunotherapy with radiation has not been clarified. Tumor bearing mice were treated with 20Gy radiation delivered only to the tumor combined with either anti-CTLA4 antibody or anti-OX40 agonist antibody. Immunotherapy was delivered at a single timepoint around radiation. Surprisingly, the optimal timing of these therapies varied. Anti-CTLA4 was most effective when given prior to radiation therapy, in part due to regulatory T cell depletion. Administration of anti-OX40 agonist antibody was optimal when delivered one day following radiation during the post-radiation window of increased antigen presentation. Combination treatment of anti-CTLA4, radiation, and anti-OX40 using the ideal timing in a transplanted spontaneous mammary tumor model demonstrated tumor cures. These data demonstrate that the combination of immunotherapy and radiation results in improved therapeutic efficacy, and that the ideal timing of administration with radiation is dependent on the mechanism of action of the immunotherapy utilized. Funding:
|
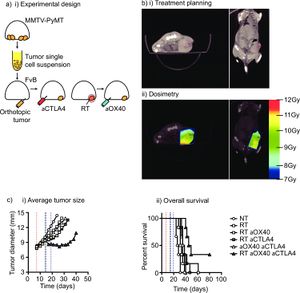 Combination immunotherapy and radiation therapy of spontaneous mammary tumors in immune competent mice. (a) MMTV-PyMT tumors were harvested from approximately 100 day old female MMTV-PyMT+ mice, the tumor disrupted ex vivo and 1x10⁶ viable cells injected orthotopically into immunocompetent syngeneic FVB mice. (b) Mice with d14-d17 tumors underwent CT-guided radiation therapy (RT) using a Small Animal Radiation Research Platform and i) images used to place isocenters within individual mammary tumors and collimeters and beam angles designed to deliver focal radiation to the tumor and minimal dose to radiosensitive organs. ii) CT images were segmented by tissue density and this information used to predict dose delivery. Mice were also randomized to receive 250μg anti-CTLA4 immunotherapy 7d prior to RT, and 250μg anti-OX40 immunotherapy d1 and d4 following radiation. (c) Graphs show i) average tumor growth and ii) overall survival. |
X-ray Computed Tomography Datasets for Forensic Analysis of Vertebrate Fossils
|
Publication: Sci Data. 2016 Jun 7;3:160040. PMID: 27272251 | PDF Authors: Rowe TB, Luo ZX, Ketcham RA, Maisano JA, Colbert MW. Institution: High-Resolution X-ray CT Facility, Department of Geological Sciences, The University of Texas, Austin, TX, USA. Background/Purpose: We describe X-ray computed tomography (CT) datasets from three specimens recovered from Early Cretaceous lakebeds of China that illustrate the forensic interpretation of CT imagery for paleontology. Fossil vertebrates from thinly bedded sediments often shatter upon discovery and are commonly repaired as amalgamated mosaics grouted to a solid backing slab of rock or plaster. Such methods are prone to inadvertent error and willful forgery, and once required potentially destructive methods to identify mistakes in reconstruction. CT is an efficient, nondestructive alternative that can disclose many clues about how a specimen was handled and repaired. These annotated datasets illustrate the power of CT in documenting specimen integrity and are intended as a reference in applying CT more broadly to evaluating the authenticity of comparable fossils. Funding:
|
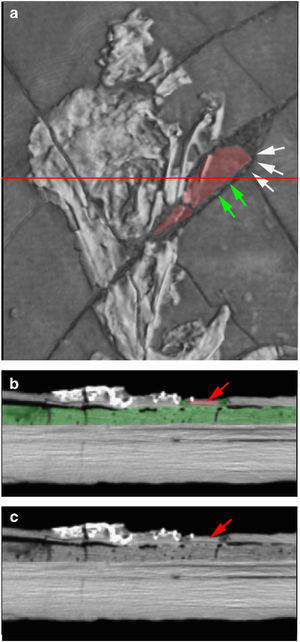 3-D volume rendering of the Confuciusornis skull, showing two mismatched admixed fragments in map view (a). The horizontal red line indicates the position of slice 74, which is shown as a colored cross section (b), and cross section without color (c). Color was added in Adobe Photoshop, to highlight the mismatched pieces. White arrows (a) indicate a mismatched rounded edge against which the squared corner of the extraneous red piece was fitted. Green arrows indicate ‘strings’ of grout used to hold the extraneous piece in place. Red arrows (b,c) point to the extraneous piece in cross section; note how thin it is compared to the pieces on either side, and that it is separated from adjacent bones by grout. |
Subregional Shape Alterations in the Amygdala in Patients with Panic Disorder
|
Publication: PLoS One. 2016 Jun 23;11(6):e0157856. PMID: 27336300 | PDF Authors: Yoon S, Kim JE, Kim GH, Kang HJ, Kim BR, Jeon S, Im JJ, Hyun H, Moon S, Lim SM, Lyoo IK. Institution: Ewha Brain Institute, Ewha Womans University, Seoul, South Korea. Background/Purpose: The amygdala has been known to play a pivotal role in mediating fear-related responses including panic attacks. Given the functionally distinct role of the amygdalar subregions, morphometric measurements of the amygdala may point to the pathophysiological mechanisms underlying panic disorder. The current study aimed to determine the global and local morphometric alterations of the amygdala related to panic disorder. Methods: Volumetric and surface-based morphometric approach to high-resolution three-dimensional T1-weighted images was used to examine the structural variations of the amygdala, with respect to extent and location, in 23 patients with panic disorder and 31 matched healthy individuals. Results: There were no significant differences in bilateral amygdalar volumes between patients with panic disorder and healthy individuals despite a trend-level right amygdalar volume reduction related to panic disorder (right, β = -0.23, p = 0.09, Cohen's d = 0.51; left, β = -0.18, p = 0.19, Cohen's d = 0.45). Amygdalar subregions were localized into three groups including the superficial, centromedial, and laterobasal groups based on the cytoarchitectonically defined probability map. Surface-based morphometric analysis revealed shape alterations in the laterobasal and centromedial groups of the right amygdala in patients with panic disorder (false discovery rate corrected p < 0.05). Conclusions: The current findings suggest that subregion-specific shape alterations in the right amygdala may be involved in the development and maintenance of panic disorder, which may be attributed to the cause or effects of amygdalar hyperactivation. Funding:
|
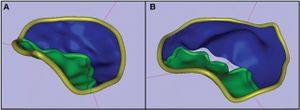
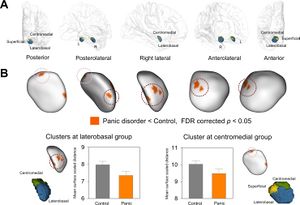 Clusters showing significant surface inward deformation in patients with panic disorder relative to healthy controls. (A) Surface rendering of cytoarchitectonically defined probabilistic maps of the superficial, centromedial, and laterobasal groups of the amygdala transposed onto the amygdalar template is presented. (B) Four clusters of inward deformation related to panic disorder at FDR corrected p < 0.05 are overlaid on the amygdalar template. Bar graphs show that mean surface scaled distance of clusters in the laterobasal and centromedial groups of the amygdala was lower in patients with panic disorder than in healthy individuals. Error bars indicate 95% confidence intervals. Abbreviations: FDR, false discovery rate. Surface rendering of amygdalar nuclei groups with 40% probability was performed using 3D Slicer and each nuclei group was manually transposed onto the amygdalar template (B). |
3D Mandibular Superimposition: Comparison of Regions of Reference for Voxel-Based Registration
|
Publication: PLoS One. 2016 Jun 23;11(6):e0157625. PMID: 27336366 | PDF Authors: Ruellas AC, Yatabe MS, Souki BQ, Benavides E, Nguyen T, Luiz RR, Franchi L, Cevidanes LH. Institution: School of Dentistry, Federal University of Rio de Janeiro, Rio de Janeiro, Brazil. Background/Purpose: The aim was to evaluate three regions of reference (Björk, Modified Björk and mandibular Body) for mandibular registration testing them in a patients' CBCT sample. Methods: Mandibular 3D volumetric label maps were built from CBCTs taken before (T1) and after treatment (T2) in a sample of 16 growing subjects and labeled with eight landmarks. Registrations of T1 and T2 images relative to the different regions of reference were performed, and 3D surface models were generated. Seven mandibular dimensions were measured separately for each time-point (T1 and T2) in relation to a stable reference structure (lingual cortical of symphysis), and the T2-T1 differences were calculated. These differences were compared to differences measured between the superimposed T2 (generated from different regions of reference: Björk, Modified Björk and Mandibular Body) over T1 surface models. ICC and the Bland-Altman method tested the agreement of the changes obtained by nonsuperimposition measurements from the patients' sample, and changes between the overlapped surfaces after registration using the different regions of reference. Results: The Björk region of reference (or mask) did work properly only in 2 of 16 patients. Evaluating the two other masks (Modified Björk and Mandibular body) on patients' scans registration, the concordance and agreement of the changes obtained from superimpositions (registered T2 over T1) compared to results obtained from non superimposed T1 and T2 separately, indicated that Mandibular Body mask displayed more consistent results. Conclusions: The mandibular body mask (mandible without teeth, alveolar bone, rami and condyles) is a reliable reference for 3D regional registration. Funding:
|
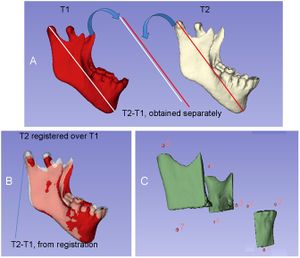 A) Representation of the measurements obtained independently from T1 and T2 and their difference; B) Representation of the T2-T1 differences based on mandibular registration; C) Partial 3D surface model of the mandible and representation of the 8 landmarks used for the measurements. A fully automated voxel-wise growing registration method was performed using 3D Slicer software. |
Morphological and Volumetric Assessment of Cerebral Ventricular System with 3D Slicer Software
|
Publication: J Med Syst. 2016 Jun;40(6):154. PMID: 27147517 Authors: Gonzalo Dominguez M, Hernandez C, Ruisoto P, Juanes JA, Prats A, Hernandez T. Institution: Medical Care Center in Zamora, Salamanca, Spain. Background/Purpose: We present a technological process based on the 3D Slicer software for the three-dimensional study of the brain's ventricular system with teaching purposes. It values the morphology of this complex brain structure, as a whole and in any spatial position, being able to compare it with pathological studies, where its anatomy visibly changes. 3D Slicer was also used to obtain volumetric measurements in order to provide a more comprehensive and detail representation of the ventricular system. We assess the potential this software has for processing high resolution images, taken from Magnetic Resonance and generate the three-dimensional reconstruction of ventricular system. |
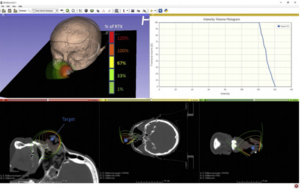
Visualization of the 3D Dosimetry for a Leipzig Brachytherapy Applicator Using 3D Slicer
|
Publication: IJ Brachytherapy 2016 May-June; 15(S1):S148. | PDF Authors: Deshazer G, Merck D, Collins S, Puthawala YM, Cobian JG. Institution: Diagnostic Imaging, Rhode Island Hospital, Providence, RI, USA. Background/Purpose: Surface brachytherapy (BT) is an alternative to electron beam therapy (EBRT) for the treatment of superficial skin lesions. Elekta’s (Elekta AB, Stockholm, Sweden) high dose-rate (HDR) BT solution utilizes conical surface applicators (Leipzig) connected to an 192-Ir remote afterloader with treatment planning accomplished using nomograms derived from Monte Carlo simulations. Since this approach provides no 3D dosimetry, prospective and retrospective analysis of the treatment volume and normal tissue coverage is not possible. To facilitate such analysis, we have developed a work flow for 3D Slicer [1] and SlicerRT [2] plug-in to import, view and calculate dose-volume histograms (DVH) for this BT application. Method: A HDR surface BT treatment plan for a superficial nose lesion was selected from our clinical database for this proof-of-principle study. A 3D CT dataset of the patient, with a fiducial marker placed on the area of palpable disease, was acquired at the beginning of the BT course to ascertain the required depth of treatment, 3mm. Using this information, a clinical treatment volume (CTV) was created to roughly approximate desired clinical coverage. Matlab (The MathWorks, Inc., Natick, MA) was used to create a 3D dose-rate distribution using the Leipzig ‘‘H2’’ applicator dose specifications presented by Perez-Calatayud et al. [1]. This distribution was scaled according to the delivered source dose rate and treatment prescription, 0.32 cGy h-1 U-1 and 400 cGy x 10, respectively. The dose distribution was imported into 3D Slicer and registered to the image set manually, using the known geometry of the applicator and radio-opaque fiducial marker as landmarks. Isodose visualization and DVH were calculated for the CTV using SlicerRT. Results: Figure 1 shows the relative 3D isodose distribution and resultant CTV DVH using this method. For this application, 100% of the hypothetical CTV receives prescription dose. The homogenous 3D dose distribution is able to be visualized on synthetic 2D axial, coronal and sagittal planes. Conclusion: This proof-of-principle investigation demonstrated the ability to visualize 3D dose distributions and calculate resultant DVH for segmented structures using a widely-available, non-commercial software package. With further development, this method has potential for providing more accurate spatial dose estimates for patient treatments and advance superficial HDR BT treatment planning to align with the current, clinically-utilized 3D treatment planning paradigms used for gynecological, prostate and breast HDR BT. Furthermore, this technique may serve as a platform for the development and verification of modelbased, inhomogenous dose calculation algorithms for superficial BT applications. |
Common 3-dimensional Coordinate System for Assessment of Directional Changes
|
Publication: Am J Orthod Dentofacial Orthop. 2016 May;149(5):645-56. PMID: 27131246 | PDF Authors: Ruellas AC, Tonello C, Gomes LR, Yatabe MS, Macron L, Lopinto J, Goncalves JR, Garib Carreira DG, Alonso N, Souki BQ, Coqueiro Rda S, Cevidanes LH. Institution: Federal University of Rio de Janeiro, Rio de Janeiro, Brazil. Background/Purpose: The aims of this study were to evaluate how head orientation interferes with the amounts of directional change in 3-dimensional (3D) space and to propose a method to obtain a common coordinate system using 3D surface models. Methods: Three-dimensional volumetric label maps were built for pretreatment (T1) and posttreatment (T2) from cone-beam computed tomography images of 30 growing subjects. Seven landmarks were labeled in all T1 and T2 volumetric label maps. Registrations of T1 and T2 images relative to the cranial base were performed, and 3D surface models were generated. All T1 surface models were moved by orienting the Frankfort horizontal, midsagittal, and transporionic planes to match the axial, sagittal, and coronal planes, respectively, at a common coordinate system in the 3D Slicer software (open-source, version 4.3.1). The matrix generated for each T1 model was applied to each corresponding registered T2 surface model, obtaining a common head orientation. The 3D differences between the T1 and registered T2 models, and the amounts of directional change in each plane of the 3D space, were quantified for before and after head orientation. Two assessments were performed: (1) at 1 time point (mandibular width and length), and (2) for longitudinal changes (maxillary and mandibular differences). The differences between measurements before and after head orientation were quantified. Statistical analysis was performed by evaluating the means and standard deviations with paired t tests (mandibular width and length) and Wilcoxon tests (longitudinal changes). For 16 subjects, 2 observers working independently performed the head orientations twice with a 1-week interval between them. Intraclass correlation coefficients and the Bland-Altman method tested intraobserver and interobserver agreements of the x, y, and z coordinates for 7 landmarks. Results: The 3D differences were not affected by the head orientation. The amounts of directional change in each plane of 3D space at 1 time point were strongly influenced by head orientation. The longitudinal changes in each plane of 3D space showed differences smaller than 0.5 mm. Excellent intraobserver and interobserver repeatability and reproducibility (>99%) were observed. Conclusions: The amount of directional change in each plane of 3D space is strongly influenced by head orientation. The proposed method of head orientation to obtain a common 3D coordinate system is reproducible. |
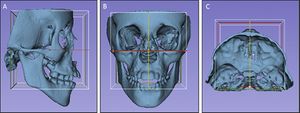 Figures illustrating the head orientation procedure: A, lateral view; B, frontal view; and C, superior view. The midsagittal plane of the 3D model was oriented vertically and coincident with the yellow (sagittal) plane, the Frankfort horizontal plane was oriented horizontally to coincide with the red (axial) plane, and the transporionic line was oriented to match with the intersection of the red (axial) and green (coronal) planes. The white box corresponds to the limits of the 3 cited planes, and it was not used as a reference for orientation. |
Cranial Morphology of the Late Oligocene Patagonian Notohippid Rhynchippus equinus Ameghino, 1897 (Mammalia, Notoungulata) with Emphases in Basicranial and Auditory Region
|
Publication: PLoS One. 2016 May 27;11(5):e0156558. PMID: 27232883 | PDF Authors: Martínez G, Dozo MT, Gelfo JN, Marani H. Institution: Patagonic Institute of Geology and Paleontology, National Patagonian Center, CONICET, Puerto Madryn, Chubut, Argentina. Background/Purpose: "Notohippidae" is a probably paraphyletic family of medium sized notoungulates with complete dentition and early tendency to hypsodonty. They have been recorded from early Eocene to early Miocene, being particularly diverse by the late Oligocene. Although Rhynchippus equinus Ameghino is one of the most frequent notohippids in the fossil record, there are scarce data about cranial osteology other than the classical descriptions which date back to the early last century. In this context, we describe the exceptionally preserved specimen MPEF PV 695 (based on CT scanning technique and 3D reconstruction) with the aim of improving our knowledge of the species, especially regarding auditory region (petrosal, tympanic and surrounding elements), sphenoidal and occipital complexes. Besides a modular description of the whole skull, osteological correlates identified on the basicranium are used to infer some soft-tissue elements, especially those associated with vessels that supply the head, mainly intracranially. One of the most informative elements was the petrosal bone, whose general morphology matches that expected for a toxodont. The endocranial surface, together with the surrounding parietal, basisphenoid, occipital, and squamosal, enabled us to propose the location and communication of main venous sinuses of the lateral head wall (temporal, inferior and sigmoid sinuses), whereas the tympanic aspect and the identification of a posterior carotid artery canal provided strong evidence in support of an intratympanic course of the internal carotid artery, a controversial issue among notoungulates. Regarding the arrangement of tympanic and paratympanic spaces, the preservation of the specimen allowed us to appreciate the three connected spaces that constitute a heavily pneumatized middle ear; the epitympanic sinus, the tympanic cavity itself, and the ventral expansion of the tympanic cavity through the notably inflated bullae. We hope this study stimulates further inquires and provides potentially informative data for future research involving other representatives of the order. |
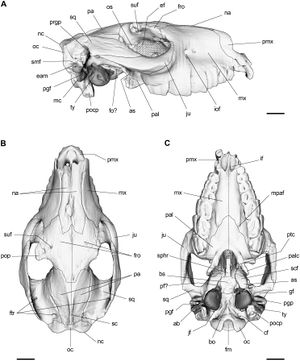 3D reconstruction of the skull of R. equinus (MPEF-PV 695). (A) Lateral view. (B) Dorsal view. (C) Ventral view. Anatomical abbreviations: ab, auditory bulla; as, alisphenoid; bo, basioccipital; bs, basisphenoid; cf, condylar foramen; eam, external auditory meatus; ef, ethmoidal foramen; fm, foramen magnum; fo, foramen ovale; fro, frontal; ftr, foramina of temporal region; gf, glenoid fossa; if, incisive foramen; iof, infraorbital foramen; jf, jugular foramen; ju, jugal; mc, meatal crest; mpaf, major palatine foramen; mx, maxilla; na, nasal; nc, nuchal crest; oc, occipital; occ, occipital condyle; os, orbitosphenoid; pa, parietal; pal, palatine; palc, palatine crest; pf, piriform fenestra; pgf, postglenoid foramen; pgp, postglenoid process; pmx, premaxilla; pocp, paraoccipital process; pop, postorbital process; prgp, preglenoid process; ptc, pterygoid crest; sc, sagittal crest; scf, scaphoid fossa; smf, suprameatal foramen; sphr, sphenoidal rostrum; sq, squamosal; styf, stylomastoid foramen; suf, supraorbital foramen; ty, tympanic. Scale bar equals 2 cm.] Re-slicing of the data along the other two axes, visualization, digital segmentation and 3D reconstructions were performed using 3D Slicer v3.6.3 and 4.0.1. |
3D Printing and 3D Slicer - Powerful Tools in Understanding and Treating Structural Lung Disease
|
Publication: Chest. 2016 May;149(5):1136-42. PMID: 26976347 | PDF Authors: Cheng GZ, Jose Estepar RS, Folch E, Onieva JO, Gangadharan S, Majid A Institution: Division of Thoracic Surgery and Interventional Pulmonology, Beth Israel Deaconess Medical Center, Harvard Medical School, Boston, MA, USA. Background/Purpose: Recent advances in 3D printing industry has enabled clinicians to explore the use of 3D printing in pre-procedural planning, biomedical tissue modeling, and direct implantable device manufacturing. Despite the increase adoption of rapid prototyping and additive manufacturing techniques in the healthcare field, many physicians lack the technical skillset to utilize this exciting and useful technology. Additionally, the growth in the 3D printing sector brings an ever-increasing number of 3D printers and printable materials. Therefore, it is important for clinicians to keep abreast with this rapidly developing field in order to stand to benefit. In this Ahead of the Curve, we review the history of 3D printing from its inception to most recent biomedical applications. Additionally, we will address some of the major barriers to wider adoption of the technology in medical field. Finally, we will provide an initial guide on 3D modeling and printing by demonstrating how to design personalized airway prosthesis via 3D Slicer. We hope this will reduce the barrier to utilization and increase clinician participation in the 3D printing healthcare sector. |
STN-DBS Reduces Saccadic Hypometria but Not Visuospatial Bias in Parkinson's Disease Patients
|
Publication: Front Behav Neurosci. 2016 May 3;10:85. PMID: 27199693. | PDF Authors: Fischer P, Ossandón JP, Keyser J, Gulberti A, Wilming N, Hamel W, Köppen J, Buhmann C, Westphal M, Gerloff C, Moll CK, Engel AK, König P. Institution: Institute of Cognitive Science, University of Osnabrück, Germany. Background/Purpose: In contrast to its well-established role in alleviating skeleto-motor symptoms in Parkinson's disease, little is known about the impact of deep brain stimulation (DBS) of the subthalamic nucleus (STN) on oculomotor control and attention. Eye-tracking data of 17 patients with left-hemibody symptom onset was compared with 17 age-matched control subjects. Free-viewing of natural images was assessed without stimulation as baseline and during bilateral DBS. To examine the involvement of ventral STN territories in oculomotion and spatial attention, we employed unilateral stimulation via the left and right ventralmost contacts respectively. When DBS was off, patients showed shorter saccades and a rightward viewing bias compared with controls. Bilateral stimulation in therapeutic settings improved saccadic hypometria but not the visuospatial bias. At a group level, unilateral ventral stimulation yielded no consistent effects. However, the evaluation of electrode position within normalized MNI coordinate space revealed that the extent of early exploration bias correlated with the precise stimulation site within the left subthalamic area. These results suggest that oculomotor impairments "but not higher-level exploration patterns" are effectively ameliorable by DBS in therapeutic settings. Our findings highlight the relevance of the STN topography in selecting contacts for chronic stimulation especially upon appearance of visuospatial attention deficits. |
Study Of Bppv Precise Manipulation Treatment
|
Publication: Lin Chung Er Bi Yan Hou Tou Jing Wai Ke Za Zhi. 2016 Apr 20;30(8):623-6. PMID: 29871092 Authors: Yang XK, Zheng YY, Wu SX. Institution: Department of Neurology, Wenzhou People's Hospital, Wenzhou, China. Abstract: Objective: To explore the effect of the BPPV precision manipulation treatment. Method: With 3D Slicer software we segment structure such as semicircular canal, eye ball, orbital and ear rod from MRI or CT volume data of patients which underwent MRI or CT scaning of inner ear, for measuring the spatial direction of semicircular canals and building semicircular canal modules with standard space coordinate system and embedding into 3D PDF files. Result:With the slice that divide the semicircular canal equally as the semicircular canal plane and the eyeball as reference object to determine whether it is symmetric, it is not only intuitive but also reliable for measuring the angle between the posterior semicircular canal. 3D PDF is intuitive, rotation angle can be adjusted according to the individual differences in the process of manipulation treatment, to observe and demonstrate the theoretical reduction effect before the actual operation. Conclusion:By reconstruction the three-dimensional semicircular canal structure from the inner ear image data of patients and measurement of the semicircular canal space direction, it is of a certain significance for BPPV precision manipulation treatment. |
Single-Breath Clinical Imaging of Hyperpolarized (129)Xe in the Airspaces, Barrier, and Red Blood Cells using an Interleaved 3D Radial 1-Point Dixon Acquisition
|
Publication: Magn Reson Med. 2016 Apr;75(4):1434-43 PMID: 25980630 | PDF Authors: Kaushik SS, Robertson SH, Freeman MS, He M, Kelly KT, Roos JE, Rackley CR, Foster WM, McAdams HP, Driehuys B. Institution: Center for In Vivo Microscopy, Duke University, Durham, NC, USA. Abstract: PURPOSE: We sought to develop and test a clinically feasible 1-point Dixon, three-dimensional (3D) radial acquisition strategy to create isotropic 3D MR images of (129)Xe in the airspaces, barrier, and red blood cells (RBCs) in a single breath. The approach was evaluated in healthy volunteers and subjects with idiopathic pulmonary fibrosis (IPF). METHODS: A calibration scan determined the echo time at which (129)Xe in RBCs and barrier were 90° out of phase. At this TE, interleaved dissolved and gas-phase images were acquired using a 3D radial acquisition and were reconstructed separately using the NUFFT algorithm. The dissolved-phase image was phase-shifted to cast RBC and barrier signal into the real and imaginary channels such that the image-derived RBC:barrier ratio matched that from spectroscopy. The RBC and barrier images were further corrected for regional field inhomogeneity using a phase map created from the gas-phase (129)Xe image. RESULTS: Healthy volunteers exhibited largely uniform (129)Xe-barrier and (129)Xe-RBC images. By contrast, (129)Xe-RBC images in IPF subjects exhibited significant signal voids. These voids correlated qualitatively with regions of fibrosis visible on CT. CONCLUSIONS: This study illustrates the feasibility of acquiring single-breath, 3D isotropic images of (129)Xe in the airspaces, barrier, and RBCs using a 1-point Dixon 3D radial acquisition. Funding:
|
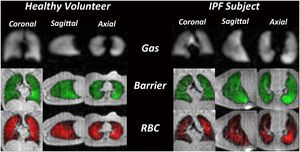 Representative single breath images of 129Xe in the gas-phase (grayscale), barrier tissues (green), and RBCs (red). In the healthy volunteer distribution of 129Xe in all three resonances was largely homogeneous. In the IPF subject gas-phase and barrier images exhibit largely homogeneous intensity, but the RBC image contains widespread gas-transfer defects. "The registered 1H images were segmented using seed-based region growing implemented in 3D Slicer to generate the thoracic cavity mask." |
Low-cost Interactive Image-based Virtual Endoscopy for the Diagnosis and Surgical Planning of Suprasellar Arachnoid Cysts
|
Publication: World Neurosurg. 2016 Apr;88:76-82. PMID: 26732948 Authors: Li Y, Zhao Y, Zhang J, Zhang Z, Dong G, Wang Q, Liu L, Yu X, Xu B, Chen X. Institution: Department of Neurosurgery, People's Liberation Army General Hospital, Beijing, China. Background/Purpose: OBJECTIVE: To investigate the feasibility and reliability of virtual endoscopy (VE) as a rapid, low-cost and interactive tool for suprasellar arachnoid cysts (SACs) diagnosis and surgical planning. Methods: 18 SACs patients treated with endoscopic ventriculocystostomy were recruited, and same number of endoscopic third ventriculostomy treated patients was randomly selected as VE reconstruction control group. After loading their DICOM data into free software 3D Slicer, VE reconstruction was independently performed by 3 blinded clinicians and the time required for each reconstruction was recorded. Other 3 blinded senior neurosurgeons interactively graded the visibility of VE by watching video recordings of endoscopic procedures. Based on the visibility scores, Receiver Operating Characteristic (ROC) curve analysis was used to investigate the reliability of VE to diagnose SACs, and the Bland-Altman plot was employed to assess the VE's reliability for surgical planning. In addition, intra-class correlation coefficient (ICC) was calculated to estimate the consistency among the results of 3 reconstructing performers. Results: All 3 independent reconstructing performers successfully completed VE simulation for all cases, and the average reconstructing time was 10.2±9.7 minutes. The area under ROC curve of cyst's visibility score was 0.96, implying its diagnostic value of SACs. Bland-Altman plot indicated good agreement between VE and intraoperative viewings, suggesting the VE's anatomical accuracy for surgical planning. In addition, ICC was 0.81, which revealed excellent inter-performer consistency of our simulation method. Conclusion: This study substantiated the feasibility and reliability of VE as a rapid, low-cost and interactive modality for SACs diagnosis and surgical planning. |
|
Publication: Int J Comput Assist Radiol Surg. 2016 Mar;11(3):473-81. PMID: 26183148 Authors: De Momi E, Ferrigno G, Bosoni G, Bassanini P, Blasi P, Casaceli G, Fuschillo D, Castana L, Cossu M, Lo Russo G, Cardinale F. Institution: Department of Electronics, Information and Bioengineering (DEIB), Politecnico di Milano, Milan, Italy. Background/Purpose: Image guidance is widely used in neurosurgery. Tracking systems (neuronavigators) allow registering the preoperative image space to the surgical space. The localization accuracy is influenced by technical and clinical factors, such as brain shift. This paper aims at providing quantitative measure of the time-varying brain shift during open epilepsy surgery, and at measuring the pattern of brain deformation with respect to three potentially meaningful parameters: craniotomy area, craniotomy orientation and gravity vector direction in the images reference frame. Methods: We integrated an image-guided surgery system with 3D Slicer, an open-source package freely available in the Internet. We identified the preoperative position of several cortical features in the image space of 12 patients, inspecting both the multiplanar and the 3D reconstructions. We subsequently repeatedly tracked their position in the surgical space. Therefore, we measured the cortical shift, following its time-related changes and estimating its correlation with gravity and craniotomy normal directions. Results: The mean of the median brain shift amount is 9.64 mm ([Formula: see text] mm). The brain shift amount resulted not correlated with respect to the gravity direction, the craniotomy normal, the angle between the gravity and the craniotomy normal and the craniotomy area. Conclusions:Our method, which relies on cortex surface 3D measurements, gave results, which are consistent with literature. Our measurements are useful for the neurosurgeon, since they provide a continuous monitoring of the intra-operative sinking or bulking of the brain, giving an estimate of the preoperative images validity versus time. |
Deformable Image Registration with a Featurelet Algorithm: Implementation as a 3D Slicer Extension and Validation
|
Publication: Proc. SPIE 9784, Medical Imaging 2016 Mar; Image Processing, 97844B. Authors: Renner A, Furtado H, Seppenwoolde Y, Birkfellner W, Georg D. Institution: Medical University, Vienna, Austria. Background/Purpose: A radiotherapy (RT) treatment can last for several weeks. In that time organ motion and shape changes introduce uncertainty in dose application. Monitoring and quantifying the change can yield a more precise irradiation margin definition and thereby reduce dose delivery to healthy tissue and adjust tumor targeting. Deformable image registration (DIR) has the potential to fulfill this task by calculating a deformation field (DF) between a planning CT and a repeated CT of the altered anatomy. Application of the DF on the original contours yields new contours that can be used for an adapted treatment plan. DIR is a challenging method and therefore needs careful user interaction. Without a proper graphical user interface (GUI) a misregistration cannot be easily detected by visual inspection and the results cannot be fine-tuned by changing registration parameters. To provide a DIR algorithm with such a GUI available for everyone, we created the extension Featurelet-Registration for the open source software platform 3D Slicer. The registration logic is an upgrade of an in-house-developed DIR method, which is a featurelet-based piecewise rigid registration. The so called "featurelets" are equally sized rectangular subvolumes of the moving image which are rigidly registered to rectangular search regions on the fixed image. The output is a deformed image and a deformation field. Both can be visualized directly in 3D Slicer facilitating the interpretation and quantification of the results. For validation of the registration accuracy two deformable phantoms were used. The performance was benchmarked against a demons algorithm with comparable results. |
|
Publication: Proc. SPIE 9786, Medical Imaging 2016 Mar; Image-Guided Procedures, Robotic Interventions, and Modeling, 97860Y Authors: Heffernan E, Ungi T, Vaughan T, Pezeshki P, Lasso A, Gauvin G, Rudan J, Engel CJ, Morin E, Fichtinger G. Institution: Laboratory for Percutaneous Surgery, Queen's University, Kingston, Canada. Background/Purpose: An electromagnetic navigation system for tumor excision in breast conserving surgery has recently been developed. Preoperatively, a hooked needle is positioned in the tumor and the tumor boundaries are defined in the needle coordinate system. The needle is tracked electromagnetically throughout the procedure to localize the tumor. However, the needle may move and the tissue may deform, leading to errors in maintaining a correct excision boundary. It is imperative to quantify these errors so the surgeon can choose an appropriate resection margin. Methods: A commercial breast biopsy phantom with several inclusions was used. Location and shape of a lesion before and after mechanical deformation were determined using 3D ultrasound volumes. Tumor location and shape were estimated from initial contours and tracking data. The difference in estimated and actual location and shape of the lesion after deformation was quantified using the Hausdorff distance. Data collection and analysis were done using our 3D Slicer software application and PLUS toolkit. Results: The deformation of the breast resulted in 3.72 mm (STD 0.67 mm) average boundary displacement for an isoelastic lesion and 3.88 mm (STD 0.43 mm) for a hyperelastic lesion. The difference between the actual and estimated tracked tumor boundary was 0.88 mm (STD 0.20 mm) for the isoelastic and 1.78 mm (STD 0.18 mm) for the hyperelastic lesion. Conclusion: The average lesion boundary tracking error was below 2mm, which is clinically acceptable. We suspect that stiffness of the phantom tissue affected the error measurements. Results will be validated in patient studies. © (2016) COPYRIGHT Society of Photo-Optical Instrumentation Engineers (SPIE). Downloading of the abstract is permitted for personal use only. |
Effects of Voxelization on Dose Volume Histogram Accuracy
|
Publication: Proc. SPIE 9786, Medical Imaging 2016 Mar; Image-Guided Procedures, Robotic Interventions, and Modeling, 97862O. Authors: Sunderland K, Pinter C, Lasso A, Fichtinger G. Institution: Laboratory for Percutaneous Surgery, Queen's University, Kingston, Canada. Background/Purpose: In radiotherapy treatment planning systems, structures of interest such as targets and organs at risk are stored as 2D contours on evenly spaced planes. In order to be used in various algorithms, contours must be converted into binary label map volumes using voxelization. The voxelization process results in lost information, which has little effect on the volume of large structures, but has significant impact on small structures, which contain few voxels. Volume differences for segmented structures affects metrics such as dose volume histograms (DVH), which are used for treatment planning. Our goal is to evaluate the impact of voxelization on segmented structures, as well as how factors like voxel size affects metrics, such as DVH. Methods: We create a series of implicit functions, which represent simulated structures. These structures are sampled at varying resolutions, and compared to label maps with high sub-millimeter resolutions. We generate DVH and evaluate voxelization error for the same structures at different resolutions by calculating the agreement acceptance percentage between the DVH. Results: We implemented tools for analysis as modules in the SlicerRT toolkit based on the 3D Slicer platform. We found that there were large DVH variation from the baseline for small structures or for structures located in regions with a high dose gradient, potentially leading to the creation of suboptimal treatment plans. Conclusion: This work demonstrates that label map and dose volume voxel size is an important factor in DVH accuracy, which must be accounted for in order to ensure the development of accurate treatment plans. |
Real-time Self-calibration of a Tracked Augmented Reality Display
|
Publication: Proc. SPIE 9786, Medical Imaging 2016 Mar; Image-Guided Procedures, Robotic Interventions, and Modeling, 97860F. Authors: Baum Z, Lasso A, Ungi T, Fichtinger G. Institution: Laboratory for Percutaneous Surgery, Queen's University, Kingston, Canada. Background/Purpose: Augmented reality systems have been proposed for image-guided needle interventions but they have not become widely used in clinical practice due to restrictions such as limited portability, low display refresh rates, and tedious calibration procedures. We propose a handheld tablet-based self-calibrating image overlay system. Methods: A modular handheld augmented reality view box was constructed from a tablet computer and a semi-transparent mirror. A consistent and precise self-calibration method, without the use of any temporary markers, was designed to achieve an accurate calibration of the system. Markers attached to the view box and patient are simultaneously tracked using an optical pose tracker to report the position of the patient with respect to a displayed image plane that is visualized in real-time. The software was built using the open-source 3D Slicer application platform's SlicerIGT extension and the PLUS toolkit. Results: The accuracy of the image overlay with image-guided needle interventions yielded a mean absolute position error of 0.99 mm (95th percentile 1.93 mm) in-plane of the overlay and a mean absolute position error of 0.61 mm (95th percentile 1.19 mm) out-of-plane. This accuracy is clinically acceptable for tool guidance during various procedures, such as musculoskeletal injections. Conclusion: A self-calibration method was developed and evaluated for a tracked augmented reality display. The results show potential for the use of handheld image overlays in clinical studies with image-guided needle interventions. |
Accuracy of Open-Source Software Segmentation and Paper-based Printed Three-Dimensional Models
|
Publication: J Craniomaxillofac Surg. 2016 Feb;44(2):202-9. PMID: 26748414 Authors: Szymor P, Kozakiewicz M, Olszewski R. Institution: Department of Maxillofacial Surgery, Medical University of Lodz, Lodz, Poland. Background/Purpose: In this study, we aimed to verify the accuracy of models created with the help of open-source 3D Slicer 3.6.3 software (Surgical Planning Lab, Harvard Medical School, Harvard University, Boston, MA, USA) and the Mcor Matrix 300 paper-based 3D printer. Our study focused on the accuracy of recreating the walls of the right orbit of a cadaveric skull. Cone beam computed tomography (CBCT) of the skull was performed (0.25-mm pixel size, 0.5-mm slice thickness). Acquired DICOM data were imported into 3D Slicer 3.6.3 software, where segmentation was performed. A virtual model was created and saved as an .STL file and imported into Netfabb Studio professional 4.9.5 software. Three different virtual models were created by cutting the original file along three different planes (coronal, sagittal, and axial). All models were printed with a Selective Deposition Lamination Technology Matrix 300 3D printer using 80 gsm A4 paper. The models were printed so that their cutting plane was parallel to the paper sheets creating the model. Each model (coronal, sagittal, and axial) consisted of three separate parts (∼200 sheets of paper each) that were glued together to form a final model. The skull and created models were scanned with a three-dimensional (3D) optical scanner (Breuckmann smart SCAN) and were saved as .STL files. Comparisons of the orbital walls of the skull, the virtual model, and each of the three paper models were carried out with GOM Inspect 7.5SR1 software. Deviations measured between the models analyzed were presented in the form of a color-labelled map and covered with an evenly distributed network of points automatically generated by the software. An average of 804.43 ± 19.39 points for each measurement was created. Differences measured in each point were exported as a .csv file. The results were statistically analyzed using Statistica 10, with statistical significance set at p < 0.05. The average number of points created on models for each measurement was 804.43 ± 19.39; however, deviation in some of the generated points could not be calculated, and those points were excluded from further calculations. From 94% to 99% of the measured absolute deviations were <1 mm. The mean absolute deviation between the skull and virtual model was 0.15 ± 0.11 mm, between the virtual and printed models was 0.15 ± 0.12 mm, and between the skull and printed models was 0.24 ± 0.21 mm. Using the optical scanner and specialized inspection software for measurements of accuracy of the created parts is recommended, as it allows one not only to measure 2-dimensional distances between anatomical points but also to perform more clinically suitable comparisons of whole surfaces. However, it requires specialized software and a very accurate scanner in order to be useful. Threshold-based, manually corrected segmentation of orbital walls performed with 3D Slicer software is accurate enough to be used for creating a virtual model of the orbit. The accuracy of the paper-based Mcor Matrix 300 3D printer is comparable to those of other commonly used 3-dimensional printers and allows one to create precise anatomical models for clinical use. The method of dividing the model into smaller parts and sticking them together seems to be quite accurate, although we recommend it only for creating small, solid models with as few parts as possible to minimize shift associated with gluing. |
Validation of a Novel Geometric Coordination Registration using Manual and Semi-automatic Registration in Cone-beam Computed Tomogram
|
Publication: Electronic Imaging, Image Processing: Machine Vision Applications IX, 2016 Feb; pp. 1-6(6). | PDF Authors: Lam W, Luk H, Ngan H, Hsung R, Goto T, Pow E. Institution: Faculty of Dentistry, The University of Hong Kong, Hong Kong, China. Background/Purpose: Cartesian coordinates define on a physical cubic corner (CC) with the corner tip as the origin and three corresponding line angles as (x, y, z)-axes. In its image (virtual) domains such as these obtained by cone-beam computed tomography (CBCT) and optical surface scanning, a single coordinate can then be registered based on the CC. The advantage of using a CC in registration is simple and accurate physical coordinate measurement. The accuracy of image-to-physical (IP) and image-to-image (II) transformations, measured by target registration error (TRE), can then be validated by comparing coordinates of target points in the virtual domains to that of the physical control. For the CBCT, the registration may be performed manually using a surgical planning software SimPlant Pro (manual registration (MR)) or semi-automatically using MeshLab and 3D Slicer (semiautomatic registration (SR)) matching the virtual display axes to the corresponding (x-y-z)-axes. This study aims to validate the use of CC as a surgical stereotactic marker by measuring TRE in MR and SR respectively. Mean TRE is 0.56 ± 0.24 mm for MR and 0.39 ± 0.21 mm for SR. The SR results in a more accurate registration than the MR and point-based registration with 20 fiducial points. TRE of the MR is less than 1.0 mm and still acceptable clinically. |
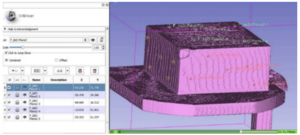 Coordinate measurement in 3D Slicer (tangential linear distances to axes). |
Effect of Decompressive Craniectomy on Perihematomal Edema in Patients with Intracerebral Hemorrhage
|
Publication: PLoS One. 2016 Feb 12;11(2):e0149169. PMID: 26872068 | PDF Authors: Fung C, Murek M, Klinger-Gratz PP, Fiechter M, Z'Graggen WJ, Gautschi OP, El-Koussy M, Gralla J, Schaller K, Zbinden M, Arnold M, Fischer U, Mattle HP, Raabe A, Beck J. Institution: Department of Neurosurgery, University Hospital Bern, Bern, Switzerland. Background/Purpose: Perihematomal edema contributes to secondary brain injury in the course of intracerebral hemorrhage. The effect of decompressive surgery on perihematomal edema after intracerebral hemorrhage is unknown. This study analyzed the course of PHE in patients who were or were not treated with decompressive craniectomy. METHODS: More than 100 computed tomography images from our published cohort of 25 patients were evaluated retrospectively at two university hospitals in Switzerland. Computed tomography scans covered the time from admission until day 100. Eleven patients were treated by decompressive craniectomy and 14 were treated conservatively. Absolute edema and hematoma volumes were assessed using 3-dimensional volumetric measurements. Relative edema volumes were calculated based on maximal hematoma volume. RESULTS: Absolute perihematomal edema increased from 42.9 ml to 125.6 ml (192.8%) after 21 days in the decompressive craniectomy group, versus 50.4 ml to 67.2 ml (33.3%) in the control group (Δ at day 21 = 58.4 ml, p = 0.031). Peak edema developed on days 25 and 35 in patients with decompressive craniectomy and controls respectively, and it took about 60 days for the edema to decline to baseline in both groups. Eight patients (73%) in the decompressive craniectomy group and 6 patients (43%) in the control group had a good outcome (modified Rankin Scale score 0 to 4) at 6 months (P = 0.23). CONCLUSIONS: Decompressive craniectomy is associated with a significant increase in perihematomal edema compared to patients who have been treated conservatively. Perihematomal edema itself lasts about 60 days if it is not treated, but decompressive craniectomy ameliorates the mass effect exerted by the intracerebral hemorrhage plus the perihematomal edema, as reflected by the reduced midline shift. |
Multi Texture Analysis of Colorectal Cancer Continuum using Multispectral Imagery
|
Publication: PLoS One. 2016 Feb 22;11(2):e0149893. PMID: 26901134 | PDF Authors: Chaddad A, Desrosiers C, Bouridane A, Toews M, Hassan L, Tanougast C. Institution: Laboratory for Imagery, Vision and Artificial Intelligence, Ecole de Technologie Superieure, Montreal, Quebec, Canada. Background/Purpose: This paper proposes to characterize the continuum of colorectal cancer (CRC) using multiple texture features extracted from multispectral optical microscopy images. Three types of pathological tissues (PT) are considered: benign hyperplasia, intraepithelial neoplasia and carcinoma. MATERIALS AND Methods: In the proposed approach, the region of interest containing PT is first extracted from multispectral images using active contour segmentation. This region is then encoded using texture features based on the Laplacian-of-Gaussian (LoG) filter, discrete wavelets (DW) and gray level co-occurrence matrices (GLCM). To assess the significance of textural differences between PT types, a statistical analysis based on the Kruskal-Wallis test is performed. The usefulness of texture features is then evaluated quantitatively in terms of their ability to predict PT types using various classifier models. Results: Preliminary results show significant texture differences between PT types, for all texture features (p-value < 0.01). Individually, GLCM texture features outperform LoG and DW features in terms of PT type prediction. However, a higher performance can be achieved by combining all texture features, resulting in a mean classification accuracy of 98.92%, sensitivity of 98.12%, and specificity of 99.67%. Conclusions: These results demonstrate the efficiency and effectiveness of combining multiple texture features for characterizing the continuum of CRC and discriminating between pathological tissues in multispectral images. |
 Examples of ground truth segmentation. (a) Original image. (b) Segmented image. (c) Labeled image. Labeled area in (c) corresponds to the ROI used for texture feature extraction.Ground truth segmentations, one segmentation per sample, were obtained manually using 3D Slicer. |
Cranial Anatomy and Palaeoneurology of the Archosaur Riojasuchus tenuisceps from the Los Colorados Formation, La Rioja, Argentina
|
Publication: PLoS One. 2016 Feb 5;11(2):e0148575. PMID: 26849433 | PDF Authors: von Baczko MB, Desojo JB. Institution: National Council of Scientific and Technical Research (CONICET), Autonomous City of Buenos Aires, Buenos Aires, Argentina. Background/Purpose: Riojasuchus tenuisceps Bonaparte 1967 is currently known from four specimens, including two complete skulls, collected in the late 1960s from the upper levels of the Los Colorados Formation (Late Triassic), La Rioja, Argentina. Computed tomography (CT) scans of the skulls of the holotype and a referred specimen of Riojasuchus tenuisceps and the repreparation of the latter allows recognition of new features for a detailed analysis of its cranial anatomy and its comparison with a wide variety of other archosauriform taxa. The diagnosis of Riojasuchus tenuisceps is emended and two autapomorphies are identified on the skull: (1) a deep antorbital fossa with its anterior and ventral edges almost coinciding with the same edges of the maxilla itself and (2) a suborbital fenestra equal in size to the palatine-pterygoid fenestra. Also, the first digital 3D reconstruction of the encephalon of Riojasuchus tenuisceps was carried out to study its neuroanatomy, showing a shape and cranial nerve disposition consistent to that of other pseudosuchians. |
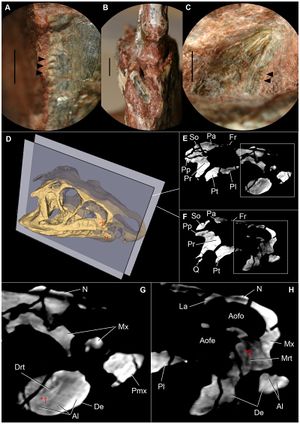 Details of dentition of Riojasuchus tenuisceps. (A) lateral detail of denticles on distal margin of maxillary tooth (PVL 3828); (B) anterior view of first dentary tooth (PVL 3827) broken at its base; (C) medial view of posterior dentary tooth (PVL 3828) with denticles on distal margin; (D) 3D reconstruction of the skull of PVL 3827 indicating selected slices; (E-F) selected slices of PVL 3827; (G) detail of slide E indicating a maxillary replacement tooth (Mrt) erupting; (H) detail of slide F pointing out a dentary replancement tooth (Drt); *1 and *2 indicate the position of each replacement tooth on the skull. Arrowheads point at denticles. Abbreviations: Al, alveoli; Aofe, antorbital fenestra; Aofo, antorbital fossa; De, dentary, Drt, dentary replacement tooth; Fr, frontal; N, nasal; Mrt, maxillary replacement tooth; Mx, maxilla; Pa, parietal; Pl, palatine; Pmx, premaxilla; Pp, paroccipital process; Pr, prootic; Pt, pterygoid; Q, quadrate; So, supraoccipital. Scale bar: 2mm. For the analysis of the CT images and 3D reconstruction, we used the open source software 3D Slicer v4.1.1. |
Diffusion Tensor Imaging Assessment of Microstructural Brainstem Integrity in Chiari Malformation Type I
|
Publication: J Neurosurg. 2016 Feb 5:1-8. PMID: 26848913 | PDF Authors: Krishna V, Sammartino F, Yee P, Mikulis D, Walker M, Elias G, Hodaie M. Institution: Department of Neurosurgery, Ohio State University, Columbus, OH, USA. Background/Purpose: OBJECTIVE The diagnosis of Chiari malformation Type I (CM-I) is primarily based on the degree of cerebellar tonsillar herniation even though it does not always correlate with symptoms. Neurological dysfunction in CM-I presumably results from brainstem compression. With the premise that conventional MRI does not reveal brain microstructural changes, this study examined both structural and microstructural neuroimaging metrics to distinguish patients with CM-I from age- and sex-matched healthy control subjects. METHODS Eight patients with CM-I and 16 controls were analyzed. Image postprocessing involved coregistration of anatomical T1-weighted with diffusion tensor images using 3D Slicer software. The structural parameters included volumes of the posterior fossa, fourth ventricle, and tentorial angle. Fractional anisotropy (FA) was calculated separately in the anterior and posterior compartments of the lower brainstem. RESULTS The mean age of patients in the CM-I cohort was 42.6 ± 10.4 years with mean tonsillar herniation of 12 mm (SD 0.7 mm). There were no significant differences in the posterior fossa volume (p = 0.06) or fourth ventricular volume between the 2 groups (p = 0.11). However, the FA in the anterior brainstem compartment was significantly higher in patients with CM-I preoperatively (p = 0.001). The FA values normalized after Chiari decompression except for persistently elevated FA in the posterior brainstem compartment in patients with CM-I and syrinx. CONCLUSIONS In this case-control study, microstructural alterations appear to be reliably associated with the diagnosis of CM-I, with a significantly elevated FA in the lower brainstem in patients with CM-I compared with controls. More importantly, the FA values normalized after decompressive surgery. These findings should be validated in future studies to determine the significance of diffusion tensor imaging-based assessment of brainstem microstructural integrity as an adjunct to the clinical assessment in patients with CM-I. |
Large Area 3-D Optical Coherence Tomography Imaging of Lumpectomy Specimens for Radiation Treatment Planning
|
Publication: Proc. SPIE 9689 2016 Feb; Photonic Therapeutics and Diagnostics XII, 968946. Authors: Wang C, Kim L, Barnard N, Khan A, Pierce MC. Institution: Rutgers, The State University of New Jersey NJ, USA. Background/Purpose: Our long term goal is to develop a high-resolution imaging method for comprehensive assessment of tissue removed during lumpectomy procedures. By identifying regions of high-grade disease within the excised specimen, we aim to develop patient-specific post-operative radiation treatment regimens. We have assembled a bench top spectral-domain optical coherence tomography (SD-OCT) system with 1320 nm center wavelength. Automated beam scanning enables “sub-volumes” spanning 5 mm x 5 mm x 2 mm (500 A-lines x 500 B-scans x 2 mm in depth) to be collected in under 15 seconds. A motorized sample positioning stage enables multiple sub-volumes to be acquired across an entire tissue specimen. Sub-volumes are rendered from individual B-scans in 3D Slicer software and en face (XY) images are extracted at specific depths. These images are then tiled together using MosaicJ software to produce a large area en face view (up to 40 mm x 25 mm). After OCT imaging, specimens were sectioned and stained with HE, allowing comparison between OCT image features and disease markers on histopathology. This manuscript describes the technical aspects of image acquisition and reconstruction, and reports initial qualitative comparison between large area en face OCT images and HE stained tissue sections. Future goals include developing image reconstruction algorithms for mapping an entire sample, and registering OCT image volumes with clinical CT and MRI images for post-operative treatment planning. |
Development and Evaluation of an Open-Source 3D Virtual Simulator with Integrated Motion-Tracking as a Teaching Tool for Pedicle Screw Insertion
|
Publication: Orthopaedic Proceedings 2016 Feb; 98:Supp.5-16. Authors: Mclachlin S, Polley B, Beig M, Larouche J, Whyne C. Institution: Sunnybrook Research Institute (SRI), University of Toronto, Canada. Background/Purpose: Simulation is an effective adjunct to the traditional surgical curriculum, though access to these technologies is often limited and costly. The objectives of this work were to develop a freely accessible virtual pedicle screw simulator and to improve the clinical authenticity of the simulator through integration of low-cost motion tracking. The open-source medical imaging and visualization software, 3D Slicer, was used as the development platform for the virtual simulation. 3D Slicer contains many features for quickly rendering and transforming 3D models of the bony spine anatomy from patient-specific CT scans. A step-wise pedicle screw insertion workflow module was developed which emulated typical pre-operative planning steps. This included taking anatomic measurements, identifying insertion landmarks, and choosing appropriate screw sizes. Monitoring of the surgeon's simulated tool was assessed with a low-cost motion tracking sensor in real-time. This allowed for the surgeon's physical motions to be tracked as they defined the virtual screw's insertion point and trajectory on the rendered anatomy. Screw insertion was evaluated based on bone density contact and cortical breaches. Initial surgeon feedback of the virtual simulator with integrated motion tracking was positive, with no noticeable lag and high accuracy between the real-world and virtual environments. The software yields high fidelity 3D visualization of the complex geometry and the tracking enabled coordination of motion to small changes in both translational and angular positioning. Future work will evaluate the benefit of this simulation platform with use over the course of resident spine rotations to improve planning and surgical competency. |
Current Smoking Status is Associated with Lower Quantitative CT Measures of Emphysema and Gas Trapping
|
Publication: J Thorac Imaging. 2016 Jan;31(1):29-36. PMID: 26429588 | PDF Authors: Zach JA, Williams A, Jou SS, Yagihashi K, Everett D, Hokanson JE, Stinson D, Lynch DA, COPDGene Investigators. Institution: Divisions of Radiology, Biostatistics and Bioinformatics, National Jewish Health, Denver, CO, USA. Background/Purpose: The purposes of this study were to evaluate the effect of smoking status on quantitative computed tomography CT measures of low-attenuation areas (LAAs) on inspiratory and expiratory CT and to provide a method of adjusting for this effect. Materials and Methods: A total of 6762 current and former smokers underwent spirometry and volumetric inspiratory and expiratory CT. Quantitative CT analysis was completed using open-source 3D Slicer software. Funding:
|
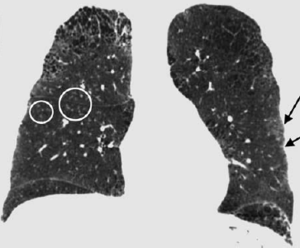 Examples of CN on CT. Coronal CT image of a GOLD 1 subject with moderately extensive visual extent of emphysema. However, the quantitative emphysema score was only 5.1%. The emphysema may have been masked on quantitative assessment by the presence of centrilobular nodules (circled) and patchy ground-glass abnormality (arrows). |
A Proposed Method for Accurate 3D Analysis of Cochlear Implant Migration using Fusion of Cone Beam CT
|
Publication: Front Surg. 2016 Jan 25;3:2. PMID: 26835459 | PDF Authors: Dees G, van Hoof M, Stokroos R. Institution: Department of Otorhinolaryngology and Head and Neck Surgery, Maastricht University Medical Center, Maastricht, The Netherlands. Background/Purpose: The goal of this investigation was to compare fusion of sequential cone beam computerized tomography (CT) volumes to the gold standard (fiducial registration) in order to be able to analyze clinical cochlear implant (CI) migration with high accuracy in three dimensions. MATERIALS AND Methods: Paired cone beam CT volumes were performed on five human cadaver temporal bones and one human subject. These volumes were fused using 3D Slicer 4 and BRAINSFit software. Using a gold standard fiducial technique, the accuracy, robustness, and performance time of the fusion process were assessed. Results: This proposed fusion protocol achieves a subvoxel median Euclidean distance of 0.05 mm in human cadaver temporal bones and 0.16 mm (mean) when applied to the described in vivo human synthetic data set in over 95% of all fusions. Performance times are <2 min. Conclusion: Here, a new and validated method based on existing techniques is described, which could be used to accurately quantify migration of CI electrodes. |
 Human cadaver temporal bone. Axial fused images of a human cadaver temporal bone. (A) No registration. (B) Fiducial registration. (C) BRAINSFit registration. Notice the discernible overlapping borders when no registration is applied. The arrows indicate a fiducial marker. Image analysis, registration, and visualization are performed using the open source 3D Slicer 4 package, including the BRAINS software package. |
Estimates of The Levator Ani Subtended Volume Based on Magnetic Resonance Linear Measurements
|
Publication: Neurourol Urodyn. 2016 Feb;35(2):199-205. PMID: 25400167 Authors: Rodrigues Junior AA, Herrera-Hernadez MC, Bassalydo R, McCullough M, Terwilliger HL, Downes K, Hoyte L. Institution: Department of Obstetrics and Gynecology, Division of Female Pelvic Medicine and Reconstructive Surgery, College of Medicine Tampa, University of South Florida, FL, USA. Abstract: CONDENSATION: A mathematical formula to estimate the levator ani subtended volume parameter based on magnetic resonance imaging linear measurements from one axial and one sagittal view. OBJECTIVE: To estimate the levator ani subtended volume based on MRI linear measurements. METHODS: The 3D Slicer was used to obtain the Levator Ani Subtended Volume (LASV) from 35 women with Pelvic Organ Prolapse (POP), that were assumed as reference values. The linear measurements that best fitted our criteria were chosen. The subjects were divided in two groups, 1 and 2. The coefficients of the mathematical equation were obtained from group 1 through a regression analysis using the 3D rendering volume as a dependent variable. To validate the mathematical equation, two observers, blinded to POP ordinal stages, performed new measurements. The 3D rendering and the estimated volumes were compared and correlated with POP-Q measurements and POP ordinal stages. A residual analysis was performed to validate the mathematical equation. Finally, a reliability analysis was performed. RESULTS: The predictors chosen were M-line, H-line, and width of levator hiatus. An equation to estimate the volume was determined: eLASV = -72.838 + 0.598H-line + 1.217M-line + 1.136WLH1. The estimated values showed similar correlation with POP-Q individual measurements and ordinal stages. The residual analysis showed normal distribution of the estimate values and the errors, from both observers. The intra and interclass evaluation of the estimated values indicated a good reliability of the eLASVs. CONCLUSION: The LASV can be estimated using well known Magnetic Resonance linear measurements, showing good correlation with correspondent 3D rendering volumes. The clinical relevance of this parameter should be proved in further studies. |
Boolean Combinations of Implicit Functions for Model Clipping in Computer-Assisted Surgical Planning
|
Publication: PLoS One. 2016 Jan 11;11(1):e0145987. PMID: 26751685 | PDF Authors: Zhan Q, Chen X. Institution: School of Mechanical Engineering, Shanghai Jiao Tong University, Shanghai, China. Background/Purpose: This paper proposes an interactive method of model clipping for computer-assisted surgical planning. The model is separated by a data filter that is defined by the implicit function of the clipping path. Being interactive to surgeons, the clipping path that is composed of the plane widgets can be manually repositioned along the desirable presurgical path, which means that surgeons can produce any accurate shape of the clipped model. The implicit function is acquired through a recursive algorithm based on the Boolean combinations (including Boolean union and Boolean intersection) of a series of plane widgets' implicit functions. The algorithm is evaluated as highly efficient because the best time performance of the algorithm is linear, which applies to most of the cases in the computer-assisted surgical planning. Based on the above stated algorithm, a user-friendly module named SmartModelClip is developed on the basis of 3D Slicer platform and VTK. A number of arbitrary clipping paths have been tested. Experimental results of presurgical planning for three types of Le Fort fractures and for tumor removal demonstrate the high reliability and efficiency of our recursive algorithm and robustness of the module. Funding:
|
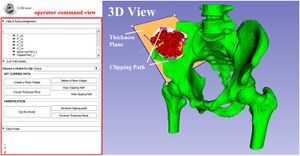 A snapshot of the module SmartModelClip in 3D Slicer. On the left is the operator command view that users can create and manipulate clipping path and thickness plane(i.e., they can create, hide and delete plane widgets). Users can also reverse the directions of the axes of the both clipping path and thickness plane widget. On the right is the scene that users can interact with the clipping path. They can specify the fiducial points that position the clipping path and modify the boundary of the clipping path by dragging the handles to obtain the desirable clipping path. |
Three-Dimensional Visualization of the Distribution of Melanin-Concentrating Hormone Producing Neurons in the Mouse Hypothalamus
|
Publication: J Chem Neuroanat. 2016 Jan;71:20-5. PMID: 26686291 Authors: Reinitz LZ, Szőke B, Várkonyi EÉ, Sótonyi P, Jancsik V. Institution: Faculty of Veterinary Science, Department of Anatomy and Histology, Szent István University, Budapest, Hungary. Background/Purpose: We present here a new procedure to represent the 3D distribution of neuronal cell bodies within the brain, using exclusively softwares free for research purposes. Our technique is based on digitalized photos of brain slices processed by immunohistochemical technique, and the 3D Slicer software. The technique presented enables transposition of immunohistochemical or in situ hybridization data to the stereotaxic mouse brain atlas (e.g. Paxinos, G., Franklin, K.B.J., 2001. The Mouse Brain in Stereotaxic Coordinates. second ed. Academic Press, San Diego). By exporting the finalized models into a popular 3D design software (3DS Max) arbitrary environment and motion simulation can be created to improve the visual understanding of the area studied. Application of this technique provides the possibility to store, analyze and compare data - e.g. on the hypothalamic neuropeptides - across experimental techniques and laboratories. The method is exemplified by visualizing the distribution of immunohistochemically identified melanin-concetrating hormone (MCH) containing perikarya within the mouse hypothalamus. |
Patient-Specific Quantitation of Mitral Valve Strain by Computer Analysis of Three-Dimensional Echocardiography: A Pilot Study
|
Publication: Circ Cardiovasc Imaging. 2016 Jan;9(1). PMID: 26712158 | PDF Authors: Ben Zekry S, Freeman J, Jajoo A, He J, Little SH, Lawrie GM, Azencott R, Zoghbi WA. Institution: EDepartment of Chocardiography, Houston Methodist DeBakey Heart and Vascular Center, Houston, TX. Background/Purpose: BACKGROUND: A paucity of data exists on mitral valve (MV) deformation during the cardiac cycle in man. Real-time 3-dimensional (3D) echocardiography now allows dynamic volumetric imaging of the MV, thus enabling computerized modeling of MV function directly in health and disease. METHODS AND RESULTS: MV imaging using 3D transesophageal echocardiography was performed in 10 normal subjects and 10 patients with moderate-to-severe or severe organic mitral regurgitation. Using proprietary 3D software, patient-specific models of the mitral annulus and leaflets were computed at mid- and end-systole. Strain analysis of leaflet deformation was derived from these models. In normals, mean strain intensity averaged 0.11±0.02 and was higher in the posterior leaflet than in the anterior leaflet (0.13±0.03 versus 0.10±0.02; P<0.05). Mean strain intensity was higher in patients with mitral regurgitation (0.15±0.03) than in normals (0.11±0.02; P=0.05). Higher mean strain intensity was noted for the posterior leaflet in both normal and organic valves. Regional valve analysis revealed that both anterior and posterior leaflets have the highest strain concentration in the commissural zone, and the boundary zone near the annulus and at the coaptation line, with reduced strain concentration in the central leaflet zone. CONCLUSIONS: In normals, MV strain is higher in the posterior leaflet, with the highest strain at the commissures, annulus, and coaptation zones. Patients with organic mitral regurgitation have higher strain than normals. Three-dimensional echocardiography allows noninvasive and patient-specific quantitation of strain intensities because of MV deformations and has the potential to improve noninvasive characterization and follow-up of MV disease.
|
In Vivo Visualization of the Facial Nerve in Patients with Acoustic Neuroma using Diffusion Tensor Imaging-Based Fiber Tracking
|
Publication: J Neurosurg. 2016 Jan 1:1-8. PMID: 26722859 | PDF Authors: Song F, Hou Y, Sun G, Chen X, Xu B, Huang JH, Zhang J. Institution: Department of Neurosurgery, People's Liberation Army General Hospital, Beijing, China. Background/Purpose: OBJECTIVE Preoperative determination of the facial nerve (FN) course is essential to preserving its function. Neither regular preoperative imaging examination nor intraoperative electrophysiological monitoring is able to determine the exact position of the FN. The diffusion tensor imaging-based fiber tracking (DTI-FT) technique has been widely used for the preoperative noninvasive visualization of the neural fasciculus in the white matter of brain. However, further studies are required to establish its role in the preoperative visualization of the FN in acoustic neuroma surgery. The object of this study is to evaluate the feasibility of using DTI-FT to visualize the FN. Methods Data from 15 patients with acoustic neuromas were collected using 3-T MRI. The visualized FN course and its position relative to the tumors were determined using DTI-FT with 3D Slicer software. The preoperative visualization results of FN tracking were verified using microscopic observation and electrophysiological monitoring during microsurgery. Results Preoperative visualization of the FN using DTI-FT was observed in 93.3% of the patients. However, in 92.9% of the patients, the FN visualization results were consistent with the actual surgery. CONCLUSIONS DTI-FT, in combination with intraoperative FN electrophysiological monitoring, demonstrated improved FN preservation in patients with acoustic neuroma. FN visualization mainly included the facial-vestibular nerve complex of the FN and vestibular nerve. |
Head Circumference as a Useful Surrogate for Intracranial Volume in Older Adults
|
Publication: Int Psychogeriatr. 2016 Jan;28(1):157-62. PMID: 26631180 | PDF Authors: Hshieh TT, Fox ML, Kosar CM, Cavallari M, Guttmann CR, Alsop D, Marcantonio ER, Schmitt EM, Jones RN, Inouye SK. Institution: Division of Aging, Brigham and Women's Hospital, Harvard Medical School, Boston, MA, USA. Background/Purpose: BACKGROUND:
Intracranial volume (ICV) has been proposed as a measure of maximum lifetime brain size. Accurate ICV measures require neuroimaging which is not always feasible for epidemiologic investigations. We examined head circumference as a useful surrogate for ICV in older adults.
Funding:
|
A Proposed Method for Accurate 3D Analysis of Cochlear Implant Migration Using Fusion of Cone Beam CT
|
Publication: Front Surg. 2016 Jan 25;3:2. PMID: 26835459 | PDF Authors: Dees G, van Hoof M, Stokroos R. Institution: Department of Otorhinolaryngology and Head and Neck Surgery, Maastricht University Medical Center, Maastricht, The Netherlands. Abstract: INTRODUCTION: The goal of this investigation was to compare fusion of sequential cone beam computerized tomography (CT) volumes to the gold standard (fiducial registration) in order to be able to analyze clinical cochlear implant (CI) migration with high accuracy in three dimensions. MATERIALS AND METHODS: Paired cone beam CT volumes were performed on five human cadaver temporal bones and one human subject. These volumes were fused using 3D Slicer 4 and BRAINSFit software. Using a gold standard fiducial technique, the accuracy, robustness, and performance time of the fusion process were assessed. RESULTS: This proposed fusion protocol achieves a subvoxel median Euclidean distance of 0.05 mm in human cadaver temporal bones and 0.16 mm (mean) when applied to the described in vivo human synthetic data set in over 95% of all fusions. Performance times are <2 min. CONCLUSION: Here, a new and validated method based on existing techniques is described, which could be used to accurately quantify migration of CI electrodes. |
Assessing the Effects of Software Platforms on Volumetric Segmentation of Glioblastoma
|
Publication: J Neuroimaging Psychiatry Neurol. 2016;1(2):64-72. PMID: 29600296 | PDF Authors: Dunn WD Jr, Aerts HJWL, Cooper LA, Holder CA, Hwang SN, Jaffe CC, Brat DJ, Jain R, Flanders AE, Zinn PO, Colen RR, Gutman DA. Institution: Departments of Biomedical Informatics and Neurology, Emory University School of Medicine, Atlanta, GA, USA. Abstract: BACKGROUND: Radiological assessments of biologically relevant regions in glioblastoma have been associated with genotypic characteristics, implying a potential role in personalized medicine. Here, we assess the reproducibility and association with survival of two volumetric segmentation platforms and explore how methodology could impact subsequent interpretation and analysis. METHODS: Post-contrast T1- and T2-weighted FLAIR MR images of 67 TCGA patients were segmented into five distinct compartments (necrosis, contrast-enhancement, FLAIR, post contrast abnormal, and total abnormal tumor volumes) by two quantitative image segmentation platforms - 3D Slicer and a method based on Velocity AI and FSL. We investigated the internal consistency of each platform by correlation statistics, association with survival, and concordance with consensus neuroradiologist ratings using ordinal logistic regression. RESULTS: We found high correlations between the two platforms for FLAIR, post contrast abnormal, and total abnormal tumor volumes (spearman's r(67) = 0.952, 0.959, and 0.969 respectively). Only modest agreement was observed for necrosis and contrast-enhancement volumes (r(67) = 0.693 and 0.773 respectively), likely arising from differences in manual and automated segmentation methods of these regions by 3D Slicer and Velocity AI/FSL, respectively. Survival analysis based on AUC revealed significant predictive power of both platforms for the following volumes: contrast-enhancement, post contrast abnormal, and total abnormal tumor volumes. Finally, ordinal logistic regression demonstrated correspondence to manual ratings for several features. CONCLUSION: Tumor volume measurements from both volumetric platforms produced highly concordant and reproducible estimates across platforms for general features. As automated or semi-automated volumetric measurements replace manual linear or area measurements, it will become increasingly important to keep in mind that measurement differences between segmentation platforms for more detailed features could influence downstream survival or radio genomic analyses. Funding:
|
The Role of Micro-CT in 3D Histology Imaging
|
Publication: Pathobiology. 2016;83(2-3):140-7. PMID: 27100885 | PDF Authors: Senter-Zapata M, Patel K, Bautista PA, Griffin M, Michaelson J, Yagi Y. Institution: Pathology Imaging and Communication Technology Center, Massachusetts General Hospital, Boston, MA, USA. Abstract: OBJECTIVES: 3D histology tissue modeling is a useful analytical technique for understanding anatomy and disease at the cellular level. However, the current accuracy of 3D histology technology is largely unknown, and errors, misalignment and missing information are common in 3D tissue reconstruction. We used micro-CT imaging technology to better understand these issues and the relationship between fresh tissue and its 3D histology counterpart. METHODS: We imaged formalin-fixed and 2% Lugol-stained mouse brain, human uterus and human lung tissue with micro-CT. We then conducted image analyses on the tissues before and after paraffin embedding using 3D Slicer and ImageJ software to understand how tissue changes between the fixation and embedding steps. RESULTS: We found that all tissue samples decreased in volume by 19.2-61.5% after embedding, that micro-CT imaging can be used to assess the integrity of tissue blocks, and that micro-CT analysis can help to design an optimized tissue-sectioning protocol. CONCLUSIONS: Micro-CT reference data help to identify where and to what extent tissue was lost or damaged during slide production, provides valuable anatomical information for reconstructing missing parts of a 3D tissue model, and aids in correcting reconstruction errors when fitting the image information in vivo and ex vivo. |
Preoperative Visualization of Cranial Nerves in Skull Base Tumor Surgery Using Diffusion Tensor Imaging Technology
|
Publication: Turk Neurosurg. 2016;26(6):805-12. PMID: 27476917 | PDF Authors: Ma J, Su S, Yue S, Zhao Y, Li Y, Chen X, Ma H. Institution: General Hospital of Tianjin Medical University, Division of Neurosurgery, Tianjin, China. Abstract: AIM: To visualize cranial nerves (CNs) using diffusion tensor imaging (DTI) with special parameters. This study also involved the evaluation of preoperative estimates and intraoperative confirmation of the relationship between nerves and tumor by verifying the accuracy of visualization. MATERIAL AND METHODS: 3T magnetic resonance imaging scans including 3D-FSPGR, FIESTA, and DTI were used to collect information from 18 patients with skull base tumor. DTI data were integrated into the 3D Slicer for fiber tracking and overlapped anatomic images to determine course of nerves. 3D reconstruction of tumors was achieved to perform neighboring, encasing, and invading relationship between lesion and nerves. RESULTS: Optic pathway including the optic chiasm could be traced in cases of tuberculum sellae meningioma and hypophysoma (pituitary tumor). The oculomotor nerve, from the interpeduncular fossa out of the brain stem to supraorbital fissure, was clearly visible in parasellar meningioma cases. Meanwhile, cisternal parts of trigeminal nerve and abducens nerve, facial nerve were also imaged well in vestibular schwannomas and petroclival meningioma cases. The 3D-spatial relationship between CNs and skull base tumor estimated preoperatively by tumor modeling and tractography corresponded to the results determined during surgery. CONCLUSION: Supported by DTI and 3D Slicer, preoperative 3D reconstruction of most CNs related to skull base tumor is feasible in pathological circumstances. We consider DTI Technology to be a useful tool for predicting the course and location of most CNs, and syntopy between them and skull base tumor. |
Patch-Based Segmentation with Spatial Consistency: Application to MS Lesions in Brain MRI
|
Publication: Int J Biomed Imaging. 2016 Jan; 2016:7952541. PMID: 26904103 | PDF Authors: Mechrez R, Goldberger J, Greenspan H. Institution: Biomedical Engineering Department, Tel-Aviv University, Tel Aviv, Israel. Background/Purpose: his paper presents an automatic lesion segmentation method based on similarities between multichannel patches. A patch database is built using training images for which the label maps are known. For each patch in the testing image, k similar patches are retrieved from the database. The matching labels for these k patches are then combined to produce an initial segmentation map for the test case. Finally an iterative patch-based label refinement process based on the initial segmentation map is performed to ensure the spatial consistency of the detected lesions. The method was evaluated in experiments on multiple sclerosis (MS) lesion segmentation in magnetic resonance images (MRI) of the brain. An evaluation was done for each image in the MICCAI 2008 MS lesion segmentation challenge. Results are shown to compete with the state of the art in the challenge. We conclude that the proposed algorithm for segmentation of lesions provides a promising new approach for local segmentation and global detection in medical images. |
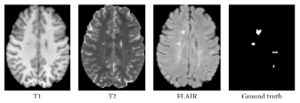 Three axial slices of MS lesions on MRI: FLAIR, T1w, T2w, and the associated ground truth lesion map. The preprocessing steps were carried out with using BrainSuite13, 3D Slicer, and MATLAB. |
Optic Nerve Tractography Prediction of Visual Deficit in Pituitary Macroadenoma
|
Publication: J Neurol Surg B 2016; 77-P060. Authors: Au K, Zadeh G. Institution: Toronto Western Hospital, University Health Network, Toronto, Ontario, Canada. Background/Purpose: The presentation of nonfunctioning pituitary adenomas is frequently delayed due to the absence of a hormonal syndrome, and tumors have often attained a large size by the time of diagnosis. Pronounced compression of the optic chiasm can be evident on imaging, and may be associated with deficits in visual acuity and visual fields. However, the severity of visual symptoms varies widely among patients, and some retain intact visual function despite dramatic optic chiasm deformation. MRI features including optic nerve atrophy and vertical tumor extension, and other modalities such as optical coherence tomography, have not been found to reliably predict visual deficits or recovery of visual function following pituitary tumor resection. Diffusion tensor imaging (DTI) utilizes the principle of anisotropic water diffusion along white matter fibers to reconstruct fiber tracts. Tractography has long been used to delineate large fiber bundles in glioma surgery, but the feasibility of tracking small fiber bundles including cranial nerves has also recently been demonstrated. The optic nerves, chiasm, optic tracts and optic radiations can be displayed to a high degree of detail using DTI. Since processes such as inflammation and demyelination affect water anisotropy, DTI parameters can detect pathologic changes in axonal properties. Patients with a new diagnosis of pituitary adenoma causing compression of the optic chiasm undergo neuro-opthalmologic evaluation including assessment of visual acuity and Humphrey visual field testing. Thin-slice imaging of the sellar region including T1-weighted anatomic imaging and diffusion-weighted imaging (DWI) scans are obtained on 3T MRI, and processed using 3D Slicer software. Neuro-opthalmologic and imaging evaluation are repeated post-operatively in patients who undergo surgical resection of the pituitary tumor. DTI parameters including fractional anisotropy, radial diffusivity and axial diffusivity are measured and correlated to visual findings. The ability to reliably correlate non-invasive imaging with visual function in the setting of optic chiasm compression may allow for accurate identification of patients who will develop visual deficits, and who therefore require more urgent surgical intervention. Such imaging may also be valuable in predicting recovery of visual function following decompressive surgery. |
Go to 2020 :: 2019 :: 2018 :: 2017 :: 2016 :: 2015 :: 2014-2011:: 2010-2005
