Difference between revisions of "Main Page/SlicerCommunity"
| Line 806: | Line 806: | ||
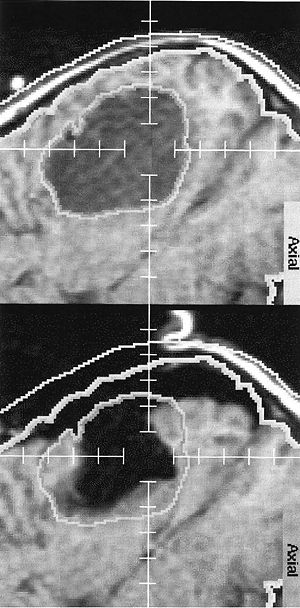
'''Background/Purpose:''' Bone engineering of localized craniofacial osseous defects or deficiencies by stem cell therapy offers strong prospects to improve treatment predictability for patient care. The aim of this phase I/II randomized, controlled, clinical trial was to evaluate reconstruction of bone deficiencies of the maxillary sinus with transplantation of autologous cells enriched with CD90+ stem cells and CD14+ monocytes. Thirty human participants requiring bone augmentation of the maxillary sinus were enrolled. Patients presenting with 50-80% bone deficiencies of the maxillary sinus were randomized to receive either stem cells delivered onto a β-tricalcium phosphate scaffold, or scaffold alone. Four months following treatment, clinical, radiographic, and histologic analyses were performed to evaluate de novo engineered bone. At the time of alveolar bone core harvest, oral implants were installed in the engineered bone and later functionally restored with dental tooth prostheses. Radiographic analyses showed no difference in the total bone volume gained between treatment groups, however, density of the engineered bone was higher in patients receiving stem cells. Bone core biopsies showed that stem cell therapy provided the greatest benefit in the most severe deficiencies, yielding better bone quality than control patients, as evidenced by higher bone volume fraction (BVF; 0.5 vs. 0.4; p=0.04). Assessment of the relation between degree of CD90+ stem cell enrichment and BVF showed that the higher the CD90 composition of transplanted cells, the greater the BVF of regenerated bone (r=0.56; p=0.05). Oral implants were placed and restored with functionally-loaded dental restorations in all patients and no treatment-related adverse events were reported at the one-year follow-up. These results provide evidence that cell-based therapy using enriched CD90+ stem cell populations is safe for maxillary sinus floor reconstruction and offers potential to accelerate and enhance tissue engineered bone quality in other craniofacial bone defects and deficiencies. An automated, voxel-based registration method was performed with [http://www.slicer.org '''3D Slicer''']. | '''Background/Purpose:''' Bone engineering of localized craniofacial osseous defects or deficiencies by stem cell therapy offers strong prospects to improve treatment predictability for patient care. The aim of this phase I/II randomized, controlled, clinical trial was to evaluate reconstruction of bone deficiencies of the maxillary sinus with transplantation of autologous cells enriched with CD90+ stem cells and CD14+ monocytes. Thirty human participants requiring bone augmentation of the maxillary sinus were enrolled. Patients presenting with 50-80% bone deficiencies of the maxillary sinus were randomized to receive either stem cells delivered onto a β-tricalcium phosphate scaffold, or scaffold alone. Four months following treatment, clinical, radiographic, and histologic analyses were performed to evaluate de novo engineered bone. At the time of alveolar bone core harvest, oral implants were installed in the engineered bone and later functionally restored with dental tooth prostheses. Radiographic analyses showed no difference in the total bone volume gained between treatment groups, however, density of the engineered bone was higher in patients receiving stem cells. Bone core biopsies showed that stem cell therapy provided the greatest benefit in the most severe deficiencies, yielding better bone quality than control patients, as evidenced by higher bone volume fraction (BVF; 0.5 vs. 0.4; p=0.04). Assessment of the relation between degree of CD90+ stem cell enrichment and BVF showed that the higher the CD90 composition of transplanted cells, the greater the BVF of regenerated bone (r=0.56; p=0.05). Oral implants were placed and restored with functionally-loaded dental restorations in all patients and no treatment-related adverse events were reported at the one-year follow-up. These results provide evidence that cell-based therapy using enriched CD90+ stem cell populations is safe for maxillary sinus floor reconstruction and offers potential to accelerate and enhance tissue engineered bone quality in other craniofacial bone defects and deficiencies. An automated, voxel-based registration method was performed with [http://www.slicer.org '''3D Slicer''']. | ||
| + | |||
| + | '''Funding:''' | ||
| + | *UL1 RR024986/RR/NCRR NIH HHS/United States | ||
|} | |} | ||
Revision as of 15:06, 16 June 2016
Home < Main Page < SlicerCommunityContents
- 1 3D Slicer Enabled Research
- 2 2016
- 2.1 Development of a Nomogram Combining Clinical Staging with 18F-FDG PET/CT Image Features in Non-small-cell Lung Cancer Stage I-III.
- 2.2 Patient and Aneurysm Characteristics Associated with Rupture Risk of Multiple Intracranial Aneurysms in the Anterior Circulation System
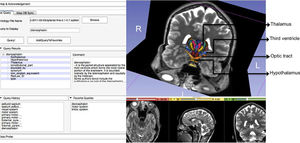
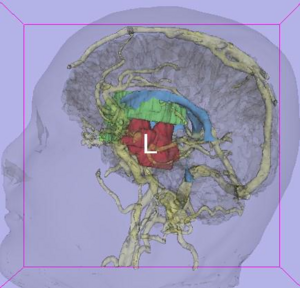
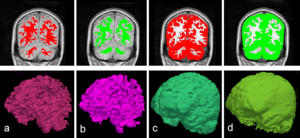
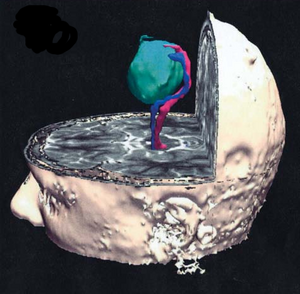
- 2.3 Morphological and Volumetric Assessment of Cerebral Ventricular System with 3D Slicer Software
- 2.4 Evaluating the Utility of "3D Slicer" as a Fast and Independent Tool to Assess Intrafractional Organ Dose Variations in Gynecological Brachytherapy
- 2.5 Common 3-dimensional Coordinate System for Assessment of Directional Changes
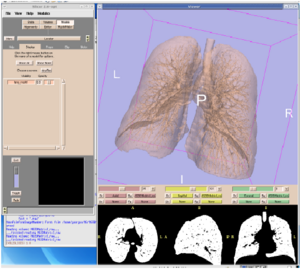
- 2.6 3D Printing and 3D Slicer - Powerful Tools in Understanding and Treating Structural Lung Disease
- 2.7 STN-DBS Reduces Saccadic Hypometria but Not Visuospatial Bias in Parkinson's Disease Patients
- 2.8 Low-cost Interactive Image-based Virtual Endoscopy for the Diagnosis and Surgical Planning of Suprasellar Arachnoid Cysts
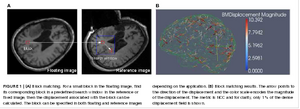
- 2.9 A Method for the Assessment of Time-varying Brain Shift during Navigated Epilepsy Surgery
- 2.10 Deformable Image Registration with a Featurelet Algorithm: Implementation as a 3D Slicer Extension and Validation
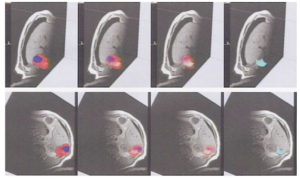
- 2.11 Accuracy of Lesion Boundary Tracking in Navigated Breast Tumor Excision
- 2.12 Effects of Voxelization on Dose Volume Histogram Accuracy
- 2.13 Extracted Magnetic Resonance Texture Features Discriminate between Phenotypes and are Associated with Overall Survival in Glioblastoma Multiforme Patients
- 2.14 Real-time Self-calibration of a Tracked Augmented Reality Display
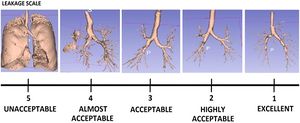
- 2.15 Accuracy of Open-Source Software Segmentation and Paper-based Printed Three-Dimensional Models
- 2.16 Multi Texture Analysis of Colorectal Cancer Continuum Using Multispectral Imagery
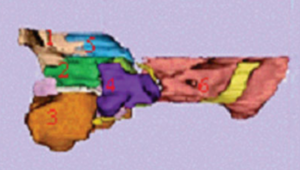
- 2.17 Cranial Anatomy and Palaeoneurology of the Archosaur Riojasuchus tenuisceps from the Los Colorados Formation, La Rioja, Argentina
- 2.18 Diffusion Tensor Imaging Assessment of Microstructural Brainstem Integrity in Chiari Malformation Type I.
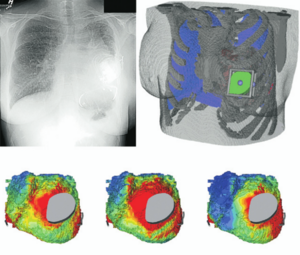
- 2.19 Large Area 3-D Optical Coherence Tomography Imaging of Lumpectomy Specimens for Radiation Treatment Planning
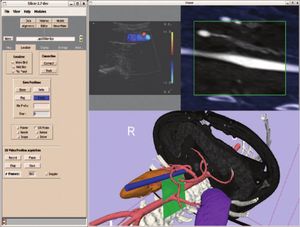
- 2.20 Development and Evaluation of an Open-Source 3D Virtual Simulator with Integrated Motion-Tracking as a Teaching Tool for Pedicle Screw Insertion
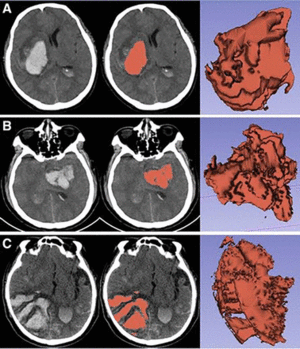
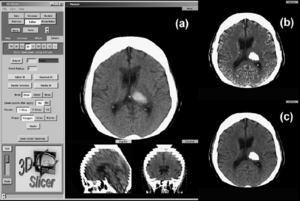
- 2.21 Effect of Decompressive Craniectomy on Perihematomal Edema in Patients with Intracerebral Hemorrhage
- 2.22 Current Smoking Status Is Associated with Lower Quantitative CT Measures of Emphysema and Gas Trapping
- 2.23 A Proposed Method for Accurate 3D Analysis of Cochlear Implant Migration Using Fusion of Cone Beam CT
- 2.24 Boolean Combinations of Implicit Functions for Model Clipping in Computer-Assisted Surgical Planning
- 2.25 Three-Dimensional Visualization of the Distribution of Melanin-Concentrating Hormone Producing Neurons in the Mouse Hypothalamus
- 2.26 In Vivo Visualization of the Facial Nerve in Patients with Acoustic Neuroma using Diffusion Tensor Imaging-Based Fiber Tracking
- 2.27 Optic Nerve Tractography Prediction of Visual Deficit in Pituitary Macroadenoma
- 3 2015
- 3.1 Patch-Based Segmentation with Spatial Consistency: Application to MS Lesions in Brain MRI
- 3.2 MRI-Only Based Radiotherapy Treatment Planning for the Rat Brain on a Small Animal Radiation Research Platform (SARRP)
- 3.3 Potential of Diffusion Tensor Imaging and Relaxometry for the Detection of Specific Pathological Alterations in Parkinson's Disease (PD)
- 3.4 Effects of Ncl. Basalis Meynert Volume on the Trail-Making-Test are Restricted to the Left Hemisphere
- 3.5 High Contrast Microstructural Visualization of Natural Acellular Matrices by Means of Phase-Based X-Ray Tomography
- 3.6 Treatment Planning and Delivery of Whole Brain Irradiation with Hippocampal Avoidance in Rats
- 3.7 Performance of Single And Multi-Atlas Based Automated Landmarking Methods Compared to Expert Annotations in Volumetric Microct Datasets of Mouse Mandibles
- 3.8 The Design and Validation of a Novel Semiautomatic Lung Navigation Platform
- 3.9 A Novel Procedure for Rapid Imaging of Adult Mouse Brains with MicroCT using Iodine-Based Contrast
- 3.10 Comparison between Magnetic Resonance Imaging Estimates of Extracranial Cerebrospinal Fluid Volume and Physical Measurements in Healthy Dogs
- 3.11 Automatic Classification of Prostate Cancer Gleason Scores from Multiparametric Magnetic Resonance Images
- 3.12 Association Between Vascular Anatomy and Posterior Communicating Artery Aneurysms
- 3.13 An Open Tool for Input Function Estimation and Quantification of Dynamic PET FDG Brain Scans
- 3.14 Seeing More by Showing Less: Orientation-Dependent Transparency Rendering for Fiber Tractography Visualization
- 3.15 MR Diffusion-weighted Imaging-based Subcutaneous Tumour Volumetry in a Xenografted Nude Mouse Model using 3D Slicer: An Accurate and Repeatable Method
- 3.16 Spinal Cord Segmentation by One Dimensional Normalized Template Matching: A Novel, Quantitative Technique to Analyze Advanced Magnetic Resonance Imaging Data
- 3.17 A Multidimensional Dynamic Quantification Tool for the Mitral Valve
- 3.18 Clinical and Radiologic Disease in Smokers With Normal Spirometry
- 3.19 Two-Center Prospective, Randomized, Clinical, and Radiographic Study Comparing Osteotome Sinus Floor Elevation with or without Bone Graft and Simultaneous Implant Placement
- 3.20 Isometric Scaling in Developing Long Bones Is Achieved by an Optimal Epiphyseal Growth Balance
- 3.21 A Statistical Shape Model of the Human Second Cervical Vertebra
- 3.22 Bone Engineering of Maxillary Sinus Bone Deficiencies using Enriched CD90+ Stem Cell Therapy: A Randomized Clinical Trial
- 3.23 Three-Dimensional Eyeball and Orbit Volume Modification After LeFort III Midface Distraction
- 3.24 High-field Functional Magnetic Resonance Imaging of Vocalization Processing in Marmosets
- 3.25 Optimizing Parameters of an Open-source Airway Segmentation Algorithm using Different CT Images
- 3.26 Cross-Validation of 3D Gamma Comparison Tools
- 3.27 Effect of Pulse Sequence Parameters On Geometric Distortions Induced by a Titanium Brachytherapy Applicator
- 3.28 Panorama Ultrasound for Navigation and Guidance of Epidural Anesthesia
- 3.29 Towards the Personalized Treatment of Glioblastoma: Integrating Patient-Specific Clinical Data in a Continuous Mechanical Model
- 3.30 Intraoperative Image-guided Transoral Robotic Surgery: Pre-clinical Studies
- 3.31 Brain Atrophy and White-matter Hyperintensities are Not Significantly Associated with Incidence and Severity of Postoperative Delirium in Older Persons without Dementia
- 3.32 Morphology Parameters for Mirror Posterior Communicating Artery Aneurysm Rupture Risk Assessment
- 3.33 Intraoperative High-field Magnetic Resonance Imaging Combined with Functional Neuronavigation in Resection of Low-grade Temporal Lobe Tumors Involving Optic Radiation [Article in Chinese]
- 3.34 Reduced Bone Density and Vertebral Fractures in Smokers. Men and COPD Patients at Increased Risk
- 3.35 Fibrin-based 3D Matrices Induce Angiogenic Behavior of Adipose-derived Stem Cells
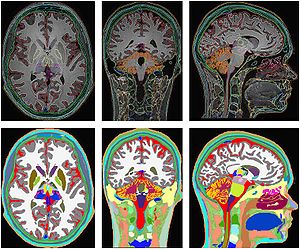
- 3.36 MIDA: A Multimodal Imaging-Based Detailed Anatomical Model of the Human Head and Neck
- 3.37 Craniofacial Reconstruction using Rational Cubic Ball Curves
- 3.38 Age Related Differences in Diffusion Tensor Indices and Fiber Architecture in the Medial and Lateral Gastrocnemius
- 3.39 Volumetric Alterations in the Nucleus Accumbens and Caudate Nucleus in Bulimia Nervosa: A Structural Magnetic Resonance Imaging Study
- 3.40 Validation of Osteoarthritis Synthetic Defect Database via Non-rigid Registration
- 3.41 Validation of CBCT for the Computation of Textural Biomarkers
- 3.42 Comparison between an Alternative and the Classic Definition of Chronic Bronchitis in COPDGene
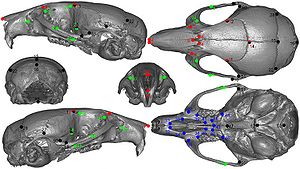
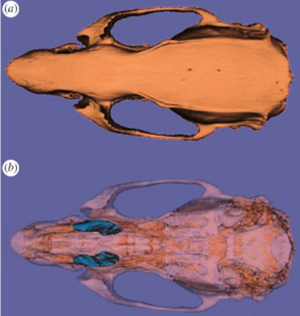
- 3.43 Quantitative Trait Loci Affecting the 3D Skull Shape and Size in Mouse and Prioritization of Candidate Genes in-silico
- 3.44 Automatic Segmentation of Deep Intracerebral Electrodes in Computed Tomography Scans
- 3.45 Openigtlink Interface for State Control and Visualisation of a Robot for Image-Guided Therapy Systems
- 3.46 Safe and Rapid Contouring of Fibro-osseous Lesions in the Orbital Area using Navigation with Minimally Invasive Cranial Bone Registration
- 3.47 Open Source Software in a Practical Approach for Post Processing of Radiologic Images
- 3.48 Functional Mapping of the Human Visual Cortex with Intravoxel Incoherent Motion MRI
- 3.49 Factors Affecting Capsular Volume Changes and Association with Outcomes after Bankart Repair and Capsular Shift
- 3.50 A Gradient in Cortical Pathology in Multiple Sclerosis by in vivo Quantitative 7 T Imaging
- 3.51 Role of Mri-Based Tumor Volume Measurements in Surgical Treatment of Breast Cancer
- 3.52 Factors Affecting Capsular Volume Changes and Association with Outcomes after Bankart Repair and Capsular Shift
- 3.53 B-Mode and Acoustic Radiation Force Impulse (ARFI) Imaging of Prostate Zonal Anatomy: Comparison with 3T T2-Weighted MR Imaging
- 3.54 Optical Polarization Tractography Revealed Significant Fiber Disarray in Skeletal Muscles of a Mouse Model for Duchenne Muscular Dystrophy
- 3.55 Hippocampal Volume is Reduced in Schizophrenia and Schizoaffective Disorder but Not in Psychotic Bipolar I Disorder Demonstrated by Both Manual Tracing and Automated Parcellation (Freesurfer)
- 4 2014
- 4.1 Structural and Functional Bases of Inhibited Temperament
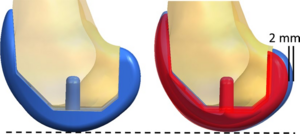
- 4.2 Femoral and Tibial Insert Downsizing Increases the Laxity Envelope in TKA
- 4.3 MR-Guided Vertebroplasty with Augmented Reality Image Overlay Navigation
- 4.4 Medial Frontal White and Gray Matter Contributions to General Intelligence
- 4.5 Elastography using Multi-Stream GPU: An Application to Online Tracked Ultrasound Elastography, In-Vivo and the da Vinci Surgical System
- 4.6 Texture Descriptors to distinguish Radiation Necrosis from Recurrent Brain Tumors on multi-parametric MRI
- 4.7 Comparison of the Tada Formula with Software Slicer: Precise and Low-Cost Method for Volume Assessment of Intracerebral Hematoma
- 4.8 Segmentation of Metastatic Lesions in Large-scale Registries: Comparison of Expert Manual Segmentation vs. Semi-automated Methods
- 4.9 A New Improved Method for Assessing Brain Deformation after Decompressive Craniectomy
- 4.10 Posterior Cerebral Artery Angle and the Rupture of Basilar Tip Aneurysms
- 4.11 Distribution of Coronoid Fracture Lines by Specific Patterns of Traumatic Elbow Instability
- 4.12 Cardiovascular Magnetic Resonance Imaging of Scar Development Following Pulmonary Vein Isolation: A Prospective Study
- 4.13 Clinical Testing of an Alternate Method of Inserting Bone-Implanted Fiducial Markers
- 4.14 Three-Dimensional Imaging of HIV-1 Virological Synapses Reveals Membrane Architectures Involved in Virus Transmission
- 4.15 How Action Selection can be Embodied: Intracranial Gamma Band Recording Shows Response Competition during the Eriksen Flankers Test
- 4.16 Airway Wall Thickness is Increased in COPD Patients with Bronchodilator Responsiveness
- 4.17 Compact Robotically Steerable Image-Guided Instrument for Multi-Adjacent-Point (MAP) Targeting
- 4.18 Combined Compared to Dissociated Oral and Intestinal Sucrose Stimuli induce Different Brain Hedonic Processes
- 4.19 Microstructural Changes in the Striatum and Their Impact on Motor and Neuropsychological Performance in Patients with Multiple Sclerosis
- 4.20 Design and Initial Evaluation of a Treatment Planning Software System for MRI-guided Laser Ablation in the Brain
- 4.21 Orbitofrontal Cortex Volume in Area 11/13 Predicts Reward Devaluation, but not Reversal Learning Performance, in Young and Aged Monkeys
- 4.22 Robust Radiomics Feature Quantification using Semiautomatic Volumetric Segmentation
- 4.23 Tranexamic Acid for Spontaneous Intracerebral Hemorrhage: A Randomized Controlled Pilot Trial (ISRCTN50867461)
- 4.24 Bi-modal Non-rigid Registration of Brain MRI Data with Deconvolution of Joint Statistics
- 4.25 On the Design and Development of A Breast Biopsy Navigation System: Path Generation Algorithm and System with Its GUI Evaluation
- 4.26 The Efficacy of Neuroendoscopic Treatment for Middle Cranial Fossa Arachnoid Cysts Assessed by MRI 3D Segmentation and Modeling
- 4.27 Relationship between Interleukin-6 Gene Polymorphism and Hippocampal Volume in Antipsychotic-Naïve Schizophrenia: Evidence for Differential Susceptibility?
- 4.28 Multi-Modal Glioblastoma Segmentation: Man versus Machine
- 4.29 Rapid Amygdala Responses during Trace Fear Conditioning without Awareness
- 4.30 BNST Neurocircuitry in Humans
- 4.31 An Intra-Individual Comparison of MRI, [18F]-FET and [18F]-FLT PET in Patients with High-Grade Gliomas
- 4.32 The Swallow Tail Appearance of the Healthy Nigrosome – A New Accurate Test of Parkinson’s Disease: A Case- Control and Retrospective Cross-Sectional MRI Study at 3T
- 4.33 Clinical and Computed Tomographic Predictors of Chronic Bronchitis in COPD: A Cross Sectional Analysis of the COPDGene Study
- 4.34 Faceted Visualization of Three Dimensional Neuroanatomy by Combining Ontology with Faceted Search
- 4.35 An ITK Implementation of a Physics-based Non-rigid Registration Method for Brain Deformation in Image-guided Neurosurgery
- 4.36 Morphological Parameters Associated with Ruptured Posterior Communicating Aneurysms
- 4.37 Computational Modelling of Emboli Travel Trajectories in Cerebral Arteries: Influence of Microembolic Particle Size and Density
- 4.38 Adaptive Distance Metric Learning for Diffusion Tensor Image Segmentation
- 4.39 Multiple White Matter Volume Reductions in Patients with Panic Disorder: Relationships between Orbitofrontal Gyrus Volume and Symptom Severity and Social Dysfunction
- 4.40 Using Stress MRI to Analyze the 3D Changes in Apical Ligament Geometry from Rest to Maximal Valsalva: A Pilot Study
- 4.41 Scanning Fast and Slow: Current Limitations of 3 Tesla Functional MRI and Future Potential
- 4.42 Molecular Drivers and Cortical Spread of Lateral Entorhinal Cortex Dysfunction in Preclinical Alzheimer’s Disease
- 4.43 Retrosigmoid Implantation of an Active Bone Conduction Stimulator in a Patient with Chronic Otitis Media
- 4.44 Evaluation of Prostate Segmentation Algorithms for MRI: The PROMISE12 Challenge
- 4.45 The Detection and Visualization of Brain Tumors on T2-Weighted MRI Images using Multiparameter Feature Blocks
- 4.46 Spinal Curvature Measurement by Tracked Ultrasound Snapshots
- 4.47 Robust Radiomics Feature Quantification using Semiautomatic Volumetric Segmentation
- 4.48 Sequencing Biological and Physical Events Affects Specific Frequency Bands within the Human Premotor Cortex: An Intracerebral EEG Study
- 4.49 Regional 3D Superimposition to assess Temporomandibular Joint Condylar Morphology
- 5 2013
- 5.1 Tracked Ultrasound Snapshots in Percutaneous Pedicle Screw Placement Navigation: A Feasibility Study
- 5.2 Dietary Cholesterol Increases Ventricular Volume and Narrows Cerebrovascular Diameter in a Rabbit Model of Alzheimer's Disease
- 5.3 Rapid and Efficient Localization of Depth Electrodes and Cortical Labeling using Free and Open Source Medical Software in Epilepsy Surgery Candidates
- 5.4 Reduced Habituation in Patients with Schizophrenia
- 5.5 On the Prospect of Patient-specific Biomechanics without Patient-specific Properties of Tissues
- 5.6 Derivation of Neural Stem Cells from Human Adult Peripheral CD34+ Cells for an Autologous Model of Neuroinflammation
- 5.7 Can Transrectal Needle Biopsy be Optimised to Detect Nearly All Prostate Cancer with a Volume of ≥0.5 mL? A Three-dimensional Analysis
- 5.8 Analysis of Morphological Parameters to Differentiate Rupture Status in Anterior Communicating Artery Aneurysms
- 5.9 Anatomic and Morphological Evaluation of the Quadriceps Tendon using 3-Dimensional Magnetic Resonance Imaging Reconstruction
- 5.10 Optical Tractography of the Mouse Heart using Polarization-sensitive Optical Coherence Tomography
- 5.11 Individual subject classification of mixed dementia from pure subcortical vascular dementia based on subcortical shape analysis
- 5.12 3D Prostate Histology Image Reconstruction: Quantifying the Impact of Tissue Deformation and Histology Section Location
- 5.13 Heat-induced Shrinkage and Shape Preservation of Teeth: A Radiologic Evaluation
- 5.14 Clinical Correlates of Nucleus Accumbens Volume in Drug-naive, Adult Patients with Obsessive-compulsive Disorder
- 5.15 Probing the Regional Distribution of Pulmonary Gas Exchange through Single-breath gas- and Dissolved-phase 129Xe MR Imaging
- 5.16 Resection Probability Maps for Quality Assessment of Glioma Surgery without Brain Location Bias
- 5.17 Consistent Surgeon Evaluations of Three-Dimensional Rendering of PET/CT Scans of the Abdomen of a Patient with a Ductal Pancreatic Mass
- 5.18 Fiber Tract-Driven Topographical Mapping (FTTM) Reveals Microstructural Relevance for Interhemispheric Visuomotor Function in the Aging Brain
- 5.19 Prostate Volumetric Assessment by Magnetic Resonance Imaging and Transrectal Ultrasound: Impact of Variation in Calculated Prostate-Specific Antigen Density on Patient Eligibility for Active Surveillance Program
- 5.20 Quantification and Analysis of 3D Magnetic Resonance Image Brain Tumor
- 5.21 Optic Radiation Fiber Tractography in Glioma Patients Based on High Angular Resolution Diffusion Imaging with Compressed Sensing Compared with Diffusion Tensor Imaging - Initial Experience
- 5.22 Endodontic Access Cavity Simulation in Ceramic Dental Crowns
- 5.23 Augmented Reality Visualization using Image Overlay Technology for MR-Guided Interventions: Cadaveric Bone Biopsy at 1.5 T
- 5.24 How to Detect Amygdala Activity with Magnetoencephalography using Source Imaging
- 5.25 Paired Inspiratory-expiratory Chest CT Scans to Assess for Small Airways Disease in COPD
- 5.26 Imaging in Audiology: A Case Report of a Patient with Bilateral Acoustic Neuroma
- 5.27 Computed Tomography Image Processing to Detect the Real Mechanism of Bioprosthesis Failure: Implication for Valve-in-valve Implantation
- 5.28 Preliminary Study on the Clinical Application of Augmented Reality Neuronavigation
- 5.29 Quantitative MRI Analysis of Craniofacial Bone Marrow in Patients with Sickle Cell Disease
- 5.30 Software for MR Image Overlay Guided Needle Insertions: The Clinical Translation Process
- 5.31 Analysis of Conventional Swept-source OCT of Subglottic Stenosis in a Rabbit Model
- 5.32 Three-dimensional Volumetric Rendition of Cannon Ball Pulmonary Metastases by the Use of 3D Slicer, an Open Source Free Software Package
- 5.33 In Vivo Imaging of Dopaminergic Neurotransmission after Transient Focal Ischemia in Rats
- 5.34 MRI Evidence for Altered Venous Drainage and Intracranial Compliance in Mild Traumatic Brain Injury
- 5.35 A Robust Variational Approach for Simultaneous Smoothing and Estimation of DTI
- 5.36 Augmented Reality Visualisation Using an Image Overlay System for MR-guided Interventions: Technical Performance of Spine Injection Procedures in Human Cadavers at 1.5 Tesla
- 6 2012
- 6.1 Comparative Evaluation of Mitral Valve Strain by Deformation Tracking in 3D-Echocardiography
- 6.2 Perk Tutor: An Open-source Training Platform for Ultrasound-guided Needle Insertions
- 6.3 Pituitary Adenoma Volumetry with 3D Slicer
- 6.4 Differences in Simple Morphological Variables in Ruptured and Unruptured Middle Cerebral Artery Aneurysms
- 6.5 3D Slicer as an Image Computing Platform for the Quantitative Imaging Network
- 6.6 SlicerRT: Radiation Therapy Research oolkit for 3D Slicer
- 6.7 Developmental Trajectories of Amygdala and Hippocampus from Infancy to Early Adulthood in Healthy Individuals
- 6.8 Extra-Hippocampal Subcortical Limbic Involvement Predicts Episodic Recall Performance in Multiple Sclerosis
- 6.9 Advanced Neuroimaging in Traumatic Brain Injury
- 6.10 Posterior Vaginal Prolapse Shape and Position Changes at Maximal Valsalva Seen in 3D MRI-based Models
- 6.11 Talairach Methodology in the Multimodal Imaging and Robotics Era
- 6.12 SARRP Dose Planning System
- 6.13 Three-dimensional Image Quantification as a New Morphometry Method for Microvascular Tissue Engineering
- 6.14 Prostate: Registration of Digital Histopathologic Images to in Vivo MR Images Acquired by Using Endorectal Receive Coil
- 6.15 A Comparison of the Effect of Age on Levator Ani and Obturator Internus Muscle Cross-sectional Areas and Volumes in Nulliparous Women
- 6.16 A System for Video-based Navigation for Endoscopic Endonasal Skull Base Surgery
- 6.17 Levator Ani Subtended Volume: A Novel Parameter to Evaluate Levator Ani Muscle Laxity in Pelvic Organ Prolapse
- 6.18 Tractography Delineates Microstructural Changes in the Trigeminal Nerve After Focal Radiosurgery for Trigeminal Neuralgia
- 6.19 Square-cut: A Segmentation Algorithm on the Basis of a Rectangle Shape
- 6.20 Anatomical and Functional Correlates of Human Hippocampal Volume Asymmetry
- 6.21 Hippocampal Subregions are Differentially Affected in the Progression to Alzheimer's Disease
- 6.22 Long-term Memory Search Across the Visual Brain
- 6.23 Temporal Course of Cerebrospinal Fluid Dynamics and Amyloid Accumulation in the Aging Rat Brain from Three to Thirty Months
- 6.24 Intact Relational Memory and Normal Hippocampal Structure in the Early Stage of Psychosis
- 6.25 TREK: An Integrated System Architecture for Intraoperative Cone-beam CT-guided Surgery
- 6.26 Cholesterol Increases Ventricular Volume in a Rabbit Model of Alzheimer's Disease
- 7 2011
- 7.1 Atlas-guided Segmentation of Vervet Monkey Brain MRI
- 7.2 Comparison of Acute and Chronic Traumatic Brain Injury Using Semi-automatic Multimodal Segmentation of MR Volumes
- 7.3 3D Slicer
- 7.4 An Open Environment CT-US Fusion for Tissue Segmentation During Interventional Guidance
- 7.5 Mixed Handedness is Associated with Greater Age-related Decline in Volumes of the Hippocampus and Amygdala: The PATH Through Life Study
- 7.6 Multiple Costal Cartilage Graft Reconstruction for the Treatment of a Full-length Laryngotracheal Stenosis after an Inhalation Burn
- 7.7 A Supervised Patch-based Approach for Human Brain Labeling
- 7.8 The Chronic Bronchitic Phenotype of COPD: An Analysis of the COPDGene Study
- 7.9 Airway Inspector: Phenotyping the Lung in COPD
- 7.10 Distance Measurement in Middle Ear Surgery using a Telemanipulator
- 7.11 3D Slicer as a Tool for Interactive Brain Tumor Segmentation
- 7.12 The Effect of Augmented Reality Training on Percutaneous Needle Placement in Spinal Facet Joint Injections
- 7.13 Optimal Transseptal Puncture Location for Robot-assisted Left Atrial Catheter Ablation
- 7.14 Using KinectTM and a Haptic Interface for Implementation of Real-Time Virtual Fixtures
- 7.15 Multiple Indices of Diffusion Identifies White Matter Damage in Mild Cognitive Impairment and Alzheimer's Disease
- 7.16 Assessment of Abdominal Adipose Tissue and Organ Fat Content by Magnetic Resonance Imaging
- 7.17 Subject-specific Musculoskeletal Modeling of the Lower Extremities in Persons with Unilateral Cerebral Palsy
- 7.18 Consistent Neuroanatomical Age-related Volume Differences Across Multiple Samples
- 7.19 Enhancement of a Master-Slave Robotic System for Natural Orifice Transluminal Endoscopic Surgery
- 7.20 Brain Regional Lesion Burden and Impaired Mobility in the Elderly
- 7.21 Three Dimensional in Vivo Modelling of Vestibular Schwannomas and Surrounding Cranial Nerves using Diffusion Imaging Tractography
- 7.22 Intraoperative Real-Time Querying of White Matter Tracts During Frameless Stereotactic Neuronavigation
- 7.23 Three-dimensional Visualization of Subdural Electrodes for Presurgical Planning
- 7.24 Segmentations of MRI Images of the Female Pelvic Floor: A Study of Inter- and Intra-reader Reliability
- 7.25 3D Visualization of Subdural Electrode Shift as Measured at Craniotomy Reopening
- 7.26 Lung Volumes and Emphysema in Smokers with Interstitial Lung Abnormalities
- 7.27 Integration of 3D Anatomical Data Obtained by CT Imaging and 3D Optical Scanning for Computer Aided Implant Surgery
- 7.28 Anisotropy of Transcallosal Motor Fibres Indicates Functional Impairment in Children with Periventricular Leukomalacia
- 7.29 Automatic Lung Segmentation in CT Images with Accurate Handling of the Hilar Region
- 7.30 Using 3D Slicer in Astronomy
- 7.31 Brain Morphometry in Autism Spectrum Disorders: A Unified Approach for Structure-specific Statistical Analysis of Neuroimaging Data
- 7.32 Cognitive Profile and Brain Morphological Changes in Obstructive Sleep Apnea
- 8 2010
- 8.1 Application of Vascular Model Toolkit (VMTK) for Coronary Arteries
- 8.2 Ion-Abrasion Scanning Electron Microscopy Reveals Surface-Connected Tubular Conduits in HIV-Infected Macrophages
- 8.3 MRI-Guided Robotic Prostate Biopsy: A Clinical Accuracy Validation
- 8.4 A Method for Planning Safe Trajectories in Image-guided Keyhole Neurosurgery
- 8.5 JHU Workshop for Talented Youth
- 8.6 Canine Hippocampal Formation Composited Into Three-dimensional Structure using MPRAGE
- 8.7 Real-time 3-Dimensional Virtual Reality Navigation System with Open MRI for Breast-Conserving Surgery
- 8.8 Interfaces and Integration of Medical Image Analysis Frameworks: Challenges and Opportunities
- 8.9 Evaluation of Robotic Needle Steering in Ex Vivo Tissue
- 8.10 An Open Source Implementation of Colon CAD in 3D Slicer
- 8.11 In Vivo Visualization of Cranial Nerve Pathways in Humans using Diffusion-Based Tractography
- 8.12 Brain Maturation in Adolescence and Young Adulthood: Regional Age-Related Changesi in Cortical Thickness and White Matter Volume and Microstructure
- 8.13 Coronary Artery Centerline Extraction in 3D Slicer using VMTK based Tools
- 8.14 Assessment of Image Registration Accuracy in Three-dimensional Transrectal Ultrasound Guided Prostate Biopsy
- 8.15 Language Laterality in Autism Spectrum Disorder and Typical Controls: A Functional, Volumetric, and Diffusion Tensor MRI Study
- 8.16 Perk Station-Percutaneous Surgery Training and Performance Measurement Platform
- 9 2009
- 9.1 Three-dimensional Appearance of the Lips Muscles with Three-dimensional Isotropic MRI: In Vivo Study
- 9.2 Traces
- 9.3 CLIMB Study (Comprehensive Longitudinal Investigation of Multiple Sclerosis at Brigham and Women’s Hospital) Former NHS Study (The Harvard Multiple Sclerosis Natural History Study)
- 9.4 Steroid Adjunctive Treatment at Initiation of Avonex Therapy for Patients with Mono-Symptomatic or Relapsing-Remitting Multiple Sclerosis
- 9.5 Age-Related Changes of Cognition in Health and Diseases: Image Analysis Core
- 9.6 Harvard Research Nursing Home Project (MOBILIZE study)
- 9.7 Daclizumab Use in Patients with Pediatric Multiple Sclerosis Failing Interferon
- 9.8 MRI findings of pediatric-onset Multiple Sclerosis patients: a retrospective study
- 9.9 Pediatric MS MRI Pilot Project
- 9.10 The Multiple Sclerosis Database Project
- 9.11 Effects of Strain Thresholds on Bone Formation in Response to Mechanical Loading
- 9.12 Automated Ventricular Systems Segmentation in Brain CT Images by Combining Low-level Segmentation and High-level Template Matching
- 9.13 MRI-derived Measurements of Human Subcortical, Ventricular and Intracranial Brain Volumes: Reliability Effects of Scan Sessions, Acquisition Sequences, Data Analyses, Scanner Upgrade, Scanner Vendors and Field Strengths
- 9.14 Integration of the Vascular Modeling Toolkit in 3D Slicer
- 9.15 New EMSegment Module in Slicer3
- 9.16 Interactive 3D Navigation System for Image-guided Surgery
- 9.17 Smaller Amygdala is Associated with Anxiety in Patients with Panic Disorder
- 9.18 Optimal Transseptal Puncture Location for Robot-assisted Left Atrial Catheter Ablation
- 9.19 Measurements from Image-based Three Dimensional Pelvic Floor Reconstruction: A Study of Inter- and Intraobserver Reliability
- 9.20 Three-dimensional Analysis of Rodent Paranasal Sinus Cavities from X-ray Computed Tomography (CT) Scans
- 9.21 Multimodal Imaging in Mild Cognitive Impairment: Metabolism, Morphometry and Diffusion of the Temporal–parietal Memory Network
- 9.22 The Relation between Connection Length and Degree of Connectivity in Young Adults: A DTI Analysis
- 9.23 The ROBOCAST Project: ROBOt and Sensors Integration for Computer Assisted Surgery and Therapy
- 9.24 A Trajectory Planning Method for Reduced Patient Risk in Image-guided Neurosurgery: Preliminary Results
- 9.25 Contrast-maximizing Adaptive Region Growing for CT
- 9.26 Computer-aided 3D Visualization in Oto-rhino-laryngology
- 9.27 Clinical Application of Curvilinear Distraction Osteogenesis for Correction of Mandibular Deformities
- 9.28 In Vivo Hippocampal Measurement and Memory: A Comparison of Manual Tracing and Automated Segmentation in a Large Community-Based Sample
- 9.29 How Volumetric Analysis Quantifies Therapeutic Response of Slow-flow Vascular Malformations
- 9.30 A Minimally Invasive Registration Method using Surface Template-assisted Marker Positioning (STAMP) for Image-guided Otologic Surgery
- 9.31 Diffusion Tractography of the Fornix in Schizophrenia
- 9.32 Spiny Versus Stubby: 3D Reconstruction of Human Myenteric (type I) Neurons
- 10 2008
- 10.1 An Integrated System for Planning, Navigation and Robotic Assistance for Skull Base Surgery
- 10.2 The Relationship between Diffusion Tensor Imaging and Volumetry as Measures of White Matter Properties
- 10.3 3D Modeling-based Surgical Planning in Transsphenoidal Pituitary Surgery - Preliminary Results
- 10.4 A Generic Framework for Internet-based Interactive Applications of High-resolution 3-D Medical Image Data
- 10.5 Anterior Cingulate Cortex Volume Reduction in Patients with Panic Disorder
- 10.6 Future Trends in Robotic Neurosurgery
- 10.7 A Computer Modelling Tool for Comparing Novel ICD Electrode Orientations in Children and Adults
- 10.8 Using Magnetic Resonance Microscopy to Study the Growth Dynamics of a Glioma Spheroid in Collagen I: A Case Study
- 10.9 Lowering the Barriers Inherent in Translating Advances in Neuroimage Analysis to Clinical Research Applications
- 11 2007
- 11.1 Towards Scarless Surgery: An Endoscopic Ultrasound Navigation System for Transgastric Access Procedures
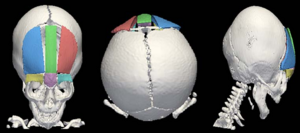
- 11.2 3D Visualization and Simulation of Frontoorbital Advancement in Metopic Synostosis
- 11.3 Creating Physical 3D Stereolithograph Models of Brain and Skull
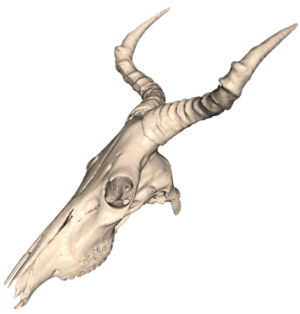
- 11.4 Morphology, Constraints, and Scaling of Frontal Sinuses in the Hartebeest, Alcelaphus Buselaphus (Mammalia: Artiodactlya, Bovidae)
- 11.5 Image-guided Otologic Surgery Based on Patient Motion Compensation and Intraoperative Virtual CT
- 11.6 Non-rigid Registration of Pre-procedural MR Images with Intra- procedural Unenhanced CT Images for Improved Targeting of Tumors During Liver Radiofrequency Ablations
- 11.7 A Detailed 3D Model of the Guinea Pig Cochlea
- 11.8 Dynamic 3-D Computer Modeling Tracks Brain Changes During Surgery
- 11.9 Surface Rendering-based Virtual Intraventricular Endoscopy: Retrospective Feasibility Study and Comparison to Volume Rendering-based Approach
- 11.10 Interest of the Steady State Free Precession (SSFP) Sequence for 3D Modeling of the Whole Fetus
- 11.11 Longitudinal in Vivo Reproducibility of Cartilage Volume and Surface in Osteoarthritis of the Knee
- 11.12 A Novel Manipulator for 3D Ultrasound Guided Percutaneous Needle Insertion
- 11.13 Origin and Insertion Points Involved in Levator Ani Muscle Defects
- 11.14 A Prototype Biosensor-integrated Image-guided Surgery System
- 11.15 Accuracy Evaluation of Initialization-free Registration for Intraoperative 3D-navigation
- 11.16 Development of a Three-dimensional Multiscale Agent-based Tumor Model: Simulating Gene-protein Interaction Profiles, Cell Phenotypes and Multicellular Patterns in Brain Cancer
- 11.17 Image Registered FAST (IRFAST) for Combat Casualty Triage
- 11.18 A Preliminary Study on the Relationship between Nasal Cavity and Maxillary Sinus Volumes
- 11.19 Interobserver Variability in the Determination of Upper Lobe-predominant Emphysema
- 11.20 Registered, Sensor-integrated Virtual Reality for Surgical Applications
- 11.21 Modeling Cancer Biology
- 11.22 A Comparison of Upper Airway Structures in Male and Female Obstructive Sleep Apnoea (OSA) Patients
- 12 2006
- 12.1 Shaving Diffusion Tensor Images in Discriminant Analysis: A Study into Schizophrenia
- 12.2 Interventional Navigation for Abdominal Surgery by Simultaneous Use of MRI and Ultrasound
- 12.3 Diffusion Tensor Imaging Reveals White Matter Reorganization in Early Blind Humans
- 12.4 Molar Crown Thickness, Volume, and Development in South African Middle Stone Age Humans
- 12.5 A 3D Model Simulating Sediment Transport, Erosion and Deposition within a Network of Channel Belts and an Associated Floodplain
- 12.6 Molecular Diffusion in MRI: Technical Application of Fiber Tracking
- 12.7 Quantification of Levator Ani Cross-sectional Area Differences between Women with and Those without Prolapse
- 12.8 Liver Metastases: 3D Shape-based Analysis of CT Scans for Detection of Local Recurrence After Radiofrequency Ablation
- 12.9 Atlas Guided Identification of Brain Structures by Combining 3D Segmentation and SVM Classification
- 12.10 Development of a CAD (Computer Assisted Detection) System to Detect Lung Nodules in CT Scans
- 12.11 Dynamic Simulation of Joints using Multi-Scale Modeling
- 12.12 Quasi-isometric Flattening of Curved Surfaces for Medical Imaging
- 12.13 A Translation Station for Imaging
- 12.14 User-guided 3D Active Contour Segmentation of Anatomical Structures: Significantly Improved Efficiency and Reliability
- 12.15 Habitual Use of the Primate Forelimb is Reflected in the Material Properties of Subchondral Bone in the Distal Radius
- 12.16 Appearance of the Levator Ani Muscle Subdivisions in Magnetic Resonance Images
- 12.17 Virtual Cystoscopy - A Surgical Planning and Guidance Tool
- 12.18 Measurement of the Pubic Portion of the Levator Ani Muscle in Women with Unilateral Defects in 3D Models from MR Images
- 12.19 Finite-element-method (FEM) Model Generation of Time-resolved 3D Echocardiographic Geometry Data for Mitral-valve Volumetry
- 12.20 Range of Curvilinear Distraction Devices Required for Treatment of Mandibular Deformities
- 12.21 Preliminary Study on Digitized Nasal and Temporal Bone Anatomy
- 12.22 Developmental Response to Cold Stress in Cranial Morphology of Rattus: Implications for the Interpretation of Climatic Adaptation in Fossil Hominins
- 12.23 A Ceratopsid Dinosaur Parietal from New Mexico and Its Implications for Ceratopsid Biogeography and Systematics
- 13 2005
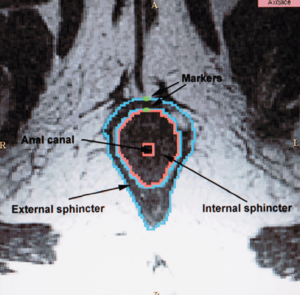
- 13.1 Magnetic Resonance Imaging and 3-Dimensional Analysis of External Anal Sphincter Anatomy
- 13.2 Group-Slicer: A Collaborative Extension of 3D Slicer
- 13.3 2D Rigid Registration of MR Scans using the 1D Binary Projections
- 13.4 Preoperative Hepatic 3D Models: Virtual Liver Resection using Three-dimensional Imaging Technique
- 13.5 Three-dimensional Reconstruction and Volumetry of Intracranial Haemorrhage and its Mass Effect
- 13.6 Vaginal Thickness, Cross-Sectional Area, and Perimeter in Women with and Those without Prolapse
- 13.7 Registration and Fusion of CT and MRI of the Temporal Bone
- 13.8 Open-configuration MR-guided Microwave Thermocoagulation Therapy for Metastatic Liver Tumors from Breast Cancer]
- 13.9 Quantification of Airway Diameters and 3D Airway Tree Rendering from Dynamic Hyperpolarized 3He Magnetic Resonance Imaging
- 13.10 A Finite Element Method Model to Simulate Laser Interstitial Thermo Therapy in Anatomical Inhomogeneous Regions
- 13.11 The Application of DTI to Investigate White Matter Abnormalities in Schizophrenia
- 14 2004
- 14.1 A Statistically Based Flow for Image Segmentation
- 14.2 Decreases in Ventricular Volume Correlate with Decreases in Ventricular Pressure in Idiopathic Normal Pressure Hydrocephalus Patients Who Experienced Clinical Improvement after Implantation with Adjustable Valve Shunts
- 14.3 Spatial Motion Constraints in Medical Robot using Virtual Fixtures Generated by Anatomy
- 14.4 Clinical Validation of the Normalized Mutual Information Method for Registration of CT and MR Images in Radiotherapy of Brain Tumors
- 14.5 Diffusion-tensor Imaging–guided Tracking of Fibers of the Pyramidal Tract Combined with Intraoperative Cortical Stimulation Mapping in Patients with Gliomas
- 14.6 Abnormal Association Between Reduced Magnetic Mismatch Field to Speech Sounds and Smaller Left Planum Temporale Volume in Schizophrenia
- 15 2003
- 15.1 Genetic Contribution to Cartilage Volume in Women: A Classical Twin Study
- 15.2 Advanced Computer Assistance for Magnetic Resonance-guided Microwave Thermocoagulation of Liver Tumors
- 15.3 The Association of Cartilage Volume with Knee Pain
- 15.4 Three-dimensional Reconstruction of Magnetic Resonance Images of the Anal Sphincter and Correlation between Sphincter Volume and Pressure
- 15.5 Surgical Navigation in the Open MRI
- 15.6 The Virtual Craniofacial Patient: 3D Jaw Modeling and Animation
- 16 2002
- 17 2001
- 18 2000
3D Slicer Enabled Research
3D Slicer is a free open source software package distributed under a BSD style license. The majority of funding for the development of 3D slicer comes from a number of grants and contracts from the National Institutes of Health. See Slicer Acknowledgments for more information.
This page focuses on research that was done outside of our immediate collaboration community. That community is represented in the publication database.
We invite you to provide information on how you are using 3D Slicer to produce peer-reviewed research. Information about the scientific impact of this tool is helpful in raising funding for the continued support.
2016
Development of a Nomogram Combining Clinical Staging with 18F-FDG PET/CT Image Features in Non-small-cell Lung Cancer Stage I-III.
|
Publication: Eur J Nucl Med Mol Imaging. 2016 Jul;43(8):1477-85. PMID: 26896298 Authors: Desseroit MC, Visvikis D, Tixier F, Majdoub M, Perdrisot R, Guillevin R, Cheze Le Rest, Hatt M. Institution: Nuclear Medicine, University Hospital, Poitiers, France. Background/Purpose: Our goal was to develop a nomogram by exploiting intratumour heterogeneity on CT and PET images from routine 18F-FDG PET/CT acquisitions to identify patients with the poorest prognosis. METHODS: This retrospective study included 116 patients with NSCLC stage I, II or III and with staging 18F-FDG PET/CT imaging. Primary tumour volumes were delineated using the FLAB algorithm and 3D Slicer on PET and CT images, respectively. PET and CT heterogeneities were quantified using texture analysis. The reproducibility of the CT features was assessed on a separate test-retest dataset. The stratification power of the PET/CT features was evaluated using the Kaplan-Meier method and the log-rank test. The best standard metric (functional volume) was combined with the least redundant and most prognostic PET/CT heterogeneity features to build the nomogram. RESULTS: PET entropy and CT zone percentage had the highest complementary values with clinical stage and functional volume. The nomogram improved stratification amongst patients with stage II and III disease, allowing identification of patients with the poorest prognosis (clinical stage III, large tumour volume, high PET heterogeneity and low CT heterogeneity). CONCLUSION: Intratumour heterogeneity quantified using textural features on both CT and PET images from routine staging18F-FDG PET/CT acquisitions can be used to create a nomogram with higher stratification power than staging alone. |
Patient and Aneurysm Characteristics Associated with Rupture Risk of Multiple Intracranial Aneurysms in the Anterior Circulation System
|
Publication: Acta Neurochir (Wien). 2016 Jul;158(7):1367-75. PMID: 27165300 Authors: Jiang H, Weng YX, Zhu Y, Shen J, Pan JW, Zhan RY. Institution: Department of Neurosurgery, The First Affiliated Hospital, School of Medicine, Zhejiang University, Zhejiang, China. Background/Purpose: Multiple intracranial aneurysms (MIAs) are associated with poorer outcomes after rupture than are single intracranial aneurysms (SIAs). Although the risk factors for intracranial aneurysm rupture have been widely investigated, few studies have focused on MIAs. Thus, the present study aimed to determine whether there are differences in the patient and aneurysm characteristics between those with ruptured and unruptured anterior circulation MIAs (AC-MIAs). METHOD: The present study included 97 patients with AC-MIAs (58 ruptured, 39 unruptured). Data regarding patient characteristics, aneurysm location, mirror aneurysms (MirAns), and bleb formations were collected from medical records and angiography images. Three-dimensional (3D) geometries generated with a 3D Slicer were evaluated to determine the range of morphological parameters. A univariate analysis was conducted to identify significant differences between the groups and receiver-operating characteristic (ROC) analyses were performed for each morphological parameter. RESULTS: There are significantly fewer patients younger than 40 years of age in the ruptured group (P = 0.04); although the groups did not significantly differ with regard to smoking and hypertension, the ruptured group included significantly more current smokers who smoked more than 20 cigarettes per day (P = 0.025) and significantly more patients with a history of hypertension but an irregular use of anti-hypertensive medications (P = 0.043). Ruptured AC-MIAs were more likely to be located in the internal carotid artery (ICA) communicating artery (ICA C7) and anterior communicating artery (AComA; P = 0.000), to have formed a pair of MirAns (P = 0.001), and to have a bleb formation (P = 0.000). In terms of morphological parameters, the two groups differed significantly regarding aneurysm size (P = 0.000), neck width (P = 0.016), bottleneck factor (BNF; P = 0.000), height/width ratio (H/W; P = 0.031), aspect ratio (AR; P = 0.000) and size ratio (SR; P = 0.000). Additionally, the ROC analyses revealed that the optimal threshold size for rupture was 4.00 mm and that the SR had the highest area under the curve (AUC) value (0.826). CONCLUSIONS: The present study found that current smokers who smoked more than 20 cigarettes per day and those with hypertension but an irregular use of anti-hypertensive medications were more likely to suffer from rupture. Aneurysm location and bleb formation were closely related to the rupture of AC-MIAs, and SR was a better predictor of AC-MIAs rupture status than size, neck width, BNF, H/W and AR. These findings should be verified by future prospective follow-up studies of AC-MIAs. |
Morphological and Volumetric Assessment of Cerebral Ventricular System with 3D Slicer Software
|
Publication: J Med Syst. 2016 Jun;40(6):154. PMID: 27147517 Authors: Gonzalo Domínguez M, Hernández C, Ruisoto P, Juanes JA, Prats A, Hernández T. Institution: Medical Care Center in Zamora, Calle Sanchez Llevot 1, 6°1, 37005, Salamanca, Spain. Background/Purpose: We present a technological process based on the 3D Slicer software for the three-dimensional study of the brain's ventricular system with teaching purposes. It values the morphology of this complex brain structure, as a whole and in any spatial position, being able to compare it with pathological studies, where its anatomy visibly changes. 3D Slicer was also used to obtain volumetric measurements in order to provide a more comprehensive and detail representation of the ventricular system. We assess the potential this software has for processing high resolution images, taken from Magnetic Resonance and generate the three-dimensional reconstruction of ventricular system. |
Evaluating the Utility of "3D Slicer" as a Fast and Independent Tool to Assess Intrafractional Organ Dose Variations in Gynecological Brachytherapy
|
Publication: Brachytherapy. 2016 May 12. PMID: 27180127 Authors: Siavashpour Z, Aghamiri MR, Jaberi R, Dehghan-Manshadi HR, Sedaghat M, Kirisits C. Institution: Department of Medical Radiation Engineering, Shahid Beheshti University, Tehran, Iran. Background/Purpose: To demonstrate the utility of 3D Slicer for easy treatment verification by comparing dose-volume histograms (DVHs) calculated on pretreatment and posttreatment images. METHODS AND MATERIALS: Thirty cervical cancer patients were CT scanned twice: first for treatment planning and a second time after the dose delivery. The initial plan was manually duplicated on the posttreatment image set in Flexiplan treatment planning system, and DVH parameters were calculated. Pretreatment and posttreatment images, organ structures, and plan data were exported from the treatment planning system to 3D Slicer to validate DVH parameter calculation with 3D Slicer. The gamma analysis was used to compare Flexiplan and 3D Slicer DVHs. Posttreatment images were rigidly fused on the initial CT to automatically transfer the data of the pretreatment plan onto the posttreatment images. DVH parameters were calculated in 3D Slicer for both image sets, and their relative variations were compared. RESULTS: In calculating DVH parameter variations, no significant differences were observed between Flexiplan and 3D Slicer. Where the registration accuracy was better than 0.03, they returned similar results for D2 cm3 of bladder, rectum, and sigmoid. Mean and standard deviation of DVH parameters were calculated on pretreatment and posttreatment images for several organs; both the manually duplicated plan and the automatically registered plan in SlicerRT returned comparable relative variations of these parameters. For 88% of the organs, more than 95% of the DVH dose bins passed the gamma analysis. CONCLUSIONS: We tested an automated DVH assessment method with an imaging freeware, 3D Slicer, for use in image-guided adaptive brachytherapy. SlicerRT is a viable verification tool to report and detect DVH variations between different contoured images series. |
Common 3-dimensional Coordinate System for Assessment of Directional Changes
|
Publication: Am J Orthod Dentofacial Orthop. 2016 May;149(5):645-56. PMID: 27131246 Authors: Ruellas AC, Tonello C, Gomes LR, Yatabe MS, Macron L, Lopinto J, Goncalves JR, Garib Carreira DG, Alonso N, Souki BQ, Coqueiro Rda S, Cevidanes LH. Institution: Federal University of Rio de Janeiro, Rio de Janeiro, Brazil. Background/Purpose: The aims of this study were to evaluate how head orientation interferes with the amounts of directional change in 3-dimensional (3D) space and to propose a method to obtain a common coordinate system using 3D surface models. METHODS: Three-dimensional volumetric label maps were built for pretreatment (T1) and posttreatment (T2) from cone-beam computed tomography images of 30 growing subjects. Seven landmarks were labeled in all T1 and T2 volumetric label maps. Registrations of T1 and T2 images relative to the cranial base were performed, and 3D surface models were generated. All T1 surface models were moved by orienting the Frankfort horizontal, midsagittal, and transporionic planes to match the axial, sagittal, and coronal planes, respectively, at a common coordinate system in the 3D Slicer software (open-source, version 4.3.1). The matrix generated for each T1 model was applied to each corresponding registered T2 surface model, obtaining a common head orientation. The 3D differences between the T1 and registered T2 models, and the amounts of directional change in each plane of the 3D space, were quantified for before and after head orientation. Two assessments were performed: (1) at 1 time point (mandibular width and length), and (2) for longitudinal changes (maxillary and mandibular differences). The differences between measurements before and after head orientation were quantified. Statistical analysis was performed by evaluating the means and standard deviations with paired t tests (mandibular width and length) and Wilcoxon tests (longitudinal changes). For 16 subjects, 2 observers working independently performed the head orientations twice with a 1-week interval between them. Intraclass correlation coefficients and the Bland-Altman method tested intraobserver and interobserver agreements of the x, y, and z coordinates for 7 landmarks. RESULTS: The 3D differences were not affected by the head orientation. The amounts of directional change in each plane of 3D space at 1 time point were strongly influenced by head orientation. The longitudinal changes in each plane of 3D space showed differences smaller than 0.5 mm. Excellent intraobserver and interobserver repeatability and reproducibility (>99%) were observed. CONCLUSIONS: The amount of directional change in each plane of 3D space is strongly influenced by head orientation. The proposed method of head orientation to obtain a common 3D coordinate system is reproducible. |
3D Printing and 3D Slicer - Powerful Tools in Understanding and Treating Structural Lung Disease
|
Publication: Chest. 2016 May;149(5):1136-42. PMID: 26976347. Authors: Cheng GZ, Jose Estepar RS, Folch E, Onieva JO, Gangadharan S, Majid A Institution: Division of Thoracic Surgery and Interventional Pulmonology, Beth Israel Deaconess Medical Center, Harvard Medical School, Boston, MA, USA. Background/Purpose: Recent advances in 3D printing industry has enabled clinicians to explore the use of 3D printing in pre-procedural planning, biomedical tissue modeling, and direct implantable device manufacturing. Despite the increase adoption of rapid prototyping and additive manufacturing techniques in the healthcare field, many physicians lack the technical skillset to utilize this exciting and useful technology. Additionally, the growth in the 3D printing sector brings an ever-increasing number of 3D printers and printable materials. Therefore, it is important for clinicians to keep abreast with this rapidly developing field in order to stand to benefit. In this Ahead of the Curve, we review the history of 3D printing from its inception to most recent biomedical applications. Additionally, we will address some of the major barriers to wider adoption of the technology in medical field. Finally, we will provide an initial guide on 3D modeling and printing by demonstrating how to design personalized airway prosthesis via 3D Slicer3D Slicer. We hope this will reduce the barrier to utilization and increase clinician participation in the 3D printing healthcare sector. |
STN-DBS Reduces Saccadic Hypometria but Not Visuospatial Bias in Parkinson's Disease Patients
|
Publication: Front Behav Neurosci. 2016 May 3;10:85. PMID: 27199693. | PDF Authors: Fischer P, Ossandón JP, Keyser J, Gulberti A, Wilming N, Hamel W, Köppen J, Buhmann C, Westphal M, Gerloff C, Moll CK, Engel AK, König P. Institution: nstitute of Cognitive Science, University of OsnabrückOsnabrück, Germany; Medical Research Council Brain Network Dynamics Unit, University of OxfordOxford, UK. Background/Purpose: In contrast to its well-established role in alleviating skeleto-motor symptoms in Parkinson's disease, little is known about the impact of deep brain stimulation (DBS) of the subthalamic nucleus (STN) on oculomotor control and attention. Eye-tracking data of 17 patients with left-hemibody symptom onset was compared with 17 age-matched control subjects. Free-viewing of natural images was assessed without stimulation as baseline and during bilateral DBS. To examine the involvement of ventral STN territories in oculomotion and spatial attention, we employed unilateral stimulation via the left and right ventralmost contacts respectively. When DBS was off, patients showed shorter saccades and a rightward viewing bias compared with controls. Bilateral stimulation in therapeutic settings improved saccadic hypometria but not the visuospatial bias. At a group level, unilateral ventral stimulation yielded no consistent effects. However, the evaluation of electrode position within normalized MNI coordinate space revealed that the extent of early exploration bias correlated with the precise stimulation site within the left subthalamic area. These results suggest that oculomotor impairments "but not higher-level exploration patterns" are effectively ameliorable by DBS in therapeutic settings. Our findings highlight the relevance of the STN topography in selecting contacts for chronic stimulation especially upon appearance of visuospatial attention deficits. |
Low-cost Interactive Image-based Virtual Endoscopy for the Diagnosis and Surgical Planning of Suprasellar Arachnoid Cysts
|
Publication: World Neurosurg. 2016 Apr;88:76-82. PMID: 26732948
Institution: Department of Neurosurgery, People's Liberation Army General Hospital, Beijing, China. Background/Purpose: OBJECTIVE: To investigate the feasibility and reliability of virtual endoscopy (VE) as a rapid, low-cost and interactive tool for suprasellar arachnoid cysts (SACs) diagnosis and surgical planning. Methods: 18 SACs patients treated with endoscopic ventriculocystostomy were recruited, and same number of endoscopic third ventriculostomy treated patients was randomly selected as VE reconstruction control group. After loading their DICOM data into free software 3D Slicer, VE reconstruction was independently performed by 3 blinded clinicians and the time required for each reconstruction was recorded. Other 3 blinded senior neurosurgeons interactively graded the visibility of VE by watching video recordings of endoscopic procedures. Based on the visibility scores, Receiver Operating Characteristic (ROC) curve analysis was used to investigate the reliability of VE to diagnose SACs, and the Bland-Altman plot was employed to assess the VE's reliability for surgical planning. In addition, intra-class correlation coefficient (ICC) was calculated to estimate the consistency among the results of 3 reconstructing performers. Results: All 3 independent reconstructing performers successfully completed VE simulation for all cases, and the average reconstructing time was 10.2±9.7 minutes. The area under ROC curve of cyst's visibility score was 0.96, implying its diagnostic value of SACs. Bland-Altman plot indicated good agreement between VE and intraoperative viewings, suggesting the VE's anatomical accuracy for surgical planning. In addition, ICC was 0.81, which revealed excellent inter-performer consistency of our simulation method. Conclusion: This study substantiated the feasibility and reliability of VE as a rapid, low-cost and interactive modality for SACs diagnosis and surgical planning. |
|
Publication: Int J Comput Assist Radiol Surg. 2016 Mar;11(3):473-81. PMID: 26183148 Authors: De Momi E, Ferrigno G, Bosoni G, Bassanini P, Blasi P, Casaceli G, Fuschillo D, Castana L, Cossu M, Lo Russo G, Cardinale F. Institution: Department of Electronics, Information and Bioengineering (DEIB), Politecnico di Milano, Milan, Italy. Background/Purpose: Image guidance is widely used in neurosurgery. Tracking systems (neuronavigators) allow registering the preoperative image space to the surgical space. The localization accuracy is influenced by technical and clinical factors, such as brain shift. This paper aims at providing quantitative measure of the time-varying brain shift during open epilepsy surgery, and at measuring the pattern of brain deformation with respect to three potentially meaningful parameters: craniotomy area, craniotomy orientation and gravity vector direction in the images reference frame. Methods: We integrated an image-guided surgery system with 3D Slicer, an open-source package freely available in the Internet. We identified the preoperative position of several cortical features in the image space of 12 patients, inspecting both the multiplanar and the 3D reconstructions. We subsequently repeatedly tracked their position in the surgical space. Therefore, we measured the cortical shift, following its time-related changes and estimating its correlation with gravity and craniotomy normal directions. Results: The mean of the median brain shift amount is 9.64 mm ([Formula: see text] mm). The brain shift amount resulted not correlated with respect to the gravity direction, the craniotomy normal, the angle between the gravity and the craniotomy normal and the craniotomy area. Conclusions:Our method, which relies on cortex surface 3D measurements, gave results, which are consistent with literature. Our measurements are useful for the neurosurgeon, since they provide a continuous monitoring of the intra-operative sinking or bulking of the brain, giving an estimate of the preoperative images validity versus time. |
Deformable Image Registration with a Featurelet Algorithm: Implementation as a 3D Slicer Extension and Validation
|
Publication: Proc. SPIE 9784, Medical Imaging 2016 Mar; Image Processing, 97844B. Authors: Renner A, Furtado H, Seppenwoolde Y, Birkfellner W, Georg D. Institution: Medical University, Vienna, Austria. Background/Purpose: A radiotherapy (RT) treatment can last for several weeks. In that time organ motion and shape changes introduce uncertainty in dose application. Monitoring and quantifying the change can yield a more precise irradiation margin definition and thereby reduce dose delivery to healthy tissue and adjust tumor targeting. Deformable image registration (DIR) has the potential to fulfill this task by calculating a deformation field (DF) between a planning CT and a repeated CT of the altered anatomy. Application of the DF on the original contours yields new contours that can be used for an adapted treatment plan. DIR is a challenging method and therefore needs careful user interaction. Without a proper graphical user interface (GUI) a misregistration cannot be easily detected by visual inspection and the results cannot be fine-tuned by changing registration parameters. To provide a DIR algorithm with such a GUI available for everyone, we created the extension Featurelet-Registration for the open source software platform 3D Slicer. The registration logic is an upgrade of an in-house-developed DIR method, which is a featurelet-based piecewise rigid registration. The so called "featurelets" are equally sized rectangular subvolumes of the moving image which are rigidly registered to rectangular search regions on the fixed image. The output is a deformed image and a deformation field. Both can be visualized directly in 3D Slicer facilitating the interpretation and quantification of the results. For validation of the registration accuracy two deformable phantoms were used. The performance was benchmarked against a demons algorithm with comparable results. © (2016) COPYRIGHT Society of Photo-Optical Instrumentation Engineers (SPIE). Downloading of the abstract is permitted for personal use only. |
|
Publication: Proc. SPIE 9786, Medical Imaging 2016 Mar; Image-Guided Procedures, Robotic Interventions, and Modeling, 97860Y Authors: Heffernan E, Ungi T, Vaughan T, Pezeshki P, Lasso A, Gauvin G, Rudan J, Engel CJ, Morin E, Fichtinger G. Institution: Queen's University, Kingston, Canada. Background/Purpose: An electromagnetic navigation system for tumor excision in breast conserving surgery has recently been developed. Preoperatively, a hooked needle is positioned in the tumor and the tumor boundaries are defined in the needle coordinate system. The needle is tracked electromagnetically throughout the procedure to localize the tumor. However, the needle may move and the tissue may deform, leading to errors in maintaining a correct excision boundary. It is imperative to quantify these errors so the surgeon can choose an appropriate resection margin. METHODS: A commercial breast biopsy phantom with several inclusions was used. Location and shape of a lesion before and after mechanical deformation were determined using 3D ultrasound volumes. Tumor location and shape were estimated from initial contours and tracking data. The difference in estimated and actual location and shape of the lesion after deformation was quantified using the Hausdorff distance. Data collection and analysis were done using our 3D Slicer software application and PLUS toolkit. RESULTS: The deformation of the breast resulted in 3.72 mm (STD 0.67 mm) average boundary displacement for an isoelastic lesion and 3.88 mm (STD 0.43 mm) for a hyperelastic lesion. The difference between the actual and estimated tracked tumor boundary was 0.88 mm (STD 0.20 mm) for the isoelastic and 1.78 mm (STD 0.18 mm) for the hyperelastic lesion. CONCLUSION: The average lesion boundary tracking error was below 2mm, which is clinically acceptable. We suspect that stiffness of the phantom tissue affected the error measurements. Results will be validated in patient studies. © (2016) COPYRIGHT Society of Photo-Optical Instrumentation Engineers (SPIE). Downloading of the abstract is permitted for personal use only. |
Effects of Voxelization on Dose Volume Histogram Accuracy
|
Publication: Proc. SPIE 9786, Medical Imaging 2016 Mar; Image-Guided Procedures, Robotic Interventions, and Modeling, 97862O. Authors: Sunderland K, Pinter C, Lasso A, Fichtinger G. Institution: Queen's University, Kingston, Canada. Background/Purpose: In radiotherapy treatment planning systems, structures of interest such as targets and organs at risk are stored as 2D contours on evenly spaced planes. In order to be used in various algorithms, contours must be converted into binary labelmap volumes using voxelization. The voxelization process results in lost information, which has little effect on the volume of large structures, but has significant impact on small structures, which contain few voxels. Volume differences for segmented structures affects metrics such as dose volume histograms (DVH), which are used for treatment planning. Our goal is to evaluate the impact of voxelization on segmented structures, as well as how factors like voxel size affects metrics, such as DVH. METHODS: We create a series of implicit functions, which represent simulated structures. These structures are sampled at varying resolutions, and compared to labelmaps with high sub-millimeter resolutions. We generate DVH and evaluate voxelization error for the same structures at different resolutions by calculating the agreement acceptance percentage between the DVH. RESULTS: We implemented tools for analysis as modules in the SlicerRT toolkit based on the 3D Slicer platform. We found that there were large DVH variation from the baseline for small structures or for structures located in regions with a high dose gradient, potentially leading to the creation of suboptimal treatment plans. CONCLUSION: This work demonstrates that labelmap and dose volume voxel size is an important factor in DVH accuracy, which must be accounted for in order to ensure the development of accurate treatment plans. |
Extracted Magnetic Resonance Texture Features Discriminate between Phenotypes and are Associated with Overall Survival in Glioblastoma Multiforme Patients
|
Publication: Med Biol Eng Comput. 2016 Mar 10. PMID: 26960324 Authors: Chaddad A, Tanougast C. Institution: Laboratory of Design, Optimization and Modeling (LCOMS), University of Lorraine, 7 rue marconi, Metz, 57070, France. Background/Purpose: GBM is a markedly heterogeneous brain tumor consisting of three main volumetric phenotypes identifiable on magnetic resonance imaging: necrosis (vN), active tumor (vAT), and edema/invasion (vE). The goal of this study is to identify the three glioblastoma multiforme (GBM) phenotypes using a texture-based gray-level co-occurrence matrix (GLCM) approach and determine whether the texture features of phenotypes are related to patient survival. MR imaging data in 40 GBM patients were analyzed. Phenotypes vN, vAT, and vE were segmented in a preprocessing step using 3D Slicer for rigid registration by T1-weighted imaging and corresponding fluid attenuation inversion recovery images. The GBM phenotypes were segmented using 3D Slicer tools. Texture features were extracted from GLCM of GBM phenotypes. Thereafter, Kruskal-Wallis test was employed to select the significant features. Robust predictive GBM features were identified and underwent numerous classifier analyses to distinguish phenotypes. Kaplan-Meier analysis was also performed to determine the relationship, if any, between phenotype texture features and survival rate. The simulation results showed that the 22 texture features were significant with p value <0.05. GBM phenotype discrimination based on texture features showed the best accuracy, sensitivity, and specificity of 79.31, 91.67, and 98.75 %, respectively. Three texture features derived from active tumor parts: difference entropy, information measure of correlation, and inverse difference were statistically significant in the prediction of survival, with log-rank p values of 0.001, 0.001, and 0.008, respectively. Among 22 features examined, three texture features have the ability to predict overall survival for GBM patients demonstrating the utility of GLCM analyses in both the diagnosis and prognosis of this patient population. |
Real-time Self-calibration of a Tracked Augmented Reality Display
|
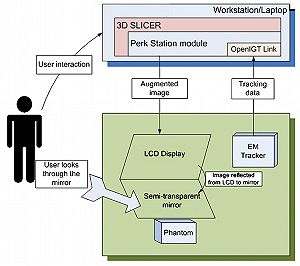
Publication: Proc. SPIE 9786, Medical Imaging 2016 Mar; Image-Guided Procedures, Robotic Interventions, and Modeling, 97860F. Authors: Baum Z, Lasso A, Ungi T, Fichtinger G. Institution: Laboratory for Percutaneous Surgery, Queen's University, Kingston, Canada. Background/Purpose: Augmented reality systems have been proposed for image-guided needle interventions but they have not become widely used in clinical practice due to restrictions such as limited portability, low display refresh rates, and tedious calibration procedures. We propose a handheld tablet-based self-calibrating image overlay system. METHODS: A modular handheld augmented reality viewbox was constructed from a tablet computer and a semi-transparent mirror. A consistent and precise self-calibration method, without the use of any temporary markers, was designed to achieve an accurate calibration of the system. Markers attached to the viewbox and patient are simultaneously tracked using an optical pose tracker to report the position of the patient with respect to a displayed image plane that is visualized in real-time. The software was built using the open-source 3D Slicer application platform's SlicerIGT extension and the PLUS toolkit. RESULTS: The accuracy of the image overlay with image-guided needle interventions yielded a mean absolute position error of 0.99 mm (95th percentile 1.93 mm) in-plane of the overlay and a mean absolute position error of 0.61 mm (95th percentile 1.19 mm) out-of-plane. This accuracy is clinically acceptable for tool guidance during various procedures, such as musculoskeletal injections. CONCLUSION: A self-calibration method was developed and evaluated for a tracked augmented reality display. The results show potential for the use of handheld image overlays in clinical studies with image-guided needle interventions. |
Accuracy of Open-Source Software Segmentation and Paper-based Printed Three-Dimensional Models
|
Publication: J Craniomaxillofac Surg. 2016 Feb;44(2):202-9. PMID: 26748414 Authors: Szymor P, Kozakiewicz M, Olszewski R. Institution: Department of Maxillofacial Surgery, Medical University of Lodz, Lodz, Poland. Background/Purpose: In this study, we aimed to verify the accuracy of models created with the help of open-source 3D Slicer 3.6.3 software (Surgical Planning Lab, Harvard Medical School, Harvard University, Boston, MA, USA) and the Mcor Matrix 300 paper-based 3D printer. Our study focused on the accuracy of recreating the walls of the right orbit of a cadaveric skull. Cone beam computed tomography (CBCT) of the skull was performed (0.25-mm pixel size, 0.5-mm slice thickness). Acquired DICOM data were imported into 3D Slicer 3.6.3 software, where segmentation was performed. A virtual model was created and saved as an .STL file and imported into Netfabb Studio professional 4.9.5 software. Three different virtual models were created by cutting the original file along three different planes (coronal, sagittal, and axial). All models were printed with a Selective Deposition Lamination Technology Matrix 300 3D printer using 80 gsm A4 paper. The models were printed so that their cutting plane was parallel to the paper sheets creating the model. Each model (coronal, sagittal, and axial) consisted of three separate parts (∼200 sheets of paper each) that were glued together to form a final model. The skull and created models were scanned with a three-dimensional (3D) optical scanner (Breuckmann smart SCAN) and were saved as .STL files. Comparisons of the orbital walls of the skull, the virtual model, and each of the three paper models were carried out with GOM Inspect 7.5SR1 software. Deviations measured between the models analysed were presented in the form of a colour-labelled map and covered with an evenly distributed network of points automatically generated by the software. An average of 804.43 ± 19.39 points for each measurement was created. Differences measured in each point were exported as a .csv file. The results were statistically analysed using Statistica 10, with statistical significance set at p < 0.05. The average number of points created on models for each measurement was 804.43 ± 19.39; however, deviation in some of the generated points could not be calculated, and those points were excluded from further calculations. From 94% to 99% of the measured absolute deviations were <1 mm. The mean absolute deviation between the skull and virtual model was 0.15 ± 0.11 mm, between the virtual and printed models was 0.15 ± 0.12 mm, and between the skull and printed models was 0.24 ± 0.21 mm. Using the optical scanner and specialized inspection software for measurements of accuracy of the created parts is recommended, as it allows one not only to measure 2-dimensional distances between anatomical points but also to perform more clinically suitable comparisons of whole surfaces. However, it requires specialized software and a very accurate scanner in order to be useful. Threshold-based, manually corrected segmentation of orbital walls performed with 3D Slicer software is accurate enough to be used for creating a virtual model of the orbit. The accuracy of the paper-based Mcor Matrix 300 3D printer is comparable to those of other commonly used 3-dimensional printers and allows one to create precise anatomical models for clinical use. The method of dividing the model into smaller parts and sticking them together seems to be quite accurate, although we recommend it only for creating small, solid models with as few parts as possible to minimize shift associated with gluing. |
Multi Texture Analysis of Colorectal Cancer Continuum Using Multispectral Imagery
|
Publication: PLoS One. 2016 Feb 22;11(2):e0149893. PMID: 26901134 | PDF Authors: Chaddad A, Desrosiers C, Bouridane A, Toews M, Hassan L, Tanougast C. Institution: Laboratory for Imagery, Vision and Artificial Intelligence, Ecole de Technologie Superieure, Montreal, Quebec, Canada. Background/Purpose: This paper proposes to characterize the continuum of colorectal cancer (CRC) using multiple texture features extracted from multispectral optical microscopy images. Three types of pathological tissues (PT) are considered: benign hyperplasia, intraepithelial neoplasia and carcinoma. MATERIALS AND METHODS: In the proposed approach, the region of interest containing PT is first extracted from multispectral images using active contour segmentation. This region is then encoded using texture features based on the Laplacian-of-Gaussian (LoG) filter, discrete wavelets (DW) and gray level co-occurrence matrices (GLCM). To assess the significance of textural differences between PT types, a statistical analysis based on the Kruskal-Wallis test is performed. The usefulness of texture features is then evaluated quantitatively in terms of their ability to predict PT types using various classifier models. RESULTS: Preliminary results show significant texture differences between PT types, for all texture features (p-value < 0.01). Individually, GLCM texture features outperform LoG and DW features in terms of PT type prediction. However, a higher performance can be achieved by combining all texture features, resulting in a mean classification accuracy of 98.92%, sensitivity of 98.12%, and specificity of 99.67%. CONCLUSIONS: These results demonstrate the efficiency and effectiveness of combining multiple texture features for characterizing the continuum of CRC and discriminating between pathological tissues in multispectral images. |
 Examples of ground truth segmentation. (a) Original image. (b) Segmented image. (c) Labeled image. Labeled area in (c) corresponds to the ROI used for texture feature extraction.Ground truth segmentations, one segmentation per sample, were obtained manually using 3D Slicer. |
Cranial Anatomy and Palaeoneurology of the Archosaur Riojasuchus tenuisceps from the Los Colorados Formation, La Rioja, Argentina
|
Publication: PLoS One. 2016 Feb 5;11(2):e0148575. PMID: 26849433 | PDF Authors: von Baczko MB, Desojo JB. Institution: Consejo Nacional de Investigaciones Científicas y Técnicas (CONICET), Ciudad Autónoma de Buenos Aires, Buenos Aires, Argentina. Background/Purpose: Riojasuchus tenuisceps Bonaparte 1967 is currently known from four specimens, including two complete skulls, collected in the late 1960s from the upper levels of the Los Colorados Formation (Late Triassic), La Rioja, Argentina. Computed tomography (CT) scans of the skulls of the holotype and a referred specimen of Riojasuchus tenuisceps and the repreparation of the latter allows recognition of new features for a detailed analysis of its cranial anatomy and its comparison with a wide variety of other archosauriform taxa. The diagnosis of Riojasuchus tenuisceps is emended and two autapomorphies are identified on the skull: (1) a deep antorbital fossa with its anterior and ventral edges almost coinciding with the same edges of the maxilla itself and (2) a suborbital fenestra equal in size to the palatine-pterygoid fenestra. Also, the first digital 3D reconstruction of the encephalon of Riojasuchus tenuisceps was carried out to study its neuroanatomy, showing a shape and cranial nerve disposition consistent to that of other pseudosuchians. |
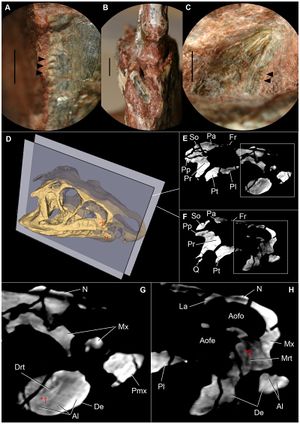 Details of dentition of Riojasuchus tenuisceps. (A) lateral detail of denticles on distal margin of maxillary tooth (PVL 3828); (B) anterior view of first dentary tooth (PVL 3827) broken at its base; (C) medial view of posterior dentary tooth (PVL 3828) with denticles on distal margin; (D) 3D reconstruction of the skull of PVL 3827 indicating selected slices; (E-F) selected slices of PVL 3827; (G) detail of slide E indicating a maxillary replacement tooth (Mrt) erupting; (H) detail of slide F pointing out a dentary replancement tooth (Drt); *1 and *2 indicate the position of each replacement tooth on the skull. Arrowheads point at denticles. Abbreviations: Al, alveoli; Aofe, antorbital fenestra; Aofo, antorbital fossa; De, dentary, Drt, dentary replacement tooth; Fr, frontal; N, nasal; Mrt, maxillary replacement tooth; Mx, maxilla; Pa, parietal; Pl, palatine; Pmx, premaxilla; Pp, paroccipital process; Pr, prootic; Pt, pterygoid; Q, quadrate; So, supraoccipital. Scale bar: 2mm. For the analysis of the CT images and 3D reconstruction, we used the open source software 3D Slicer v4.1.1. |
Diffusion Tensor Imaging Assessment of Microstructural Brainstem Integrity in Chiari Malformation Type I.
|
Publication: J Neurosurg. 2016 Feb 5:1-8. PMID: 26848913 | PDF Authors: Krishna V, Sammartino F, Yee P, Mikulis D, Walker M, Elias G, Hodaie M. Institution: Department of Neurosurgery, Ohio State University, Columbus, Ohio. Background/Purpose: OBJECTIVE The diagnosis of Chiari malformation Type I (CM-I) is primarily based on the degree of cerebellar tonsillar herniation even though it does not always correlate with symptoms. Neurological dysfunction in CM-I presumably results from brainstem compression. With the premise that conventional MRI does not reveal brain microstructural changes, this study examined both structural and microstructural neuroimaging metrics to distinguish patients with CM-I from age- and sex-matched healthy control subjects. METHODS Eight patients with CM-I and 16 controls were analyzed. Image postprocessing involved coregistration of anatomical T1-weighted with diffusion tensor images using 3D Slicer software. The structural parameters included volumes of the posterior fossa, fourth ventricle, and tentorial angle. Fractional anisotropy (FA) was calculated separately in the anterior and posterior compartments of the lower brainstem. RESULTS The mean age of patients in the CM-I cohort was 42.6 ± 10.4 years with mean tonsillar herniation of 12 mm (SD 0.7 mm). There were no significant differences in the posterior fossa volume (p = 0.06) or fourth ventricular volume between the 2 groups (p = 0.11). However, the FA in the anterior brainstem compartment was significantly higher in patients with CM-I preoperatively (p = 0.001). The FA values normalized after Chiari decompression except for persistently elevated FA in the posterior brainstem compartment in patients with CM-I and syrinx. CONCLUSIONS In this case-control study, microstructural alterations appear to be reliably associated with the diagnosis of CM-I, with a significantly elevated FA in the lower brainstem in patients with CM-I compared with controls. More importantly, the FA values normalized after decompressive surgery. These findings should be validated in future studies to determine the significance of diffusion tensor imaging-based assessment of brainstem microstructural integrity as an adjunct to the clinical assessment in patients with CM-I. |
Large Area 3-D Optical Coherence Tomography Imaging of Lumpectomy Specimens for Radiation Treatment Planning
|
Publication: Proc. SPIE 9689 2016 Feb; Photonic Therapeutics and Diagnostics XII, 968946. Authors: Wang C, Kim L, Barnard N, Khan A, Pierce MC. Institution: Rutgers, The State University of New Jersey NJ, USA. Background/Purpose: Our long term goal is to develop a high-resolution imaging method for comprehensive assessment of tissue removed during lumpectomy procedures. By identifying regions of high-grade disease within the excised specimen, we aim to develop patient-specific post-operative radiation treatment regimens. We have assembled a benchtop spectral-domain optical coherence tomography (SD-OCT) system with 1320 nm center wavelength. Automated beam scanning enables “sub-volumes” spanning 5 mm x 5 mm x 2 mm (500 A-lines x 500 B-scans x 2 mm in depth) to be collected in under 15 seconds. A motorized sample positioning stage enables multiple sub-volumes to be acquired across an entire tissue specimen. Sub-volumes are rendered from individual B-scans in 3D Slicer software and en face (XY) images are extracted at specific depths. These images are then tiled together using MosaicJ software to produce a large area en face view (up to 40 mm x 25 mm). After OCT imaging, specimens were sectioned and stained with HE, allowing comparison between OCT image features and disease markers on histopathology. This manuscript describes the technical aspects of image acquisition and reconstruction, and reports initial qualitative comparison between large area en face OCT images and HE stained tissue sections. Future goals include developing image reconstruction algorithms for mapping an entire sample, and registering OCT image volumes with clinical CT and MRI images for post-operative treatment planning. © (2016) COPYRIGHT Society of Photo-Optical Instrumentation Engineers (SPIE). Downloading of the abstract is permitted for personal use only. |
Development and Evaluation of an Open-Source 3D Virtual Simulator with Integrated Motion-Tracking as a Teaching Tool for Pedicle Screw Insertion
|
Publication: Orthopaedic Proceedings 2016 Feb; 98:Supp.5-16. Authors: Mclachlin S, Polley B, Beig M, Larouche J, Whyne C. Institution: Sunnybrook Research Institute (SRI), University of Toronto, Canada. Background/Purpose: Simulation is an effective adjunct to the traditional surgical curriculum, though access to these technologies is often limited and costly. The objectives of this work were to develop a freely accessible virtual pedicle screw simulator and to improve the clinical authenticity of the simulator through integration of low-cost motion tracking. The open-source medical imaging and visualisation software, 3D Slicer, was used as the development platform for the virtual simulation. 3D Slicer contains many features for quickly rendering and transforming 3D models of the bony spine anatomy from patient-specific CT scans. A step-wise pedicle screw insertion workflow module was developed which emulated typical pre-operative planning steps. This included taking anatomic measurements, identifying insertion landmarks, and choosing appropriate screw sizes. Monitoring of the surgeon's simulated tool was assessed with a low-cost motion tracking sensor in real-time. This allowed for the surgeon's physical motions to be tracked as they defined the virtual screw's insertion point and trajectory on the rendered anatomy. Screw insertion was evaluated based on bone density contact and cortical breaches. Initial surgeon feedback of the virtual simulator with integrated motion tracking was positive, with no noticeable lag and high accuracy between the real-world and virtual environments. The software yields high fidelity 3D visualisation of the complex geometry and the tracking enabled coordination of motion to small changes in both translational and angular positioning. Future work will evaluate the benefit of this simulation platform with use over the course of resident spine rotations to improve planning and surgical competency. |
Effect of Decompressive Craniectomy on Perihematomal Edema in Patients with Intracerebral Hemorrhage
|
Publication: PLoS One. 2016 Feb 12;11(2):e0149169. PMID: 26872068 | PDF Authors: Fung C, Murek M, Klinger-Gratz PP, Fiechter M, Z'Graggen WJ, Gautschi OP, El-Koussy M, Gralla J, Schaller K, Zbinden M, Arnold M, Fischer U, Mattle HP, Raabe A, Beck J. Institution: Department of Neurosurgery, University Hospital Bern, Bern, Switzerland. Background/Purpose: BACKGROUND: Perihematomal edema contributes to secondary brain injury in the course of intracerebral hemorrhage. The effect of decompressive surgery on perihematomal edema after intracerebral hemorrhage is unknown. This study analyzed the course of PHE in patients who were or were not treated with decompressive craniectomy. METHODS: More than 100 computed tomography images from our published cohort of 25 patients were evaluated retrospectively at two university hospitals in Switzerland. Computed tomography scans covered the time from admission until day 100. Eleven patients were treated by decompressive craniectomy and 14 were treated conservatively. Absolute edema and hematoma volumes were assessed using 3-dimensional volumetric measurements. Relative edema volumes were calculated based on maximal hematoma volume. RESULTS: Absolute perihematomal edema increased from 42.9 ml to 125.6 ml (192.8%) after 21 days in the decompressive craniectomy group, versus 50.4 ml to 67.2 ml (33.3%) in the control group (Δ at day 21 = 58.4 ml, p = 0.031). Peak edema developed on days 25 and 35 in patients with decompressive craniectomy and controls respectively, and it took about 60 days for the edema to decline to baseline in both groups. Eight patients (73%) in the decompressive craniectomy group and 6 patients (43%) in the control group had a good outcome (modified Rankin Scale score 0 to 4) at 6 months (P = 0.23). CONCLUSIONS: Decompressive craniectomy is associated with a significant increase in perihematomal edema compared to patients who have been treated conservatively. Perihematomal edema itself lasts about 60 days if it is not treated, but decompressive craniectomy ameliorates the mass effect exerted by the intracerebral hemorrhage plus the perihematomal edema, as reflected by the reduced midline shift. |
Current Smoking Status Is Associated with Lower Quantitative CT Measures of Emphysema and Gas Trapping
|
Publication: J Thorac Imaging. 2016 Jan;31(1):29-36. PMID: 26429588| PDF Authors: Zach JA, Williams A, Jou SS, Yagihashi K, Everett D, Hokanson JE, Stinson D, Lynch DA, COPDGene Investigators. Institution: Divisions of Radiology, Biostatistics and Bioinformatics, National Jewish Health, Denver, CO, USA. Background/Purpose: The purposes of this study were to evaluate the effect of smoking status on quantitative computed tomography CT measures of low-attenuation areas (LAAs) on inspiratory and expiratory CT and to provide a method of adjusting for this effect. Materials and Methods: A total of 6762 current and former smokers underwent spirometry and volumetric inspiratory and expiratory CT. Quantitative CT analysis was completed using open-source 3D Slicer software. Funding:
|
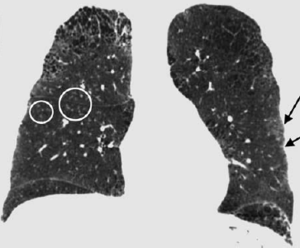 Examples of CN on CT. Coronal CT image of a GOLD 1 subject with moderately extensive visual extent of emphysema. However, the quantitative emphysema score was only 5.1%. The emphysema may have been masked on quantitative assessment by the presence of centrilobular nodules (circled) and patchy ground-glass abnormality (arrows). |
A Proposed Method for Accurate 3D Analysis of Cochlear Implant Migration Using Fusion of Cone Beam CT
|
Publication: Front Surg. 2016 Jan 25;3:2. PMID: 26901134 | PDF Authors: Dees G, van Hoof M, Stokroos R. Institution: Department of Otorhinolaryngology and Head and Neck Surgery, Maastricht University Medical Center, Maastricht, The Netherlands. Background/Purpose: The goal of this investigation was to compare fusion of sequential cone beam computerized tomography (CT) volumes to the gold standard (fiducial registration) in order to be able to analyze clinical cochlear implant (CI) migration with high accuracy in three dimensions. MATERIALS AND METHODS: Paired cone beam CT volumes were performed on five human cadaver temporal bones and one human subject. These volumes were fused using 3D Slicer 4 and BRAINSFit software. Using a gold standard fiducial technique, the accuracy, robustness, and performance time of the fusion process were assessed. RESULTS: This proposed fusion protocol achieves a subvoxel median Euclidean distance of 0.05 mm in human cadaver temporal bones and 0.16 mm (mean) when applied to the described in vivo human synthetic data set in over 95% of all fusions. Performance times are <2 min. CONCLUSION: Here, a new and validated method based on existing techniques is described, which could be used to accurately quantify migration of CI electrodes. |
 Human cadaver temporal bone. Axial fused images of a human cadaver temporal bone. (A) No registration. (B) Fiducial registration. (C) BRAINSFit registration. Notice the discernible overlapping borders when no registration is applied. The arrows indicate a fiducial marker. Image analysis, registration, and visualization are performed using the open source 3D Slicer 4 package, including the BRAINS software package. |
Boolean Combinations of Implicit Functions for Model Clipping in Computer-Assisted Surgical Planning
|
Publication: PLoS One. 2016 Jan 11;11(1):e0145987. PMID: 26751685 | PDF Authors: Zhan Q, Chen X. Institution: School of Mechanical Engineering, Shanghai Jiao Tong University, Shanghai, China. Background/Purpose: This paper proposes an interactive method of model clipping for computer-assisted surgical planning. The model is separated by a data filter that is defined by the implicit function of the clipping path. Being interactive to surgeons, the clipping path that is composed of the plane widgets can be manually repositioned along the desirable presurgical path, which means that surgeons can produce any accurate shape of the clipped model. The implicit function is acquired through a recursive algorithm based on the Boolean combinations (including Boolean union and Boolean intersection) of a series of plane widgets' implicit functions. The algorithm is evaluated as highly efficient because the best time performance of the algorithm is linear, which applies to most of the cases in the computer-assisted surgical planning. Based on the above stated algorithm, a user-friendly module named SmartModelClip is developed on the basis of 3D Slicer platform and VTK. A number of arbitrary clipping paths have been tested. Experimental results of presurgical planning for three types of Le Fort fractures and for tumor removal demonstrate the high reliability and efficiency of our recursive algorithm and robustness of the module. Funding:
|
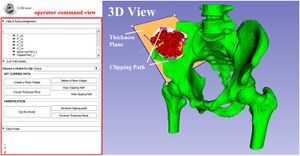 A snapshot of the module SmartModelClip in 3D Slicer. On the left is the operator command view that users can create and manipulate clipping path and thickness plane(i.e., they can create, hide and delete plane widgets). Users can also reverse the directions of the axes of the both clipping path and thickness plane widget. On the right is the scene that users can interact with the clipping path. They can specify the fiducial points that position the clipping path and modify the boundary of the clipping path by dragging the handles to obtain the desirable clipping path. |
Three-Dimensional Visualization of the Distribution of Melanin-Concentrating Hormone Producing Neurons in the Mouse Hypothalamus
|
Publication: J Chem Neuroanat. 2016 Jan;71:20-5. PMID: 26686291 Authors: Reinitz LZ, Szőke B, Várkonyi EÉ, Sótonyi P, Jancsik V. Institution: Faculty of Veterinary Science, Department of Anatomy and Histology, Szent István University, Budapest, Hungary. Background/Purpose: We present here a new procedure to represent the 3D distribution of neuronal cell bodies within the brain, using exclusively softwares free for research purposes. Our technique is based on digitalized photos of brain slices processed by immunohistochemical technique, and the 3D Slicer software. The technique presented enables transposition of immunohistochemical or in situ hybridization data to the stereotaxic mouse brain atlas (e.g. Paxinos, G., Franklin, K.B.J., 2001. The Mouse Brain in Stereotaxic Coordinates. second ed. Academic Press, San Diego). By exporting the finalized models into a popular 3D design software (3DS Max) arbitrary environment and motion simulation can be created to improve the visual understanding of the area studied. Application of this technique provides the possibility to store, analyze and compare data - e.g. on the hypothalamic neuropeptides - across experimental techniques and laboratories. The method is exemplified by visualizing the distribution of immunohistochemically identified melanin-concetrating hormone (MCH) containing perikarya within the mouse hypothalamus. |
In Vivo Visualization of the Facial Nerve in Patients with Acoustic Neuroma using Diffusion Tensor Imaging-Based Fiber Tracking
|
Publication: J Neurosurg. 2016 Jan 1:1-8. PMID: 26722859 | PDF Authors: Song F, Hou Y, Sun G, Chen X, Xu B, Huang JH, Zhang J. Institution: Department of Neurosurgery, People's Liberation Army General Hospital, Beijing, China. Background/Purpose: OBJECTIVE Preoperative determination of the facial nerve (FN) course is essential to preserving its function. Neither regular preoperative imaging examination nor intraoperative electrophysiological monitoring is able to determine the exact position of the FN. The diffusion tensor imaging-based fiber tracking (DTI-FT) technique has been widely used for the preoperative noninvasive visualization of the neural fasciculus in the white matter of brain. However, further studies are required to establish its role in the preoperative visualization of the FN in acoustic neuroma surgery. The object of this study is to evaluate the feasibility of using DTI-FT to visualize the FN. Methods Data from 15 patients with acoustic neuromas were collected using 3-T MRI. The visualized FN course and its position relative to the tumors were determined using DTI-FT with 3D Slicer software. The preoperative visualization results of FN tracking were verified using microscopic observation and electrophysiological monitoring during microsurgery. Results Preoperative visualization of the FN using DTI-FT was observed in 93.3% of the patients. However, in 92.9% of the patients, the FN visualization results were consistent with the actual surgery. CONCLUSIONS DTI-FT, in combination with intraoperative FN electrophysiological monitoring, demonstrated improved FN preservation in patients with acoustic neuroma. FN visualization mainly included the facial-vestibular nerve complex of the FN and vestibular nerve. |
Optic Nerve Tractography Prediction of Visual Deficit in Pituitary Macroadenoma
|
Publication: J Neurol Surg B 2016; 77-P060. Authors: Au K, Zadeh G. Institution: Toronto Western Hospital, University Health Network, Toronto, Ontario, Canada. Background/Purpose: The presentation of nonfunctioning pituitary adenomas is frequently delayed due to the absence of a hormonal syndrome, and tumors have often attained a large size by the time of diagnosis. Pronounced compression of the optic chiasm can be evident on imaging, and may be associated with deficits in visual acuity and visual fields. However, the severity of visual symptoms varies widely among patients, and some retain intact visual function despite dramatic optic chiasm deformation. MRI features including optic nerve atrophy and vertical tumor extension, and other modalities such as optical coherence tomography, have not been found to reliably predict visual deficits or recovery of visual function following pituitary tumor resection. Diffusion tensor imaging (DTI) utilizes the principle of anisotropic water diffusion along white matter fibers to reconstruct fiber tracts. Tractography has long been used to delineate large fiber bundles in glioma surgery, but the feasibility of tracking small fiber bundles including cranial nerves has also recently been demonstrated. The optic nerves, chiasm, optic tracts and optic radiations can be displayed to a high degree of detail using DTI. Since processes such as inflammation and demyelination affect water anisotropy, DTI parameters can detect pathologic changes in axonal properties. Patients with a new diagnosis of pituitary adenoma causing compression of the optic chiasm undergo neuro-opthalmologic evaluation including assessment of visual acuity and Humphrey visual field testing. Thin-slice imaging of the sellar region including T1-weighted anatomic imaging and diffusion-weighted imaging (DWI) scans are obtained on 3T MRI, and processed using 3D Slicer software. Neuro-opthalmologic and imaging evaluation are repeated post-operatively in patients who undergo surgical resection of the pituitary tumor. DTI parameters including fractional anisotropy, radial diffusivity and axial diffusivity are measured and correlated to visual findings. The ability to reliably correlate non-invasive imaging with visual function in the setting of optic chiasm compression may allow for accurate identification of patients who will develop visual deficits, and who therefore require more urgent surgical intervention. Such imaging may also be valuable in predicting recovery of visual function following decompressive surgery. |
2015
Patch-Based Segmentation with Spatial Consistency: Application to MS Lesions in Brain MRI
|
Publication: Int J Biomed Imaging. 2016 Jan;2016:7952541. PMID: 26904103 | PDF Authors: Mechrez R, Goldberger J, Greenspan H. Institution: Biomedical Engineering Department, Tel-Aviv University, Tel Aviv, Israel. Background/Purpose: his paper presents an automatic lesion segmentation method based on similarities between multichannel patches. A patch database is built using training images for which the label maps are known. For each patch in the testing image, k similar patches are retrieved from the database. The matching labels for these k patches are then combined to produce an initial segmentation map for the test case. Finally an iterative patch-based label refinement process based on the initial segmentation map is performed to ensure the spatial consistency of the detected lesions. The method was evaluated in experiments on multiple sclerosis (MS) lesion segmentation in magnetic resonance images (MRI) of the brain. An evaluation was done for each image in the MICCAI 2008 MS lesion segmentation challenge. Results are shown to compete with the state of the art in the challenge. We conclude that the proposed algorithm for segmentation of lesions provides a promising new approach for local segmentation and global detection in medical images. |
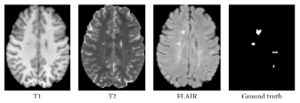 Three axial slices of MS lesions on MRI: FLAIR, T1w, T2w, and the associated ground truth lesion map. The preprocessing steps were carried out with using BrainSuite13, 3D Slicer, and MATLAB. |
MRI-Only Based Radiotherapy Treatment Planning for the Rat Brain on a Small Animal Radiation Research Platform (SARRP)
|
Publication: PLoS One. 2015 Dec 3;10(12):e0143821. PMID: 26633302 | PDF Authors: Gutierrez S, Descamps B, Vanhove C. Institution: Medical Image and Signal Processing Group, Ghent University-iMinds Medical IT department, Ghent, Belgium. Background/Purpose: Computed tomography (CT) is the standard imaging modality in radiation therapy treatment planning (RTP). However, magnetic resonance (MR) imaging provides superior soft tissue contrast, increasing the precision of target volume selection. We present MR-only based RTP for a rat brain on a small animal radiation research platform (SARRP) using probabilistic voxel classification with multiple MR sequences. Six rat heads were imaged, each with one CT and five MR sequences. The MR sequences were: T1-weighted, T2-weighted, zero-echo time (ZTE), and two ultra-short echo time sequences with 20 μs (UTE1) and 2 ms (UTE2) echo times. CT data were manually segmented into air, soft tissue, and bone to obtain the RTP reference. Bias field corrected MR images were automatically segmented into the same tissue classes using a fuzzy c-means segmentation algorithm with multiple images as input. Similarities between segmented CT and automatic segmented MR (ASMR) images were evaluated using Dice coefficient. Three ASMR images with high similarity index were used for further RTP. Three beam arrangements were investigated. Dose distributions were compared by analysing dose volume histograms. The highest Dice coefficients were obtained for the ZTE-UTE2 combination and for the T1-UTE1-T2 combination when ZTE was unavailable. Both combinations, along with UTE1-UTE2, often used to generate ASMR images, were used for further RTP. Using 1 beam, MR based RTP underestimated the dose to be delivered to the target (range: 1.4%-7.6%). When more complex beam configurations were used, the calculated dose using the ZTE-UTE2 combination was the most accurate, with 0.7% deviation from CT, compared to 0.8% for T1-UTE1-T2 and 1.7% for UTE1-UTE2. The presented MR-only based workflow for RTP on a SARRP enables both accurate organ delineation and dose calculations using multiple MR sequences. This method can be useful in longitudinal studies where CT's cumulative radiation dose might contribute to the total dose. |
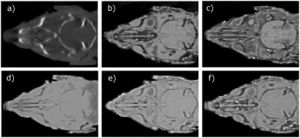 Illustration of a CB-CT and five MR images of the same animal. a) Coronal CB-CT image and (b)-(f) biased field corrected and masked coronal MR images using a T1-weighted (b), T2-weighted (c), ZTE (d), UTE1 (e) and UTE2 (f) sequence. All CB-CT images were first co-registered using 3D Slicer version 3.6.3 by rigid body transformations using normalized mutual information. |
Potential of Diffusion Tensor Imaging and Relaxometry for the Detection of Specific Pathological Alterations in Parkinson's Disease (PD)
|
Publication: PLoS One. 2015 Dec 29;10(12):e0145493. PMID: 26713760 | PDF Authors: Esterhammer R, Seppi K, Reiter E, Pinter B, Mueller C, Kremser C, Zitzelsberger T, Nocker M, Scherfler C, Poewe W, Schocke M. Institution: Department of Radiology, University Hospital, Innsbruck Medical University, Innsbruck, Austria. Background/Purpose: The purpose of the present study was to evaluate the potential of multimodal MR imaging including mean diffusivity (MD), fractional anisotropy (FA), relaxation rates R2 and R2* to detect disease specific alterations in Parkinson's Disease (PD). We enrolled 82 PD patients (PD-all) with varying disease durations (≤5 years: PD≤5, n = 43; >5 years: PD>5, n = 39) and 38 matched healthy controls (HC), receiving diffusion tensor imaging as well as R2 and R2* relaxometry calculated from multi-echo T2*-weighted and dual-echo TSE imaging, respectively. ROIs were drawn to delineate caudate nucleus (CN), putamen (PU), globus pallidus (GP) and substantia nigra (SN) on the co-registered maps. The SN was divided in 3 descending levels (SL 1-3). The most significant parameters were used for a flexible discrimination analysis (FDA) in a training collective consisting of 25 randomized subjects from each group in order to predict the classification of remaining subjects. PD-all showed significant increases in MD, R2 and R2* within SN and its subregions as well as in MD and R2* within different basal ganglia regions. Compared to the HC group, the PD≤5 and the PD>5 group showed significant MD increases within the SN and its lower two subregions, while the PD≤5 group exhibited significant increases in R2 and R2* within SN and its subregions, and tended to elevation within the basal ganglia. The PD>5 group had significantly increased MD in PU and GP, whereas the PD≤5 group presented normal MD within the basal ganglia. FDA achieved right classification in 84% of study participants. Micro-structural damage affects primarily the SN of PD patients and in later disease stages the basal ganglia. Iron contents of PU, GP and SN are increased at early disease stages of PD. Funding:
|
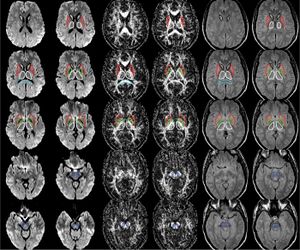 The regions-of-interest (ROIs) were manually drawn by an experienced radiologist by using the b 1000 images, averaged for all measured directions, the FA maps and the proton-density weighted images. For that purpose, the maps of ADC, FA, R2 and R2* as well as the proton-density weighted images were first co-registered. The ROIs were segmented by syncing the b 1000 images, averaged for all measured directions, the FA maps and the proton-density weighted images in ImageJ. The ROIs were stored in the ROI manager and transferred to the co-registered maps. The segmented brain regions were highlighted in different colors: CN—black; PU—red; GP—green; TH—white; SN—blue; CC—cyan. The diffusion-weighted images, the R2 and R2*-weighted maps were transferred to the 3D Slicer software in order to co-register the R2 and the R2* maps as well as the MD and the FA maps |
Effects of Ncl. Basalis Meynert Volume on the Trail-Making-Test are Restricted to the Left Hemisphere
|
Publication: Brain Behav. 2015 Dec 29;6(1):e00421. PMID: 27110442 | PDF Authors: Lammers F, Mobascher A, Musso F, Shah NJ, Warbrick T, Zaborszky L, Winterer G. Institution: Department of Anaesthesiology and Surgical Intensive Care Medicine Charité, University Medicine Berlin, Berlin, Germany. Background/Purpose: Cortical acetylcholine released from cells in the basal forebrain facilitates cue detection and improves attentional performance. Cholinergic fibres to the cortex originate from the CH4 cell group, sometimes referred to as the Nucleus basalis of Meynert and the Nucleus subputaminalis of Ayala. The aim of this work was to investigate the effects of volumes of cholinergic nuclei on attention and executive function. METHODS: The volumes of CH4 and CH4p subregions were measured in a subgroup of 38 subjects (33.5 ± 11 years, 20 females) from a population-based cohort study of smokers and never-smokers who have undergone additional MR imaging. To define regions of interest, we applied a DARTEL-based procedure implemented in SPM8 and a validated probabilistic map of the basal forebrain. Attention and executive function were measured with Trail-Making Test (TMT A+B) and Stroop-Task. RESULTS: We found a quadratic effect of the left CH4 subregion on performance of the TMT. Extremely small as well as extremely large volumes are associated with poor test performance. CONCLUSIONS: Our results indicate that a small CH4 volume predisposes for a hypocholinergic state, whereas an extremely large volume predisposes for a hypercholinergic state. Both extremes have detrimental effects on attention. Comparable nonlinear effects have already been reported in pharmacological studies on the effects cholinergic agonists on attention. |
 Segmentation example for one brain. The blue ROI refers to CH4, CH4p is shown in yellow. Slices were chosen with the intention to show that CH4p covers a cell cluster often referred to as the Nucleus subputaminalis of Ayala which is rostrolateral extension of the NBM (at 12, 14 and 15 mm). Slice positions are indicated with reference to the most anterior slice on the top left. 3D Slicer 4.3.0 was used to calculate the volume of each labelled region in the map. |
High Contrast Microstructural Visualization of Natural Acellular Matrices by Means of Phase-Based X-Ray Tomography
|
Publication: Sci Rep. 2015 Dec 14;5:18156. PMID: 26657471 | PDF Authors: Hagen CK, Maghsoudlou P, Totonelli G, Diemoz PC, Endrizzi M, Rigon L3, Menk RH, Arfelli F, Dreossi D, Brun E, Coan P, Bravin A, De Coppi P, Olivo A. Institution: University College London, Department of Medical Physics and Biomedical Engineering, London, UK. Background/Purpose: Acellular scaffolds obtained via decellularization are a key instrument in regenerative medicine both per se and to drive the development of future-generation synthetic scaffolds that could become available off-the-shelf. In this framework, imaging is key to the understanding of the scaffolds' internal structure as well as their interaction with cells and other organs, including ideally post-implantation. Scaffolds of a wide range of intricate organs (esophagus, lung, liver and small intestine) were imaged with x-ray phase contrast computed tomography (PC-CT). Image quality was sufficiently high to visualize scaffold microarchitecture and to detect major anatomical features, such as the esophageal mucosal-submucosal separation, pulmonary alveoli and intestinal villi. These results are a long-sought step for the field of regenerative medicine; until now, histology and scanning electron microscopy have been the gold standard to study the scaffold structure. However, they are both destructive: hence, they are not suitable for imaging scaffolds prior to transplantation, and have no prospect for post-transplantation use. PC-CT, on the other hand, is non-destructive, 3D and fully quantitative. Importantly, not only do we demonstrate achievement of high image quality at two different synchrotron facilities, but also with commercial x-ray equipment, which makes the method available to any research laboratory. Funding:
|
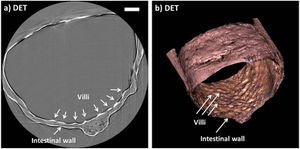 Images acquired with synchrotron-based PC-CT showing a rat small intestine that was decellularized via DET: (a) transverse cross section, (b) three-dimensional view. All scale bars represent 500 μm. Images were processed using the ESRF in-house software PyHST, and analyzed and displayed with ImageJ31 and 3D Slicer. |
Treatment Planning and Delivery of Whole Brain Irradiation with Hippocampal Avoidance in Rats
|
Publication: PLoS One. 2015 Dec 4;10(12):e0143208. PMID: 26636762 | PDF Authors: Cramer CK, Yoon SW, Reinsvold M, Joo KM, Norris H, Hood RC, Adamson JD, Klein RC, Kirsch DG, Oldham M. Institution: Department of Radiation Oncology, Duke University Medical Center, Durham, NC, USA. Background/Purpose: Despite the clinical benefit of whole brain radiotherapy (WBRT), patients and physicians are concerned by the long-term impact on cognitive functioning. Many studies investigating the molecular and cellular impact of WBRT have used rodent models. However, there has not been a rodent protocol comparable to the recently reported Radiation Therapy Oncology Group (RTOG) protocol for WBRT with hippocampal avoidance (HA) which is intended to spare cognitive function. The aim of this study was to develop a hippocampal-sparing WBRT protocol in Wistar rats. Methods: The technical and clinical challenges encountered in hippocampal sparing during rat WBRT are substantial. Three key challenges were identified: hippocampal localization, treatment planning, and treatment localization. Hippocampal localization was achieved with sophisticated imaging techniques requiring deformable registration of a rat MRI atlas with a high resolution MRI followed by fusion via rigid registration to a CBCT. Treatment planning employed a Monte Carlo dose calculation in SmART-Plan and creation of 0.5 cm thick lead blocks custom-shaped to match DRR projections. Treatment localization necessitated the on-board image-guidance capability of the XRAD C225Cx micro-CT/micro-irradiator (Precision X-Ray). Treatment was accomplished with opposed lateral fields with 225 KVp X-rays at a current of 13mA filtered through 0.3 mm of copper using a 40x40 mm square collimator and the lead blocks. A single fraction of 4Gy was delivered (2Gy per lateral field) with a 41 second beam on time per field at a dose rate of 304.5 cGy/min. Dosimetric verification of hippocampal sparing was performed using radiochromic film. In vivo verification of HA was performed after delivery of a single 4Gy fraction either with or without HA using γ-H2Ax staining of tissue sections from the brain to quantify the amount of DNA damage in rats treated with HA, WBRT, or sham-irradiated (negative controls). Results: The mean dose delivered to radiochromic film beneath the hippocampal block was 0.52Gy compared to 3.93Gy without the block, indicating an 87% reduction in the dose delivered to the hippocampus. This difference was consistent with doses predicted by Monte Carlo dose calculation. The Dose Volume Histogram (DVH) generated via Monte Carlo simulation showed an underdose of the target volume (brain minus hippocampus) with 50% of the target volume receiving 100% of the prescription isodose as a result of the lateral blocking techniques sparing some midline thalamic and subcortical tissue. Staining of brain sections with anti-phospho-Histone H2A.X (reflecting double-strand DNA breaks) demonstrated that this treatment protocol limited radiation dose to the hippocampus in vivo. The mean signal intensity from γ-H2Ax staining in the cortex was not significantly different from the signal intensity in the cortex of rats treated with WBRT (5.40 v. 5.75, P = 0.32). In contrast, the signal intensity in the hippocampus of rats treated with HA was significantly lower than rats treated with WBRT (4.55 v. 6.93, P = 0.012). Conclusion: Despite the challenges of planning conformal treatments for small volumes in rodents, our dosimetric and in vivo data show that WBRT with HA is feasible in rats. This study provides a useful platform for further application and refinement of the technique. Funding:
|
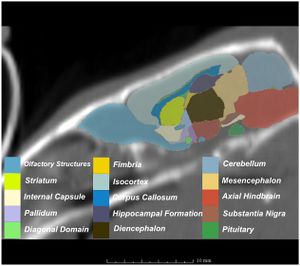 MRI with labeled structures from atlas registered to the CBCT. Registration was carried out with the open source imaging tool 3D Slicer, Version 4.4.0. |
Performance of Single And Multi-Atlas Based Automated Landmarking Methods Compared to Expert Annotations in Volumetric Microct Datasets of Mouse Mandibles
|
Publication: Front Zool. 2015 Dec 1;12:33. PMID: 26628903 | PDF Authors: Young R, Maga AM. Institution: Center for Developmental Biology and Regenerative Medicine, Seattle Children's Research Institute, Seattle, WA, USA. Background/Purpose: Here we present an application of advanced registration and atlas building framework DRAMMS to the automated annotation of mouse mandibles through a series of tests using single and multi-atlas segmentation paradigms and compare the outcomes to the current gold standard, manual annotation. Results: Our results showed multi-atlas annotation procedure yields landmark precisions within the human observer error range. The mean shape estimates from gold standard and multi-atlas annotation procedure were statistically indistinguishable for both Euclidean Distance Matrix Analysis (mean form matrix) and Generalized Procrustes Analysis (Goodall F-test). Further research needs to be done to validate the consistency of variance-covariance matrix estimates from both methods with larger sample sizes. Conclusion: Multi-atlas annotation procedure shows promise as a framework to facilitate truly high-throughput phenomic analyses by channeling investigators efforts to annotate only a small portion of their datasets. Funding:
|
 Visualization of the distances between the atlas surface that was landmarked (p90) and four other surfaces constructed. a 50 % Probability surface (p50); b 70 % Probability surface (p70); c Surface thresholded at grayscale value of 35. d Surface thresholded at grayscale value of 55. RMS: Root mean square error. Segmented left hemi-mandibles were imported into 3D Slicer and visualized using a fixed rendering and threshold setting. |
|
Publication: Thorax 2015 ;70(Suppl. 3):A220. | PDF Authors: Khan KA, Nardelli P, Alex J, O’Shea C, Cantillon-Murphy P, Kennedy MP. Institution: Department of Respiratory Medicine, Cork University Hospital, University College Cork, Cork, Ireland. Background/Purpose: In the era of lung cancer screening, tissue acquisition of peripheral lung lesions remains a challenge. We have developed a 3D electromagnetic navigation platform with airway segmentation and virtual bronchoscopy using a open source 3D Slicer environment. Methods The open source visualisation software (3D Slicer) created a detailed airway segmentation and virtual bronchoscopy model from acquired CT images. A magnetic field emitter board provides tracking of a semiautomatic locatable sensor probe (SALP) in the working channel of the bronchoscopewith always-on tip tracked sensor and can be steered both manually and automaticaly with joy stick, for accurate localization of peripheral lung lesion. An extensive ex-vivo evaluation was performed in a breathing lung model that was developed using inflatable plasticized pig lungs in a negative-pressure Following this, in-vivo real time navigation in a live porcine model using a selection of novel radioopaque fiducials placed endobronchially into distal airways. Results After completion of a selection of experiments using the breathing pig lung model, fiducials were placed endobronchially in our live porcine model. Thereafter, CT images were used to create a virtual airway 3D segmentation model. After multiplaner re-construction, land mark based registration was performed to align the CT and anaesthetised porcine. Manual and automatic navigation with the bronchoscope containing the SALP was performed. The average navigation distance covered was 85.3 mm. The navigational system accurately determined 84% of the navigation points within the airways. Conclusion Our navigational platform is inexpensive and open source and is the first to utilise SALP. In our model, there is good agreement between the position of the sensor probe during bronchoscopic navigation and as visualised in virtual bronchoscopy. Further work is being carried out to improve registration and accuracy of the navigational system before a pilot study in patients with peripheral lung nodules. |
A Novel Procedure for Rapid Imaging of Adult Mouse Brains with MicroCT using Iodine-Based Contrast
|
Publication: PLoS One. 2015 Nov 16;10(11):e0142974. PMID: 26571123 | PDF Authors: Anderson R, Maga AM. Institution: Center for Developmental Biology and Regenerative Medicine, Seattle Children's Research Institute, Seattle, WA, USA. Background/Purpose: High-resolution Magnetic Resonance Imaging (MRI) has been the primary modality for obtaining 3D cross-sectional anatomical information in animals for soft tissue, particularly brain. However, costs associated with MRI can be considerably high for large phenotypic screens for gross differences in the structure of the brain due to pathology and/or experimental manipulations. MicroCT (mCT), especially benchtop mCT, is becoming a common laboratory equipment with throughput rates equal or faster than any form of high-resolution MRI at lower costs. Here we explore adapting previously developed contrast based mCT to image adult mouse brains in-situ. We show that 2% weight per volume (w/v) iodine-potassium iodide solution can be successfully used to image adult mouse brains within 48 hours post-mortem when a structural support matrix is used. We demonstrate that hydrogel can be effectively used as a perfusant which limits the tissue shrinkage due to iodine. Funding:
|
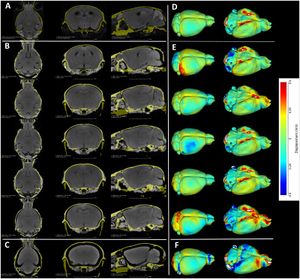 A. A representative high-resolution MRI scan of an age matched C57BL/6J displaying the brain and the mCT overlay (yellow outline) from [21]. B. Equivalent cross sections from five females that constitute the Group A (Hg perfusion) after 48h of staining in 2% I2KI. C. One individual that constitutes Group B (PFA perfusion) after 48h of staining in 2% I2KI. D-F: Heatmaps showing the difference in the obtained segmentations with respect to the reference MRI atlas constructed from [21,22]. To remove volumetric differences due to sex and age, we isometrically scaled our segmented brains to match the volume of the reference MRI atlas. Root mean square (RMS) errors are calculated after the scaling. D: Comparison of our Group A mCT atlas. RMS = 0.128 mm. E: Comparison of individuals of Group A. RMS values are 0.172 mm, 0.143 mm, 0.156 mm, 0.142 mm, 0.196 mm respectively. F: Comparison of Group B. RMS = 0.232 mm. All comparisons are rendered on MRI reference atlas. Grey areas in the heat map indicate regions of large difference (>0.5 mm) either due to extreme shrinkage or difference in segmentation. Using this outline as the boundary, stained brains were interactively segmented using the editor module of 3D Slicer. |
Comparison between Magnetic Resonance Imaging Estimates of Extracranial Cerebrospinal Fluid Volume and Physical Measurements in Healthy Dogs
|
Publication: Vet Radiol Ultrasound. 2015 Nov;56(6):658-65. PMID: 26311617 | PDF Authors: Reinitz LZ, Bajzik G, Garamvölgyi R, Petneházy Ö, Lassó A, Abonyi-Tóth Z, Lőrincz B, Sótonyi P. Institution: Faculty of Veterinary Science, Department of Anatomy and Histology, Szent István University, Godollo, Hungary. Background/Purpose: Dosages for myelography procedures in dogs are based on a hypothetical proportional relationship between bodyweight and cerebrospinal fluid (CSF) volume. Anecdotal radiographic evidence and recent studies have challenged the existence of such a defined relationship in dogs. The objectives of this prospective cross-sectional study were to describe CSF volumes using magnetic resonance imaging (MRI) in a group of clinically healthy dogs, measure the accuracy of MRI CSF volumes, and compare MRI CSF volumes with dog physical measurements. A sampling perfection with application optimized contrast using different flip-angle evolution MRI examination of the central nervous system was carried out on 12 healthy, male mongrel dogs, aged between 3 and 5 years with a bodyweight range of 7.5-35.0 kg. The images were processed with image analysis freeware (3D Slicer) in order to calculate the volume of extracranial CSF. Cylindrical phantoms of known volume were included in scans and used to calculate accuracy of MRI volume estimates. The accuracy of MRI volume estimates was 99.8%. Extracranial compartment CSF volumes ranged from 20.21 to 44.06 ml. Overall volume of the extracranial CSF increased linearly with bodyweight, but the proportional volume (ml/bodyweight kilograms) of the extracranial CSF was inversely proportional to bodyweight. Relative ratios of volumes in the cervical, thoracic, and lumbosacral regions were constant. Findings indicated that the current standard method of using body weight to calculate dosages of myelographic contrast agents in dogs may need to be revised. |
Automatic Classification of Prostate Cancer Gleason Scores from Multiparametric Magnetic Resonance Images
|
Publication: Proc Natl Acad Sci U S A. 2015 Nov 17;112(46):E6265-73. PMID: 26578786 | PDF Authors: Fehr D, Veeraraghavan H, Wibmer A, Gondo T, Matsumoto K, Vargas HA, Sala E, Hricak H, Deasy JO. Institution: Department of Medical Physics, Memorial Sloan Kettering Cancer Center, New York, NY, USA. Background/Purpose: Noninvasive, radiological image-based detection and stratification of Gleason patterns can impact clinical outcomes, treatment selection, and the determination of disease status at diagnosis without subjecting patients to surgical biopsies. We present machine learning-based automatic classification of prostate cancer aggressiveness by combining apparent diffusion coefficient (ADC) and T2-weighted (T2-w) MRI-based texture features. Our approach achieved reasonably accurate classification of Gleason scores (GS) [Formula: see text] vs. [Formula: see text] and [Formula: see text] vs. [Formula: see text] despite the presence of highly unbalanced samples by using two different sample augmentation techniques followed by feature selection-based classification. Our method distinguished between GS [Formula: see text] and [Formula: see text] cancers with 93% accuracy for cancers occurring in both peripheral (PZ) and transition (TZ) zones and 92% for cancers occurring in the PZ alone. Our approach distinguished the GS [Formula: see text] from GS [Formula: see text] with 92% accuracy for cancers occurring in both the PZ and TZ and with 93% for cancers occurring in the PZ alone. In comparison, a classifier using only the ADC mean achieved a top accuracy of 58% for distinguishing GS [Formula: see text] vs. GS [Formula: see text] for cancers occurring in PZ and TZ and 63% for cancers occurring in PZ alone. The same classifier achieved an accuracy of 59% for distinguishing GS [Formula: see text] from GS [Formula: see text] occurring in the PZ and TZ and 60% for cancers occurring in PZ alone. Separate analysis of the cancers occurring in TZ alone was not performed owing to the limited number of samples. Our results suggest that texture features derived from ADC and T2-w MRI together with sample augmentation can help to obtain reasonably accurate classification of Gleason patterns. Funding:
|
 Example of (A) a GS 6(3+3) tumor and (B) a GS 9(4+5) tumor. The top row shows the ADC image with the computed energy and entropy values overlaid on the tumor. The bottom row shows the T2-w MR image with the computed energy and entropy values overlaid on the same tumor on the corresponding slice. The texture features were computed per voxel by using a 5×5×5 patch centered at each voxel. Tumors and normal structures were identified and volumetrically segmented on both the T2-w and ADC MR images using 3D Slicer. |
Association Between Vascular Anatomy and Posterior Communicating Artery Aneurysms
|
Publication: World Neurosurg. 2015 Nov;84(5):1251-5. PMID: 26074436 Authors: Can A, Ho AL, Emmer BJ, Dammers R, Dirven CM, Du R. Institution: Department of Neurosurgery, Brigham and Women's Hospital, Harvard Medical School, Boston, MA, USA. Background/Purpose: Hemodynamic stress, conditioned by the geometry and morphology of the vessel trees, plays an important role in the formation of intracranial aneurysms. The aim of this study was to identify image-based location-specific morphologic parameters that are associated with posterior communicating artery (PCoA) aneurysms. Methods: Morphologic parameters obtained from computed tomography angiography of 56 patients with PCoA aneurysms and 23 control patients were evaluated with 3D Slicer, an open-source image analysis software, to generate 3-dimensional models of the aneurysms and surrounding vasculature. Segment lengths, diameters, and vessel-to-vessel angles were examined. To control for genetic and clinical risk factors, the unaffected contralateral side of patients with unilateral PCoA aneurysms was used as a control group for internal carotid artery (ICA)-related parameters. A separate control group with visible PCoAs and aneurysms elsewhere was used as a control group for PCoA-related parameters. Results: Internal carotid artery-related parameters were not statistically different between the PCoA aneurysm and control groups. Univariate and multivariate subgroup analysis for patients with visualized PCoAs demonstrated that a larger PCoA diameter was significantly associated with the presence of a PCoA aneurysm (odds ratio = 12.1, 95% confidence interval = 1.3-17.1, P = 0.04) after adjusting for other morphologic parameters. Conclusions: Larger PCoA diameters are associated with the presence of PCoA aneurysms. These parameters may provide objective metrics to assess aneurysm formation and growth risk stratification in high-risk patients. |
An Open Tool for Input Function Estimation and Quantification of Dynamic PET FDG Brain Scans
|
Publication: Int J Comput Assist Radiol Surg. 2015 Oct 29. PMID: 26514683 Authors: Bertrán M, Martínez N, Carbajal G, Fernández A, Gómez Á. Institution: Instituto de Ingeniería Eléctrica, Facultad de Ingeniería, Universidad de la República, Montevideo, Uruguay. Background/Purpose: Positron emission tomography (PET) analysis of clinical studies is mostly restricted to qualitative evaluation. Quantitative analysis of PET studies is highly desirable to be able to compute an objective measurement of the process of interest in order to evaluate treatment response and/or compare patient data. But implementation of quantitative analysis generally requires the determination of the input function: the arterial blood or plasma activity which indicates how much tracer is available for uptake in the brain. The purpose of our work was to share with the community an open software tool that can assist in the estimation of this input function, and the derivation of a quantitative map from the dynamic PET study. Methods: Arterial blood sampling during the PET study is the gold standard method to get the input function, but is uncomfortable and risky for the patient so it is rarely used in routine studies. To overcome the lack of a direct input function, different alternatives have been devised and are available in the literature. These alternatives derive the input function from the PET image itself (image-derived input function) or from data gathered from previous similar studies (population-based input function). In this article, we present ongoing work that includes the development of a software tool that integrates several methods with novel strategies for the segmentation of blood pools and parameter estimation. Results: The tool is available as an extension to the 3D Slicer software. Tests on phantoms were conducted in order to validate the implemented methods. We evaluated the segmentation algorithms over a range of acquisition conditions and vasculature size. Input function estimation algorithms were evaluated against ground truth of the phantoms, as well as on their impact over the final quantification map. End-to-end use of the tool yields quantification maps with relative error in the estimated influx versus ground truth on phantoms. CONCLUSIONS: The main contribution of this article is the development of an open-source, free to use tool that encapsulates several well-known methods for the estimation of the input function and the quantification of dynamic PET FDG studies. Some alternative strategies are also proposed and implemented in the tool for the segmentation of blood pools and parameter estimation. The tool was tested on phantoms with encouraging results that suggest that even bloodless estimators could provide a viable alternative to blood sampling for quantification using graphical analysis. The open tool is a promising opportunity for collaboration among investigators and further validation on real studies. |
Seeing More by Showing Less: Orientation-Dependent Transparency Rendering for Fiber Tractography Visualization
|
Publication: PLoS One. 2015 Oct 7;10(10):e0139434. PMID: 26444010 | PDF Authors: Tax CM, Chamberland M, van Stralen M, Viergever MA, Whittingstall K, Fortin D, Descoteaux M, Leemans A. Institution: Image Sciences Institute, University Medical Center Utrecht, Utrecht, The Netherlands. Background/Purpose: Fiber tractography plays an important role in exploring the architectural organization of fiber trajectories, both in fundamental neuroscience and in clinical applications. With the advent of diffusion MRI (dMRI) approaches that can also model "crossing fibers", the complexity of the fiber network as reconstructed with tractography has increased tremendously. Many pathways interdigitate and overlap, which hampers an unequivocal 3D visualization of the network and impedes an efficient study of its organization. We propose a novel fiber tractography visualization approach that interactively and selectively adapts the transparency rendering of fiber trajectories as a function of their orientation to enhance the visibility of the spatial context. More specifically, pathways that are oriented (locally or globally) along a user-specified opacity axis can be made more transparent or opaque. This substantially improves the 3D visualization of the fiber network and the exploration of tissue configurations that would otherwise be largely covered by other pathways. We present examples of fiber bundle extraction and neurosurgical planning cases where the added benefit of our new visualization scheme is demonstrated over conventional fiber visualization approaches. Funding:
|
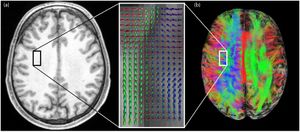 Cluttered fiber tractography visualizations due to the ability to resolve “crossing fibers” at a voxel level and the great overlap of pathways. (a) At the location of the square in the anatomical T1-weighted image (left), the dODFs (visualized as spherical “glyph” representations overlaid on a fractional anisotropy map in the magnified box on the right) reveal fiber crossings at the voxel level [42]. (b) Left hemisphere: pathways greatly overlap, resulting in a cluttered view (superior) in which underlying pathway configurations are hidden. The square indicates the same location as in (a). Right hemisphere: orientation-dependent transparency rendering in which all streamline segments that run in the direction of the viewing axis are rendered transparent. In this way, the underlying structures are revealed and can be explored. |
MR Diffusion-weighted Imaging-based Subcutaneous Tumour Volumetry in a Xenografted Nude Mouse Model using 3D Slicer: An Accurate and Repeatable Method
|
Publication: Sci Rep. 2015 Oct 22;5:15653. PMID: 26489359 | PDF Authors: Ma Z, Chen X, Huang Y, He L, Liang C, Liang C, Liu Z. Institution: Department of Radiology, Guangdong General Hospital, Guangdong Academy of Medical Sciences, Guangzhou, Guangdong, China. Background/Purpose: Accurate and repeatable measurement of the gross tumour volume(GTV) of subcutaneous xenografts is crucial in the evaluation of anti-tumour therapy. Formula and image-based manual segmentation methods are commonly used for GTV measurement but are hindered by low accuracy and reproducibility. 3D Slicer is open-source software that provides semiautomatic segmentation for GTV measurements. In our study, subcutaneous GTVs from nude mouse xenografts were measured by semiautomatic segmentation with 3D Slicer based on morphological magnetic resonance imaging(mMRI) or diffusion-weighted imaging(DWI)(b = 0,20,800 s/mm(2)) . These GTVs were then compared with those obtained via the formula and image-based manual segmentation methods with ITK software using the true tumour volume as the standard reference. The effects of tumour size and shape on GTVs measurements were also investigated. Our results showed that, when compared with the true tumour volume, segmentation for DWI(P = 0.060-0.671) resulted in better accuracy than that mMRI(P < 0.001) and the formula method(P < 0.001). Furthermore, semiautomatic segmentation for DWI(intraclass correlation coefficient, ICC = 0.9999) resulted in higher reliability than manual segmentation(ICC = 0.9996-0.9998). Tumour size and shape had no effects on GTV measurement across all methods. Therefore, DWI-based semiautomatic segmentation, which is accurate and reproducible and also provides biological information, is the optimal GTV measurement method in the assessment of anti-tumour treatments. Funding:
|
 MRI-based tumour volume segmentations with the semiautomatic and manual segmentation methods. Tumour segmentation was performed with 3D Slicer v4.3 software. The leftmost images present the same subcutaneous tumour (red arrows) on an axial slice: b = 0 s/mm2 DWI (uppermost), b = 20 s/mm2 DWI (second image from the top), b = 800 s/mm2 DWI (third image from the top), and mMRI MRI (lowest). Moreover, comparison of total tumours in corresponding sequences obtained from semiautomatic segmentation by 3D Slicer (green, middle images) and manual segmentation by ITK (blue, rightmost images) are presented. |
Spinal Cord Segmentation by One Dimensional Normalized Template Matching: A Novel, Quantitative Technique to Analyze Advanced Magnetic Resonance Imaging Data
|
Publication: PLoS One. 2015 Oct 7;10(10):e0139323. PMID: 26445367 | PDF Authors: Cadotte A, Cadotte DW, Livne M, Cohen-Adad J, Fleet D, Mikulis D, Fehlings MG. Institution: Department of Surgery, Division of Neurosurgery, University of Toronto, Toronto, Ontario, Canada. Background/Purpose: Spinal cord segmentation is a developing area of research intended to aid the processing and interpretation of advanced magnetic resonance imaging (MRI). For example, high resolution three-dimensional volumes can be segmented to provide a measurement of spinal cord atrophy. Spinal cord segmentation is difficult due to the variety of MRI contrasts and the variation in human anatomy. In this study we propose a new method of spinal cord segmentation based on one-dimensional template matching and provide several metrics that can be used to compare with other segmentation methods. A set of ground-truth data from 10 subjects was manually-segmented by two different raters. These ground truth data formed the basis of the segmentation algorithm. A user was required to manually initialize the spinal cord center-line on new images, taking less than one minute. Template matching was used to segment the new cord and a refined center line was calculated based on multiple centroids within the segmentation. Arc distances down the spinal cord and cross-sectional areas were calculated. Inter-rater validation was performed by comparing two manual raters (n = 10). Semi-automatic validation was performed by comparing the two manual raters to the semi-automatic method (n = 10). Comparing the semi-automatic method to one of the raters yielded a Dice coefficient of 0.91 ± 0.02 for ten subjects, a mean distance between spinal cord center lines of 0.32 ± 0.08 mm, and a Hausdorff distance of 1.82 ± 0.33 mm. The absolute variation in cross-sectional area was comparable for the semi-automatic method versus manual segmentation when compared to inter-rater manual segmentation. The results demonstrate that this novel segmentation method performs as well as a manual rater for most segmentation metrics. It offers a new approach to study spinal cord disease and to quantitatively track changes within the spinal cord in an individual case and across cohorts of subjects. Funding: |
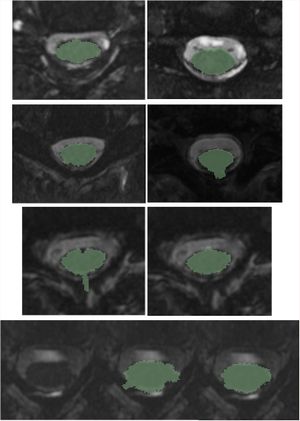 Examples of difficult segmentations due to reduced CSF, artifacts, and spinal rootlets. In the first four examples, the segmentation performed well. In the next two examples (third and fourth rows), applying a smoothing filter improved the segmentation result due to reduced CSF volume and image artifacts. The semi-automated segmentation method requires initial user input to approximate the center of the non-segmented spinal cord, between the start and end points of the desired segmentation region, using 3D Slicer. |
A Multidimensional Dynamic Quantification Tool for the Mitral Valve
|
Publication: Interact Cardiovasc Thorac Surg. 2015 Oct;21(4):481-7. PMID: 26174119| PDF Authors: Hossien A, Nithiarasu P, Cheriex E, Maessen J, Sardari Nia P, Ashraf S. Institution: College of Medicine, Swansea University, Swansea, UK. Background/Purpose: The mitral valve (MV) is a complex three-dimensional (3D) intracardiac structure. 3D transthoracic and transoesophageal echocardiography are used to evaluate and describe the changes in the mitral valve apparatus due to degenerative or functional mitral regurgitation. These techniques are, however, not accurate enough to capture the dynamic changes during the cardiac cycle. We describe a novel multistage modelling (MSM) technique, using three-dimensional transoesophageal echocardiography (3D TOE), to visualize and quantify the MV during all the phases of the cardiac cycle. Methods: Using 3D TOE, sets of images were obtained from 32 individuals who were undergoing surgery for other reasons and who did not have MV disease. These images were divided into six steps whereby every step represented one cardiac cycle. The image sets were then cropped and sliced at the level of MV, then imported and segmented by the open source software (3D Slicer) to create 3D mathematical models. The models were synchronized with patient's ECGs and then reunited and exported as multiphase dynamic models. The models were analysed in two steps: (i) direct step-by-step visual inspections of the MV from various angles and (ii) direct measurements of anteroposterior, intercommissural, anterolateral-posteromedial diameters, anterolateral angles and anteroposterior angles in systole and diastole at different levels. Results: The segmentation results in 32 × 6 high-quality cropped MV. The division of models into six steps allows quantification and tracking of MV movement. Reunion of the models leads to creation of a full real-time simulation of the MV during the cardiac cycle. Synchronization of the models with ECG enables accurate simulation. Measurements of the diameters showed: median intercommissural diameters were increased with 10% from mid-systole to mid-diastole [31.9 mm (28.9-34.9), 34.8 mm (31.2-38.2), respectively, P-value <0.001]. This was also observed for anteroposterior diameters [33.8 mm (29.8-35.2), 37.1 mm (31.8-38.5), respectively, P-value <0.001]. Anterolateral-posteromedial diameter did not change significantly in both phases [43.7 mm (36.3-48.9), 43.5 mm (35.5-47.5), respectively]. Intercommissural and anteroposterior diameters were approximately the same in systole [31.9 mm (28.9-34.9) and 32.5 mm (29.8-35.2)] and diastole [34.8 mm (31.2-38.2) and 35.2 mm (31.8-38.5)]. Measurements of anteroposterior angle at the anterolateral junction showed that this angle was accentuated acutely in diastole rather in systole [115° (104-129), 126° (113-137), respectively, P-value <0.001]. It was the same when measuring the anterolateral angle [105° (97-113), 119° (106-130), respectively, P-value <0.001]. Conclusion: The novel MSM technique allows precise quantification of shape changes in MV, which may help in better understanding the normal MV physiology, facilitate the diagnosis of MV pathologies and lead to numerical simulation of MV flow and displacement. It can also help cardiac surgeons and cardiologists gain a better understanding of the MV and assist them in obtaining a reliable orientation in order to choose optimal treatment strategies and plan surgical interventions. The measurement of the new anterolateral angle allowed better quantification of mitral annulus angulation and could be considered as new parameter that may help in future development of a new generation of mitral rings. |
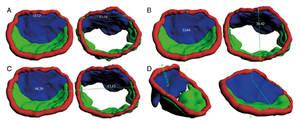 Measurements of different diameters of the mitral valve (MV) in mid-systole and -diastole. (A) Measurement of intercommissural diameter. (B) Measurement anteroposterior diameter of the MV. (C)Measurement of anterolateral–posteromedial diameter. (D)Measurement of anteroposterior angle at the commissural level. |
Clinical and Radiologic Disease in Smokers With Normal Spirometry
|
Publication: JAMA Intern Med. 2015 Sep;175(9):1539-49. PMID: 26098755 | PDF Authors: Regan EA, Lynch DA, Curran-Everett D, Curtis JL, Austin JH, Grenier PA, Kauczor HU, Bailey WC, DeMeo DL, Casaburi RH, Friedman P, Van Beek EJ, Hokanson JE, Bowler RP, Beaty TH, Washko GR, Han MK, Kim V, Kim SS, Yagihashi K, Washington L, McEvoy CE, Tanner C, Mannino DM, Make BJ, Silverman EK, Crapo JD; Genetic Epidemiology of COPD (COPDGene) Investigators. Institution: National Jewish Health, Denver, CO, USA. Background/Purpose: IMPORTANCE: Airflow obstruction on spirometry is universally used to define chronic obstructive pulmonary disease (COPD), and current or former smokers without airflow obstruction may assume that they are disease free. OBJECTIVE: To identify clinical and radiologic evidence of smoking-related disease in a cohort of current and former smokers who did not meet spirometric criteria for COPD, for whom we adopted the discarded label of Global Initiative for Obstructive Lung Disease (GOLD) 0. DESIGN, SETTING, AND PARTICIPANTS: Individuals from the Genetic Epidemiology of COPD (COPDGene) cross-sectional observational study completed spirometry, chest computed tomography (CT) scans, a 6-minute walk, and questionnaires. Participants were recruited from local communities at 21 sites across the United States. The GOLD 0 group (n = 4388) (ratio of forced expiratory volume in the first second of expiration [FEV1] to forced vital capacity >0.7 and FEV1 ≥80% predicted) from the COPDGene study was compared with a GOLD 1 group (n = 794), COPD groups (n = 3690), and a group of never smokers (n = 108). Recruitment began in January 2008 and ended in July 2011. MAIN OUTCOMES AND MEASURES: Physical function impairments, respiratory symptoms, CT abnormalities, use of respiratory medications, and reduced respiratory-specific quality of life. RESULTS: One or more respiratory-related impairments were found in 54.1% (2375 of 4388) of the GOLD 0 group. The GOLD 0 group had worse quality of life (mean [SD] St George's Respiratory Questionnaire total score, 17.0 [18.0] vs 3.8 [6.8] for the never smokers; P < .001) and a lower 6-minute walk distance, and 42.3% (127 of 300) of the GOLD 0 group had CT evidence of emphysema or airway thickening. The FEV1 percent predicted distribution and mean for the GOLD 0 group were lower but still within the normal range for the population. Current smoking was associated with more respiratory symptoms, but former smokers had greater emphysema and gas trapping. Advancing age was associated with smoking cessation and with more CT findings of disease. Individuals with respiratory impairments were more likely to use respiratory medications, and the use of these medications was associated with worse disease. CONCLUSIONS AND RELEVANCE: Lung disease and impairments were common in smokers without spirometric COPD. Based on these results, we project that there are 35 million current and former smokers older than 55 years in the United States who may have unrecognized disease or impairment. The effect of chronic smoking on the lungs and the individual is substantially underestimated when using spirometry alone. Funding:
|
Two-Center Prospective, Randomized, Clinical, and Radiographic Study Comparing Osteotome Sinus Floor Elevation with or without Bone Graft and Simultaneous Implant Placement
|
Publication: Clin Implant Dent Relat Res. 2015 Aug 28. PMID: 26315564 | PDF Authors: Marković A, Mišić T, Calvo-Guirado JL, Delgado-Ruíz RA, Janjić B, Abboud M. Institution: Clinic of Oral Surgery, School of Dental Medicine, University of Belgrade, Belgrade, Serbia. Background/Purpose: To evaluate stability and success rate of hydrophilic nanostructured implants placed via osteotome sinus floor elevation (OSFE) without grafting material or using β-tricalcium phosphate (β-TCP), deproteinized bovine bone (DBB), or their combination, and also to assess three-dimensional volumetric stability of endo-sinus bone gained in the aforementioned conditions. Materials and Methods: OSFE with simultaneous implant placement (10-mm long SLActive-BL® , Straumann, Basel, Switzerland) was performed. Grafting materials were randomly allocated to implant sites, whereas one site was left without graft. Implant stability was measured by resonance frequency analysis over 6 months. Implant success was evaluated after 2 years of loading. Volume of new endo-sinus bone was calculated from CBCT images using 3D Slicer® software. Results: A total of 180 implants were inserted into posterior maxilla of 45 patients with 6.59 ± 0.45 mm of residual bone height, and all remained successful after 2 years. Implant stability steadily increased during healing, without significant difference between groups (p = .658). After 2 years, endo-sinus bone significantly shrank (p < .001) in all groups (DBB:66.34%; β-TCP:61.44%; new bone formed from coagulum: 53.02%; β-TCP + DBB:33.47%). Conclusions: Endo-sinus bone gained after OSFE inevitably and significantly shrinks regardless of whether grafting material is applied or not. Grafting material offers no significant advantage to stability nor clinical success of hydrophilic and nanostructured implants placed simultaneously with OSFE. |
Isometric Scaling in Developing Long Bones Is Achieved by an Optimal Epiphyseal Growth Balance
|
Publication: PLoS Biol. 2015 Aug 4;13(8):e1002212. PMID: 26241802| PDF Authors: Stern T, Aviram R, Rot C, Galili T, Sharir A, Kalish Achrai N, Keller Y, Shahar R, Zelzer E. Institution: Department of Molecular Genetics, Weizmann Institute of Science, Rehovot, Israel. Background/Purpose: One of the major challenges that developing organs face is scaling, that is, the adjustment of physical proportions during the massive increase in size. Although organ scaling is fundamental for development and function, little is known about the mechanisms that regulate it. Bone superstructures are projections that typically serve for tendon and ligament insertion or articulation and, therefore, their position along the bone is crucial for musculoskeletal functionality. As bones are rigid structures that elongate only from their ends, it is unclear how superstructure positions are regulated during growth to end up in the right locations. Here, we document the process of longitudinal scaling in developing mouse long bones and uncover the mechanism that regulates it. To that end, we performed a computational analysis of hundreds of three-dimensional micro-CT images, using a newly developed method for recovering the morphogenetic sequence of developing bones. Strikingly, analysis revealed that the relative position of all superstructures along the bone is highly preserved during more than a 5-fold increase in length, indicating isometric scaling. It has been suggested that during development, bone superstructures are continuously reconstructed and relocated along the shaft, a process known as drift. Surprisingly, our results showed that most superstructures did not drift at all. Instead, we identified a novel mechanism for bone scaling, whereby each bone exhibits a specific and unique balance between proximal and distal growth rates, which accurately maintains the relative position of its superstructures. Moreover, we show mathematically that this mechanism minimizes the cumulative drift of all superstructures, thereby optimizing the scaling process. Our study reveals a general mechanism for the scaling of developing bones. More broadly, these findings suggest an evolutionary mechanism that facilitates variability in bone morphology by controlling the activity of individual epiphyseal plates. Funding:
|
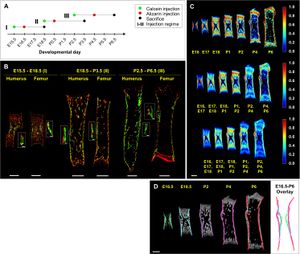 Accurate registration of bones from different developmental stages is achieved by matching the cortical cores. (A) A time chart of calcein and alizarin injection regimes. To cover the entire period effectively, three marginally overlapping regimes were applied. (B) Histological sections from each of the three injection regimes. At E18.5, green-labeled regions are seen around the middle part of the cortical core in both humerus and femur sections, indicating temporally preserved mineral structures. Similar temporal preservation of the cortical core is exhibited during perinatal and early postnatal development. (C) Color-coded statistical maps depicting the fraction of bones that are mineralized at each point in the bone, based on frontal slices of the femur. Clusters are composed of all bones from a single developmental day (top row), pairs (middle row), and triplets (bottom row) of consecutive developmental days. Regions that are highly preserved in population over several days (color-coded red; middle and bottom rows) are located mostly around the middle part of the cortical core. (D) A time series of frontal slices of the femur with the cortical core highlighted in each image with a different color. On the right is an overlay of all cortical core highlights following anatomical matching. The high overlap between segments demonstrates the potential of the cortical core to serve as a reliable salient structure for accurate anatomical matching of embryonic and early postnatal bones. Scale bars: 500 μm in B–D, 25 μm in B insets I and II, and 50 μm in B inset III. Manual image registration for the assessment of preservation of mineralized structures and for spatial standardization of all in vivo images was performed using the free and open-source software package 3D Slicer v.3.6. |
A Statistical Shape Model of the Human Second Cervical Vertebra
|
Publication: Int J Comput Assist Radiol Surg. 2015 Jul;10(7):1097-107. PMID: 25354900 Authors: Clogenson M, Duff JM, Luethi M, Levivier M, Meuli R, Baur C, Henein S. Institution: Instant-Lab, École Polytechnique Fédérale de Lausanne, Neuchâtel, Switzerland. Background/Purpose: Statistical shape and appearance models play an important role in reducing the segmentation processing time of a vertebra and in improving results for 3D model development. Here, we describe the different steps in generating a statistical shape model (SSM) of the second cervical vertebra (C2) and provide the shape model for general use by the scientific community. The main difficulties in its construction are the morphological complexity of the C2 and its variability in the population. Methods: The input dataset is composed of manually segmented anonymized patient computerized tomography (CT) scans. The alignment of the different datasets is done with the procrustes alignment on surface models, and then, the registration is cast as a model-fitting problem using a Gaussian process. A principal component analysis (PCA)-based model is generated which includes the variability of the C2. Results: The SSM was generated using 92 CT scans. The resulting SSM was evaluated for specificity, compactness and generalization ability. The SSM of the C2 is freely available to the scientific community in 3D Slicer (an open source software for image analysis and scientific visualization) with a module created to visualize the SSM using Statismo, a framework for statistical shape modeling. Conclusion: The SSM of the vertebra allows the shape variability of the C2 to be represented. Moreover, the SSM will enable semi-automatic segmentation and 3D model generation of the vertebra, which would greatly benefit surgery planning. |
Bone Engineering of Maxillary Sinus Bone Deficiencies using Enriched CD90+ Stem Cell Therapy: A Randomized Clinical Trial
|
Publication: J Bone Miner Res. 2015 Jul;30(7):1206-16. PMID: 25652112 Authors: Kaigler D, Avila-Ortiz G, Travan S, Taut AD, Padial-Molina M, Rudek I, Wang F, Lanis A, Giannobile WV. Institution: Department of Periodontics and Oral Medicine, University of Michigan School of Dentistry, Ann Arbor, MI, USA. Background/Purpose: Bone engineering of localized craniofacial osseous defects or deficiencies by stem cell therapy offers strong prospects to improve treatment predictability for patient care. The aim of this phase I/II randomized, controlled, clinical trial was to evaluate reconstruction of bone deficiencies of the maxillary sinus with transplantation of autologous cells enriched with CD90+ stem cells and CD14+ monocytes. Thirty human participants requiring bone augmentation of the maxillary sinus were enrolled. Patients presenting with 50-80% bone deficiencies of the maxillary sinus were randomized to receive either stem cells delivered onto a β-tricalcium phosphate scaffold, or scaffold alone. Four months following treatment, clinical, radiographic, and histologic analyses were performed to evaluate de novo engineered bone. At the time of alveolar bone core harvest, oral implants were installed in the engineered bone and later functionally restored with dental tooth prostheses. Radiographic analyses showed no difference in the total bone volume gained between treatment groups, however, density of the engineered bone was higher in patients receiving stem cells. Bone core biopsies showed that stem cell therapy provided the greatest benefit in the most severe deficiencies, yielding better bone quality than control patients, as evidenced by higher bone volume fraction (BVF; 0.5 vs. 0.4; p=0.04). Assessment of the relation between degree of CD90+ stem cell enrichment and BVF showed that the higher the CD90 composition of transplanted cells, the greater the BVF of regenerated bone (r=0.56; p=0.05). Oral implants were placed and restored with functionally-loaded dental restorations in all patients and no treatment-related adverse events were reported at the one-year follow-up. These results provide evidence that cell-based therapy using enriched CD90+ stem cell populations is safe for maxillary sinus floor reconstruction and offers potential to accelerate and enhance tissue engineered bone quality in other craniofacial bone defects and deficiencies. An automated, voxel-based registration method was performed with 3D Slicer. Funding:
|
Three-Dimensional Eyeball and Orbit Volume Modification After LeFort III Midface Distraction
|
Publication: J Craniofac Surg. 2015 Jul;26(5):1652-5. PMID: 26086925 Authors: Smektala T, Nysjö J, Thor A, Homik A, Sporniak-Tutak K, Safranow K, Dowgierd K, Olszewski R. Institution: Department of Maxillofacial Surgery, Pomeranian Medical University, Szczecin, Poland. Background/Purpose: The aim of our study was to evaluate orbital volume modification with LeFort III midface distraction in patients with craniosynostosis and its influence on eyeball volume and axial diameter modification. Orbital volume was assessed by the semiautomatic segmentation method based on deformable surface models and on 3-dimensional (3D) interaction with haptics. The eyeball volumes and diameters were automatically calculated after manual segmentation of computed tomographic scans with 3D Slicer software. The mean, minimal, and maximal differences as well as the standard deviation and intraclass correlation coefficient (ICC) for intraobserver and interobserver measurements reliability were calculated. The Wilcoxon signed rank test was used to compare measured values before and after surgery. P < 0.05 was considered statistically significant. Intraobserver and interobserver ICC for haptic-aided semiautomatic orbital volume measurements were 0.98 and 0.99, respectively. The intraobserver and interobserver ICC values for manual segmentation of the eyeball volume were 0.87 and 0.86, respectively. The orbital volume increased significantly after surgery: 30.32% (mean, 5.96 mL) for the left orbit and 31.04% (mean, 6.31 mL) for the right orbit. The mean increase in eyeball volume was 12.3%. The mean increases in the eyeball axial dimensions were 7.3%, 9.3%, and 4.4% for the X-, Y-, and Z-axes, respectively. The Wilcoxon signed rank test showed that preoperative and postoperative eyeball volumes, as well as the diameters along the X- and Y-axes, were statistically significant. Midface distraction in patients with syndromic craniostenosis results in a significant increase (P < 0.05) in the orbit and eyeball volumes. The 2 methods (haptic-aided semiautomatic segmentation and manual 3D Slicer segmentation) are reproducible techniques for orbit and eyeball volume measurements. |
High-field Functional Magnetic Resonance Imaging of Vocalization Processing in Marmosets
|
Publication: Sci Rep. 2015 Jun 19;5:10950. PMID: 26091254| PDF Authors: Sadagopan S, Temiz-Karayol NZ, Voss HU. Institution: Laboratory of Neural Systems, Rockefeller University, New York, NY. Background/Purpose: Vocalizations are behaviorally critical sounds, and this behavioral importance is reflected in the ascending auditory system, where conspecific vocalizations are increasingly over-represented at higher processing stages. Recent evidence suggests that, in macaques, this increasing selectivity for vocalizations might culminate in a cortical region that is densely populated by vocalization-preferring neurons. Such a region might be a critical node in the representation of vocal communication sounds, underlying the recognition of vocalization type, caller and social context. These results raise the questions of whether cortical specializations for vocalization processing exist in other species, their cortical location, and their relationship to the auditory processing hierarchy. To explore cortical specializations for vocalizations in another species, we performed high-field fMRI of the auditory cortex of a vocal New World primate, the common marmoset (Callithrix jacchus). Using a sparse imaging paradigm, we discovered a caudal-rostral gradient for the processing of conspecific vocalizations in marmoset auditory cortex, with regions of the anterior temporal lobe close to the temporal pole exhibiting the highest preference for vocalizations. These results demonstrate similar cortical specializations for vocalization processing in macaques and marmosets, suggesting that cortical specializations for vocal processing might have evolved before the lineages of these species diverged. |
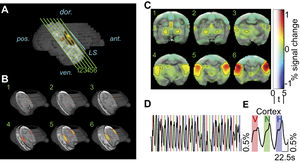 BOLD activity in the auditory cortex. (A) Six slices (green lines) of 1.2 mm thickness were positioned parallel to the lateral sulcus (LS; blue line), with the last slice abutting the LS. Dark gray structure is a surface reconstruction of Subject C’s brain from an anatomical scan, light gray region corresponds to the indexed location of functional slices, and heatmap corresponds to regions of significant BOLD activation (t ≥ 5). (B) Three dimensional view showing slice positioning relative to the whole brain, and regions of significant BOLD activation (heatmap). (C) Average predictor value (beta) for the three vocalization stimuli mapped on to an anatomical MRI (left side of figure is left hemisphere). Here the heat map corresponds to the percent change in BOLD activation, transparency corresponds to the t-statistic, and black contours encompass regions with a t-statistic greater than five (corresponds to FDR-corrected q value < 10−5). (D) Average time-course from all voxels with t > 5, across 10 repetitions of the three vocalization stimuli – conspecific vocalizations (V; red shading), phase-scrambled vocalizations (N; green shading) and heterospecific vocalizations (H; blue shading). (E) Time-course data in (D) averaged over all 10 repetitions for significant cortical voxels (t > 5). |
Optimizing Parameters of an Open-source Airway Segmentation Algorithm using Different CT Images
|
Publication: Biomed Eng Online. 2015 Jun 26;14:62. PMID: 26112975| PDF Authors: Nardelli P, Khan KA, Corvò A, Moore N, Murphy MJ, Twomey M, O'Connor OJ, Kennedy MP, Estépar RS, Maher MM, Cantillon-Murphy P. Institution: School of Engineering, University College Cork, Cork, Ireland. Background/Purpose: Computed tomography (CT) helps physicians locate and diagnose pathological conditions. In some conditions, having an airway segmentation method which facilitates reconstruction of the airway from chest CT images can help hugely in the assessment of lung diseases. Many efforts have been made to develop airway segmentation algorithms, but methods are usually not optimized to be reliable across different CT scan parameters. Methods: In this paper, we present a simple and reliable semi-automatic algorithm which can segment tracheal and bronchial anatomy using the open-source 3D Slicer platform. The method is based on a region growing approach where trachea, right and left bronchi are cropped and segmented independently using three different thresholds. The algorithm and its parameters have been optimized to be efficient across different CT scan acquisition parameters. The performance of the proposed method has been evaluated on EXACT'09 cases and local clinical cases as well as on a breathing pig lung phantom using multiple scans and changing parameters. In particular, to investigate multiple scan parameters reconstruction kernel, radiation dose and slice thickness have been considered. Volume, branch count, branch length and leakage presence have been evaluated. A new method for leakage evaluation has been developed and correlation between segmentation metrics and CT acquisition parameters has been considered. Results: All the considered cases have been segmented successfully with good results in terms of leakage presence. Results on clinical data are comparable to other teams' methods, as obtained by evaluation against the EXACT09 challenge, whereas results obtained from the phantom prove the reliability of the method across multiple CT platforms and acquisition parameters. As expected, slice thickness is the parameter affecting the results the most, whereas reconstruction kernel and radiation dose seem not to particularly affect airway segmentation. Conclusion: The system represents the first open-source airway segmentation platform. The quantitative evaluation approach presented represents the first repeatable system evaluation tool for like-for-like comparison between different airway segmentation platforms. Results suggest that the algorithm can be considered stable across multiple CT platforms and acquisition parameters and can be considered as a starting point for the development of a complete airway segmentation algorithm. |
Cross-Validation of 3D Gamma Comparison Tools
|
Publication: Med Phys. 2015 Jun;42(6):3385. Authors: Alexander KM, Jechel C, Pinter C, Salomons G, Lasso A, Fichtinger G, Schreiner LJ. Institution: Department of Physics, Engineering Physics, and Astronomy, Queen's University, Kingston, Ontario, Canada. Background/Purpose: Moving the computational analysis for 3D gel dosimetry into the 3D Slicer environment has made gel dosimetry more clinically accessible. To ensure accuracy, we cross-validate the 3D gamma comparison module in 3D Slicer with an independently developed algorithm using simulated and measured dose distributions. Methods: Two reference dose distributions were generated using the Varian Eclipse treatment planning system. The first distribution consisted of a four-field box irradiation delivered to a plastic water phantom and the second, a VMAT plan delivered to a gel dosimeter phantom. The first reference distribution was modified within Eclipse to create an evaluated dose distribution by spatially shifting one field by 3 mm, increasing the monitor units of the second field, applying a dynamic wedge for the third field, and leaving the fourth field unchanged. The VMAT plan was delivered to a gel dosimeter and the evaluated dose in the gel was calculated from optical CT measurements. Results from the gamma comparison tool built into the SlicerRT toolbox were compared to results from our in-house gamma algorithm implemented in Matlab (via MatlabBridge in 3D Slicer). The effects of noise, resolution and the exchange of reference and evaluated designations on the gamma comparison were also examined. Results: Perfect agreement was found between the gamma results obtained using the SlicerRT tool and our Matlab implementation for both the four-field box and gel datasets. The behaviour of the SlicerRT comparison with respect to changes in noise, resolution and the role of the reference and evaluated dose distributions was consistent with previous findings. Conclusion: Two independently developed gamma comparison tools have been cross-validated and found to be identical. As we transition our gel dosimetry analysis from Matlab to 3D Slicer, this validation serves as an important test towards ensuring the consistency of dose comparisons using the 3D Slicer environment. |
Effect of Pulse Sequence Parameters On Geometric Distortions Induced by a Titanium Brachytherapy Applicator
|
Publication: Med Phys. 2015 Jun;42(6):3313. Authors: Shea S, Diak A, Surucu M, Harkenrider M, Yacoub J, Roeske J, Small W. Institution: Loyola University Chicago, IL, USA. Background/Purpose: To investigate the effect of readout bandwidth and voxel size on the appearance of distortion artifacts caused by a titanium brachytherapy applicator. Methods: An acrylic phantom was constructed to rigidly hold a MR conditional, titanium Fletcher-Suit-Delclos-style applicator set (Varian Medical Systems) for imaging on CT (Philips Brilliance) and 1.5T MRI (Siemens Magnetom Aera). Several variants of MRI parameters were tried for 2D T2-weighted turbo spin echo imaging in comparison against the standard clinical protocol with the criteria to keep relative SNR loss less than 20% and imaging time as short as possible. Two 3D sequences were also used for comparison with similar parameters. The applicator tandem was segmented on axial CT images (0.4×0.4×1.5mm3 resolution) and the CT images were registered to the 3D MR images in Eclipse (Varian). The applicator volume was then overlaid on all MRI sets in 3D Slicer and distances were measured from the tandem tip to the MRI artifact edge in right/left/superior and anterior/posterior/superior directions from coronal and sagittal 2D acquisitions, respectively, or 3D data reformats. Artifact regions were also manually contoured in coronal/sagittal orientations for area measurements. Results: As would be expected, reductions in voxel size and increases in readout bandwidth reduced artifact size (average max artifact length decreased by 0.95 mm and average max area decrease by 0.27 cm2). Interestingly, bandwidth increases yielded reductions in area (0.19 cm2) and in distance measurements (1 mm) even with voxel increases, as compared to a standard protocol. This could be useful when high performance protocols are not feasible due to long imaging times. Conclusion: We have characterized artifacts caused by cervical brachytherapy applicator across multiple sequence parameters at 1.5T. Future work will focus on finalizing an optimal protocol that balances artifact reduction with imaging time and then testing this new protocol in patients. |
|
Publication: Ultrasound Med Biol. 2015 Aug;41(8):2220-31. PMID: 25964065 Authors: Rafii-Tari H, Lessoway VA, Kamani AA, Abolmaesumi P, Rohling R. Institution: The Hamlyn Centre for Robotic Surgery, Imperial College London, London, UK. Background/Purpose: Despite the common use of epidural anesthesia in obstetrics and surgery, the procedure can be challenging, especially for obese patients. We propose the use of an ultrasound guidance system employing a transducer-mounted camera to create 3-D panorama ultrasound volumes of the spine, thereby allowing identification of vertebrae and selection of puncture site, needle trajectory and depth of insertion. The camera achieves absolute position estimation of the transducer with respect to the patient using a specialized marker strip attached to the skin surface. The guidance system is validated first on a phantom against a commercial optical tracking system and then in vivo by comparing panorama images from human subjects against independent measurements by an experienced sonographer. The results for measuring depth to the epidural space, intervertebral spacing and registration of interspinous gaps to the skin prove the potential of the system for improving guidance of epidural anesthesia. The tracking and visualization are implemented in real time using the 3D Slicer software package. |
Towards the Personalized Treatment of Glioblastoma: Integrating Patient-Specific Clinical Data in a Continuous Mechanical Model
|
Publication: PLoS One. 2015 Jul 17;10(7):e0132887. PMID: 26186462| PDF Authors: Colombo MC, Giverso C, Faggiano E, Boffano C, Acerbi F, Ciarletta P Institution: Department of Mathematics, Politecnico di Milano, Milano, Italy. Background/Purpose: Glioblastoma multiforme (GBM) is the most aggressive and malignant among brain tumors. In addition to uncontrolled proliferation and genetic instability, GBM is characterized by a diffuse infiltration, developing long protrusions that penetrate deeply along the fibers of the white matter. These features, combined with the underestimation of the invading GBM area by available imaging techniques, make a definitive treatment of GBM particularly difficult. A multidisciplinary approach combining mathematical, clinical and radiological data has the potential to foster our understanding of GBM evolution in every single patient throughout his/her oncological history, in order to target therapeutic weapons in a patient-specific manner. In this work, we propose a continuous mechanical model and we perform numerical simulations of GBM invasion combining the main mechano-biological characteristics of GBM with the micro-structural information extracted from radiological images, i.e. by elaborating patient-specific Diffusion Tensor Imaging (DTI) data. The numerical simulations highlight the influence of the different biological parameters on tumor progression and they demonstrate the fundamental importance of including anisotropic and heterogeneous patient-specific DTI data in order to obtain a more accurate prediction of GBM evolution. The results of the proposed mathematical model have the potential to provide a relevant benefit for clinicians involved in the treatment of this particularly aggressive disease and, more importantly, they might drive progress towards improving tumor control and patient’s prognosis. |
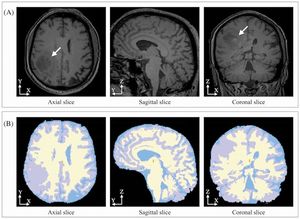 Post-contrast T1-MR of a patient affected by GBM and corresponding segmented slices. Using an expectation maximization approach [66] implemented in the open source software package 3D Slicer, the anatomical structures are automatically segmented and the four areas of interest (i.e. gray matter, white matter, cerebrospinal (CSF) fluid and background) are identified and labeled. |
Intraoperative Image-guided Transoral Robotic Surgery: Pre-clinical Studies
|
Publication: Int J Med Robot. 2015 Jun;11(2):256-67. PMID: 25069602| PDF Authors: Liu WP, Reaugamornrat S, Sorger JM, Siewerdsen JH, Taylor RH, Richmon JD. Institution: Department of Computer Science, Johns Hopkins University, Baltimore, MD, USA. Background/Purpose: Adequate resection of oropharyngeal neoplasms with transoral robotic surgery (TORS) poses multiple challenges, including difficulty with access, inability to palpate the tumor, loss of landmarks, and intraoperative patient positioning with mouth retractor and tongue extended creating significant tissue distortion from preoperative imaging. Methods: This study evaluates a workflow integrating intraoperative cone beam computed tomography (CBCT) for image-guided TORS through robotic experimentation locating 8-10 embedded targets in five porcine tongues and a cadaveric head phantom, conducted under various modes of visualization and integration of preoperative/intraoperative imaging. Results: A statistically significant improvement in mean target localization error was achieved for both the porcine tongue ((9.8 ± 4.0) mm vs. (5.3 ± 1.3) mm, P-value = 0.0151) and cadaver ((11.2 ± 5.0) mm vs. (5.8 ± 2.5) mm P-value = 0.0189) in experiments comparing scenarios simulating current standard-of-care practice and the proposed image guidance system. Conclusion: Intraoperative image guidance with augmentation of critical surgical structures has the potential to improve target localization for TORS. Funding:
|
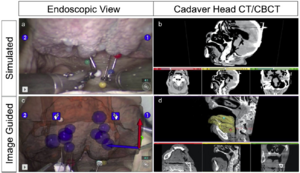 Simulated current practice in which the surgeon has access to only (a) the raw endoscopy (b) preoperative CT to help guide the surgical navigation. Our proposed image guidance workflow showing (c) a 3D image overlay of the targets on the tongue. derivedfrom (d) the preoperative plan registered to intraoperative CBCT. We applied relatively simple semi-automatic segmentation techniques initialized with intensity-based thresholds and edge-based snake methods using ITK- snap and 3D Slicer. |
Brain Atrophy and White-matter Hyperintensities are Not Significantly Associated with Incidence and Severity of Postoperative Delirium in Older Persons without Dementia
|
Publication: Neurobiol Aging. 2015 Jun;36(6):2122-9. PMID: 25824618| PDF Authors: Cavallari M, Hshieh TT, Guttmann CR, Ngo LH, Meier DS, Schmitt EM, Marcantonio ER, Jones RN, Kosar CM, Fong TG, Press D, Inouye SK, Alsop DC, SAGES Study Group. Institution: Center for Neurological Imaging, Brigham and Women's Hospital, Harvard Medical School, Boston, MA, USA. Background/Purpose: Postoperative delirium is a common complication in older people and is associated with increased mortality, morbidity, institutionalization, and caregiver burden. Although delirium is an acute confusional state characterized by global impairments in attention and cognition, it has been implicated in permanent cognitive impairment and dementia. The pathogenesis of delirium and the mechanisms leading to these disabling consequences remain unclear. The present study is the first to address the potential predisposing role of brain morphologic changes toward postoperative delirium in a large prospective cohort of patients undergoing elective surgery using state-of-the-art magnetic resonance imaging (MRI) techniques conducted before admission. We investigated the association of MRI-derived quantitative measures of white-matter damage, global brain, and hippocampal volume with the incidence and severity of delirium. Presurgical white-matter hyperintensities (WMHs), whole brain, and hippocampal volume were measured in 146 consecutively enrolled subjects, ≥70 years old, without dementia who were undergoing elective surgery. These 3 presurgical MRI indices were tested as predictors of incidence and severity of subsequent delirium. Out of 146 subjects, 32 (22%) developed delirium. We found no statistically significant differences in WMH, whole brain, or hippocampal volume between subjects with and without delirium. Both unadjusted and adjusted (age, gender, vascular comorbidity, and general cognitive performance) regression analyses demonstrated no statistically significant association between any of the MRI measures with respect to delirium incidence or severity. In persons without dementia, preexisting cerebral WMHs, general and hippocampal atrophy may not predispose to postoperative delirium or worsen its severity. Funding:
|
Morphology Parameters for Mirror Posterior Communicating Artery Aneurysm Rupture Risk Assessment
|
Publication: Neurol Med Chir (Tokyo). 2015 Jun 15;55(6):498-504. PMID: 26041624 | PDF Authors: Jiang H, Shen J, Weng YX, Pan JW, Yu JB, Wan ZA, Zhan R. Institution: Department of Neurosurgery, First Affiliated Hospital, School of Medicine, Zhejiang University, China. Background/Purpose: Recent studies have shown that posterior communicating artery (PComA) aneurysms are more likely to rupture. However, surgical intervention for PComA aneurysms may be associated with increased treatment-related morbidity rate. Therefore, it is meaningful to investigate the factors related to PComA aneurysm rupture. The purpose of this study was to identify morphological parameters that significantly correlate with PComA aneurysm rupture. We divided 14 pairs of mirror posterior communicating artery aneurysms (PComA-MANs) into ruptured and unruptured groups. Computed tomography angiography (CTA) imaging was evaluated with three-dimensional 3D Slicer to generate models of the aneurysms and surrounding vasculature. Nine morphological parameters [size, height, width, neck width, aspect ratio (AR), bottleneck factor (BNF), height/width ratio (H/W), size ratio (SR), and bleb formation] were examined in the two groups for significance with respect to rupture. By contrast, statistically significant differences were found in ruptured and unruptured group for size, AR, BNF, SR, and bleb formation (P < 0.05). Parameters that had no significant differences between the two groups were height (P = 0.103), width (P = 0.078), neck width (P = 0.808), and H/W (P = 0.417). We conclude that MANs may be a useful model for the morphological analysis of intracranial aneurysm rupture. Larger size, higher AR, BNF, SR, and bleb formation may be related to rupture of PComA aneurysms. Larger sample studies minimizing the interference from patient-related factors and aneurysm type were expected for acquiring more accurate assessment of the relationship between these parameters and PComA aneurysm rupture. |
 CTA and 3D models of a pair of PComA-MAN. A-C. Axial, Sagittal and Coronal Ct images showing the ruptured PComA-MAN. D. Corresponding reconstructed 3D Slicer images. |
|
Publication: Zhonghua Wai Ke Za Zhi. 2015 May;53(5):340-4. PMID: 26082247 Authors: Bai S, Chen X, Geng J, Wu D, Yu X, Xu B. Institution: Department of Neurosurgery, People's Liberation Army General Hospital, Beijing, China. Background/Purpose: To investigate the clinical value of high-field-strength intraoperative magnetic resonance imaging (iMRI) combined with optic radiation neuro-navigation for the resection of temporal lobe low-grade gliomas. Methods: From April 2009 to September 2013, 65 patients with temporal lobe low-grade gliomas (WHO grade II) involving optic radiation were operated with iMRI and functional neuro-navigation. Diffusion tensor imaging (DTI) based fiber tracking was used to delineate optic radiation. The reconstructed optic radiations were integrated into a navigation system, in order to achieve intraoperative microscopic-based functional neuro-navigation. iMRI was used to update the images for both optic radiations and residual tumors. Volumetric analyses were performed using 3D Slicer for pre- and intra-operative tumor volumes in all cases. All patients were evaluated for visual field deficits preoperatively and postoperatively. The Student t test was used to evaluate the average rate of extent of resection between groups. Spearman rank correlation analysis was used to assess correlations between predictors and epilepsy prognosis. Results: Preoperative tumor volumes were (78±40) cm3. In 29 cases, iMRI scan detected residual tumor that could be further resected, and extent of resection were increased from 76.2% to 92.7% (t = 7.314, P <0.01). In 19 cases (29.2%), gross total resection was accomplished, and iMRI contributed directly to 8 of these cases. Postsurgical follow-up period varied from 13 months to 59 months, mean (33±13) months. Tumor progression were observed in 3 patients, newly developed or deteriorated visual field defects occurred in 4 patients (6.2%). For patients with pre-operative seizures, Engel Class I were achieved for 89.7% of them. Spearman rank correlation analysis revealed that seizure outcome (Engel Class) was related to increased excision of ratio (r = -0.452, P = 0.004, 95% CI: -0.636-0.261) and larger tumors (r = 0.391, P = 0.014, 95% CI: 0.178-0.484). CONCLUSIONS: With iMRI and functional neuro-navigation, the optic radiation can be accurately located, while extent of resection can be evaluated intra-operatively. This technique is safe and helpful for preservation of visual field for the resection of temporal lobe low-grade gliomas involving optic radiation. |
Reduced Bone Density and Vertebral Fractures in Smokers. Men and COPD Patients at Increased Risk
|
Publication: Ann Am Thorac Soc. 2015 May;12(5):648-56. PMID: 25719895 | PDF Authors: Jaramillo JD, Wilson C, Stinson DS, Lynch DA, Bowler RP, Lutz S, Bon JM, Arnold B, McDonald ML, Washko GR, Wan ES, DeMeo DL, Foreman MG, Soler X, Lindsay SE, Lane NE, Genant HK, Silverman EK, Hokanson JE, Make BJ, Crapo JD, Regan EA. COPDGene Investigators. Institution: National Jewish Health, Denver, CO, USA. Background/Purpose: Former smoking history and chronic obstructive pulmonary disease (COPD) are potential risk factors for osteoporosis and fractures. Under existing guidelines for osteoporosis screening, women are included but men are not, and only current smoking is considered. OBJECTIVES: To demonstrate the impact of COPD and smoking history on the risk of osteoporosis and vertebral fracture in men and women. METHODS: Characteristics of participants with low volumetric bone mineral density (vBMD) were identified and related to COPD and other risk factors. We tested associations of sex and COPD with both vBMD and fractures adjusting for age, race, body mass index (BMI), smoking, and glucocorticoid use. MEASUREMENTS AND MAIN RESULTS: vBMD by calibrated quantitative computed tomography (QCT), visually scored vertebral fractures, and severity of lung disease were determined from chest CT scans of 3,321 current and ex-smokers in the COPDGene study. Low vBMD as a surrogate for osteoporosis was calculated from young adult normal values. Male smokers had a small but significantly greater risk of low vBMD (2.5 SD below young adult mean by calibrated QCT) and more fractures than female smokers. Low vBMD was present in 58% of all subjects, was more frequent in those with worse COPD, and rose to 84% among subjects with very severe COPD. Vertebral fractures were present in 37% of all subjects and were associated with lower vBMD at each Global Initiative for Chronic Obstructive Lung Disease stage of severity. Vertebral fractures were most common in the midthoracic region. COPD and especially emphysema were associated with both low vBMD and vertebral fractures after adjustment for steroid use, age, pack-years of smoking, current smoking, and exacerbations. Airway disease was associated with higher bone density after adjustment for other variables. Calibrated QCT identified more subjects with abnormal values than the standard dual-energy X-ray absorptiometry in a subset of subjects and correlated well with prevalent fractures. CONCLUSIONS: Male smokers, with or without COPD, have a significant risk of low vBMD and vertebral fractures. COPD was associated with low vBMD after adjusting for race, sex, BMI, smoking, steroid use, exacerbations, and age. Screening for low vBMD by using QCT in men and women who are smokers will increase opportunities to identify and treat osteoporosis in this at-risk population. Funding:
|
Fibrin-based 3D Matrices Induce Angiogenic Behavior of Adipose-derived Stem Cells
|
Publication: Acta Biomater. 2015 Apr;17:78-88. PMID: 25600400 Authors: Chung E, Rytlewski JA, Merchant AG, Dhada KS, Lewis EW, Suggs LJ. Institution: Department of Biomedical Engineering, University of Texas at Austin, TX, USA. Background/Purpose: Engineered three-dimensional biomaterials are known to affect the regenerative capacity of stem cells. The extent to which these materials can modify cellular activities is still poorly understood, particularly for adipose-derived stem cells (ASCs). This study evaluates PEGylated fibrin (P-fibrin) gels as an ASC-carrying scaffold for encouraging local angiogenesis by comparing with two commonly used hydrogels (i.e., collagen and fibrin) in the tissue-engineering field. Human ASCs in P-fibrin were compared to cultures in collagen and fibrin under basic growth media without any additional soluble factors. ASCs proliferated similarly in all gel scaffolds but showed significantly elongated morphologies in the P-fibrin gels relative to other gels. P-fibrin elicited higher von Willebrand factor expression in ASCs than either collagen or fibrin while cells in collagen expressed more smooth muscle alpha actin than in other gels. VEGF was secreted more at 7days in fibrin and P-fibrin than in collagen and several other angiogenic and immunomodulatory cytokines were similarly enhanced. Fibrin-based matrices appear to activate angiogenic signaling in ASCs while P-fibrin matrices are uniquely able to also drive a vessel-like ASC phenotype. Collectively, these results suggest that P-fibrin promotes the angiogenic potential of ASC-based therapeutic applications.Z-stacks were pre-processed in ImageJ and exported as Visualization Toolkit files (.vtks) for import into 3D Slicer. Funding:
|
MIDA: A Multimodal Imaging-Based Detailed Anatomical Model of the Human Head and Neck
|
Publication: PLoS One. 2015 Apr 22;10(4):e0124126. PMID: 25901747 | PDF Authors: Iacono MI, Neufeld E, Akinnagbe E, Bower K, Wolf J, Vogiatzis Oikonomidis I, Sharma D, Lloyd B, Wilm BJ, Wyss M, Pruessmann KP, Jakab A, Makris N, Cohen ED, Kuster N, Kainz W, Angelone LM. Institution: Division of Biomedical Physics, Office of Science and Engineering Laboratories, Center for Devices and Radiological Health, US Food and Drug Administration, Silver Spring, MD, USA. Background/Purpose: Computational modeling and simulations are increasingly being used to complement experimental testing for analysis of safety and efficacy of medical devices. Multiple voxel- and surface-based whole- and partial-body models have been proposed in the literature, typically with spatial resolution in the range of 1-2 mm and with 10-50 different tissue types resolved. We have developed a multimodal imaging-based detailed anatomical model of the human head and neck, named "MIDA". The model was obtained by integrating three different magnetic resonance imaging (MRI) modalities, the parameters of which were tailored to enhance the signals of specific tissues: i) structural T1- and T2-weighted MRIs; a specific heavily T2-weighted MRI slab with high nerve contrast optimized to enhance the structures of the ear and eye; ii) magnetic resonance angiography (MRA) data to image the vasculature, and iii) diffusion tensor imaging (DTI) to obtain information on anisotropy and fiber orientation. The unique multimodal high-resolution approach allowed resolving 153 structures, including several distinct muscles, bones and skull layers, arteries and veins, nerves, as well as salivary glands. The model offers also a detailed characterization of eyes, ears, and deep brain structures. A special automatic atlas-based segmentation procedure was adopted to include a detailed map of the nuclei of the thalamus and midbrain into the head model. The suitability of the model to simulations involving different numerical methods, discretization approaches, as well as DTI-based tensorial electrical conductivity, was examined in a case-study, in which the electric field was generated by transcranial alternating current stimulation. The voxel- and the surface-based versions of the models are freely available to the scientific community. Funding:
|
Craniofacial Reconstruction using Rational Cubic Ball Curves
|
Publication: PLoS One. 2015 Apr 16;10(4):e0122854. PMID: 25880632 | PDF Authors: Majeed A, Mt Piah AR, Gobithaasan RU, Yahya ZR. Institution: Division of Science and Technology, University of Education, Town Ship Lahore, Pakistan. Background/Purpose: This paper proposes the reconstruction of craniofacial fracture using rational cubic Ball curve. The idea of choosing Ball curve is based on its robustness of computing efficiency over Bezier curve. The main steps are conversion of Digital Imaging and Communications in Medicine (Dicom) images to binary images, boundary extraction and corner point detection, Ball curve fitting with genetic algorithm and final solution conversion to Dicom format. The last section illustrates a real case of craniofacial reconstruction using the proposed method which clearly indicates the applicability of this method. A Graphical User Interface (GUI) has also been developed for practical application. Funding:
|
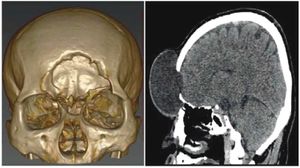 3D Slicer image of a patient with head injury. |
Age Related Differences in Diffusion Tensor Indices and Fiber Architecture in the Medial and Lateral Gastrocnemius
|
Publication: J Magn Reson Imaging. 2015 Apr;41(4):941-53. PMID: 24771672 | PDF Authors: Sinha U, Csapo R, Malis V, Xue Y, Sinha S. Institution: Department of Physics, San Diego State University, San Diego, CA, USA. Background/Purpose: To investigate age related changes in diffusion tensor indices and fiber architecture of the medial and lateral gastrocnemius (MG and LG) muscles using diffusion tensor imaging (DTI). MATERIALS AND METHODS: The lower leg of five young and five senior subjects was scanned at 3 Tesla and DTI indices extracted using three methods: region of interest, histogram, and tract based. Tracked fibers were automatically edited to ensure physiologically relevant tracks. Pennation angles were measured with respect to the deep and superficial aponeuroses of both muscles. RESULTS: The three methods provided internally consistent measures of the DTI indices (correlation coefficient in the range of 0.90-0.99). The primary, secondary, and tertiary eigenvalues in the MG and LG increased significantly in the senior cohort (P < 0.05), while the small increase in fractional anisotropy with age was not significant (MG/LG: P = 0.39/0.85; 95% confidence interval: [-0.059/-0.056, 0.116/0.064]). Fiber lengths of MG fibers originating distally were significantly decreased in seniors (P < 0.05) while pennation angles decreased with age in the MG and LG but this was not significant. CONCLUSION: Fiber atrophy and increased fibrosis have opposing effects on the diffusion indices resulting in a complicated dependence with aging. Fiber architectural changes could play a role in determining aging muscle function. Funding:
|
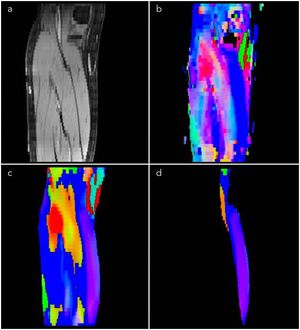 Comparison of eigenvector color maps from the original uncorrected DTI data to the corrected DTI data. The same anatomical slice is shown in all the images: fat saturated GRE image (a); eigenvector color map calculated from the uncorrected data (b); eigenvector color map calculated from the distortion corrected and smoothed data with the lower leg mask from (a) excluding subcutaneous fat (c); and medial gastrocnemius mask from (a) applied to the corrected, smoothed eigenvector (d). Distortion and motion algorithm from the 3D Slicer has been used in brain DTI analysis. |
Volumetric Alterations in the Nucleus Accumbens and Caudate Nucleus in Bulimia Nervosa: A Structural Magnetic Resonance Imaging Study
|
Publication: Int J Eat Disord. 2015 Mar;48(2):206-14. PMID: 24634102 Authors: Coutinho J, Ramos AF, Maia L, Castro L, Conceição E, Geliebter A, Machado PP, Gonçalves O, Sampaio A. Institution: Neuropsychophysiology Lab, CIPsi, School of Psychology, University of Minho, Braga, Portugal. Background/Purpose: Bulimia nervosa (BN) is an eating disorder characterized by recurrent episodes of binge eating and inappropriate compensatory behaviors (such as purging, fasting, or excessive exercise) to prevent weight gain. BN has been associated with deficits in inhibitory control processes. The basal ganglia specifically, the nucleus accumbens (NAc) and the caudate nucleus (CN) are part of the frontostriatal circuits involved in inhibitory control. The main goal of this study was to investigate the presence of morphological alterations in the NAc and the CN in a sample of patients diagnosed with BN. Method: Forty-one female participants, 21 diagnosed with BN and 20 healthy matched controls (HC), underwent a structural magnetic resonance imaging (MRI) acquisition and clinical assessment. The NAc and the CN were manually segmented using the software 3D Slicer. The results reveal a significant volumetric decrease in the CN and a preserved NAc volume in BN compared to the control group. Discussion: These findings suggest a contributory role of the caudate nucleus part of the dorsal striatum in the psychopathology of BN. |
Validation of Osteoarthritis Synthetic Defect Database via Non-rigid Registration
|
Publication: Proc SPIE Int Soc Opt Eng. 2015 Mar 17;9417. PMID: 26236073| PDF Authors: Paniagua B, Pera J, Budin F, Gomes L, Styner M, Lucia C, Nguyen T. Institution: Computer Science and Orthodontics, Departments of Psychiatry, University of North Carolina at Chapel Hill, NC, USA. Background/Purpose: Temporomandibular joint (TMJ) disorders are a group of conditions that cause pain and dysfunction in the jaw joint and the muscles controlling jaw movement. However, diagnosis and treatment of these conditions remain controversial. To date, there is no single sign, symptom, or test that can clearly diagnose early stages of osteoarthritis (OA). Instead, the diagnosis is based on a consideration of several factors, including radiological evaluation. The current radiological diagnosis scores of TMJ pathology are subject to misdiagnosis. We believe these scores are limited by the acquisition procedures, such as oblique cuts of the CT and head positioning errors, and can lead to incorrect diagnoses of flattening of the head of the condyle, formation of osteophytes, or condylar pitting. This study consists of creating and validating a methodological framework to simulate defects in CBCT scans of known location and size, in order to create synthetic TMJ OA database. User-generated defects were created using a non-rigid deformation protocol in CBCT. All segmentation evaluation, surface distances and linear distances from the user-generated to the simulated defects showed our methodological framework to be very precise and within a voxel (0.5 mm) of magnitude. A TMJ OA synthetic database will be created next, and evaluated by expert radiologists, and this will serve to evaluate how sensitive the current radiological diagnosis tools are. Using linear distances in 3D Slicer, we manually measured the defect depth on the deformed segmentation and the deformed grey-scale CBCT. Funding:
|
Validation of CBCT for the Computation of Textural Biomarkers
|
Publication: Proc SPIE Int Soc Opt Eng. 2015 Mar 17;9417. PMID: 26085710| PDF Authors: Paniagua B, Ruellas AC, Benavides E, Marron S, Woldford L, Cevidanes L. Institution: Departments of Psychiatry, Computer Science and Orthodontics, University of North Carolina at Chapel Hill, NC, USA. Background/Purpose: Osteoarthritis (OA) is associated with significant pain and 42.6% of patients with TMJ disorders present with evidence of TMJ OA. However, OA diagnosis and treatment remain controversial, since there are no clear symptoms of the disease. The subchondral bone in the TMJ is believed to play a major role in the progression of OA. We hypothesize that the textural imaging biomarkers computed in high resolution Conebeam CT (hr-CBCT) and μCT scans are comparable. The purpose of this study is to test the feasibility of computing textural imaging biomarkers in-vivo using hr-CBCT, compared to those computed in μCT scans as our Gold Standard. Specimens of condylar bones obtained from condylectomies were scanned using μCT and hr-CBCT. Nine different textural imaging biomarkers (four co-occurrence features and five run-length features) from each pair of μCT and hr-CBCT were computed and compared. Pearson correlation coefficients were computed to compare textural biomarkers values of μCT and hr-CBCT. Four of the nine computed textural biomarkers showed a strong positive correlation between biomarkers computed in μCT and hr-CBCT. Higher correlations in Energy and Contrast, and in GLN (grey-level non-uniformity) and RLN (run length non-uniformity) indicate quantitative texture features can be computed reliably in hr-CBCT, when compared with μCT. The textural imaging biomarkers computed in-vivo hr-CBCT have captured the structure, patterns, contrast between neighboring regions and uniformity of healthy and/or pathologic subchondral bone. The ability to quantify bone texture non-invasively now makes it possible to evaluate the progression of subchondral bone alterations, in TMJ OA. Funding:
|
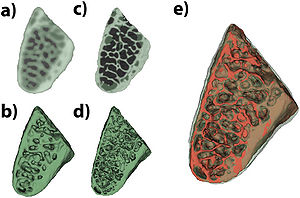 3D segmentations and virtual models for hr-CBCT (a and b, respectively) and μCT (c and d, respectively) e) 3D virtual models for hr-CBCT (green semitransparent) and μCT (red solid) compared. Three-dimensional virtual models of the condyles and trabeculae for each sample were built using 3D Slicer software. |
Comparison between an Alternative and the Classic Definition of Chronic Bronchitis in COPDGene
|
Publication: Ann Am Thorac Soc. 2015 Mar;12(3):332-9. PMID: 25575351 Authors: Kim V, Crapo J, Zhao H, Jones PW, Silverman EK, Comellas AP, Make BJ, Criner GJ; the COPDGene Investigators. Institution: Temple University, Pulmonary and Critical Care Medicine, Philadelphia, PA, USA. Background/Purpose: Previous studies on chronic bronchitis (CB) have used varying definitions. We sought to compare an alternative CB definition using the St. George's Respiratory Questionnaire, a commonly used assessment tool, with the classic definition and to investigate if it had independent or additive value. Methods: We analyzed data from 4513 GOLD 1-4 subjects in the COPDGene cohort. We compared the classic definition of CB with the SGRQ definition, defined by their answers to the questions about both cough and phlegm. We compared the Classic CB+ vs. CB- groups, and the SGRQ CB+ and CB- groups. We also analyzed the cohort split into four groups: Classic CB+/SGRQ CB+, Classic CB+/SGRQ CB-, Classic CB-/SGRQ CB+, Classic CB-/SGRQ CB-. Results: 26.1% were Classic CB+, whereas 39.9% were SGRQ CB+. When the SGRQ definition was compared with the Classic CB definition, using this as the gold standard, the SGRQ CB definition had a sensitivity and specificity of 0.87 and 0.77, respectively. The SGRQ CB+ and Classic CB+ groups were strikingly similar with more respiratory symptoms, exacerbations, worse lung function, and greater airway wall thickness. In addition, the Classic CB+/SGRQ CB+, Classic CB+/SGRQ CB-, Classic CB-/SGRQ CB+ groups shared similar characteristics as well. Conclusions: The SGRQ CB definition identifies more subjects with chronic cough and sputum that share a similar phenotype identified by the Classic CB definition. The addition of the SGRQ CB definition to the classic one can be used to identify more COPD patients at risk for poor outcomes. Funding:
|
Quantitative Trait Loci Affecting the 3D Skull Shape and Size in Mouse and Prioritization of Candidate Genes in-silico
|
Publication: Front Physiol. 2015 Mar 26;6:92. PMID: 25859222 | PDF Authors: Maga AM, Navarro N, Cunningham ML, Cox TC. Institution: Division of Craniofacial Medicine, Department of Pediatrics, University of Washington Seattle, WA, USA. Background/Purpose: We describe the first application of high-resolution 3D micro-computed tomography, together with 3D landmarks and geometric morphometrics, to map QTL responsible for variation in skull shape and size using a backcross between C57BL/6J and A/J inbred strains. Using 433 animals, 53 3D landmarks, and 882 SNPs from autosomes, we identified seven QTL responsible for the skull size (SCS.qtl) and 30 QTL responsible for the skull shape (SSH.qtl). Size, sex, and direction-of-cross were all significant factors and included in the analysis as covariates. All autosomes harbored at least one SSH.qtl, sometimes up to three. Effect sizes of SSH.qtl appeared to be small, rarely exceeding 1% of the overall shape variation. However, they account for significant amount of variation in some specific directions of the shape space. Many QTL have stronger effect on the neurocranium than expected from a random vector that will parcellate uniformly across the four cranial regions. On the contrary, most of QTL have an effect on the palate weaker than expected. Combined interval length of 30 SSH.qtl was about 315 MB and contained 2476 known protein coding genes. We used a bioinformatics approach to filter these candidate genes and identified 16 high-priority candidates that are likely to play a role in the craniofacial development and disorders. Thus, coupling the QTL mapping approach in model organisms with candidate gene enrichment approaches appears to be a feasible way to identify high-priority candidates genes related to the structure or tissue of interest. Funding:
|
Automatic Segmentation of Deep Intracerebral Electrodes in Computed Tomography Scans
|
Publication: BMC Bioinformatics. 2015 Mar 25;16(1):99. PMID: 25887573 | PDF Authors: Arnulfo G, Narizzano M, Cardinale F, Fato MM, Palva JM. Institution: Department of Informatics, Bioengineering, Robotics and System Engineering - DIBRIS, University of Genoa, Genoa, Italy. Background/Purpose: Invasive monitoring of brain activity by means of intracerebral electrodes is widely practiced to improve pre-surgical seizure onset zone localization in patients with medically refractory seizures. Stereo-Electroencephalography (SEEG) is mainly used to localize the epileptogenic zone and a precise knowledge of the location of the electrodes is expected to facilitate the recordings interpretation and the planning of resective surgery. However, the localization of intracerebral electrodes on post-implant acquisitions is usually time-consuming (i.e., manual segmentation), it requires advanced 3D visualization tools, and it needs the supervision of trained medical doctors in order to minimize the errors. In this paper we propose an automated segmentation algorithm specifically designed to segment SEEG contacts from a thresholded post-implant Cone-Beam CT volume (0.4 mm, 0.4 mm, 0.8 mm). The algorithm relies on the planned position of target and entry points for each electrode as a first estimation of electrode axis. We implemented the proposed algorithm into DEETO, an open source C++ prototype based on ITK library. Funding:
|
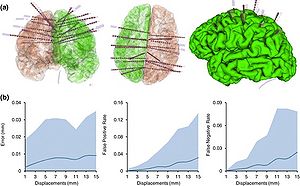 Results of the DEETO algorithm on complex scenarios. (a) The figure shows the accuracy of the reconstructed implant. The complexity of SEEG implants is well represented in the figure where it can be easily seen the high number of electrodes used, their direction, and their proximity to each others. Moreover, we superimposed pial surfaces (green - left and red - right) extracted from the MRI previously coregistered to CT space. Original electrode surface models extracted from patient CT (shaded gray) are overlayed by segmented contacts (red cylinder) with their real dimensions (i.e., each cylinder is 2 mm long, 0.8 mm diameter and inter-contact distance is 1.5 mm). (b) The proposed implementation is robust to target point displacements. Target displacements (left plot) up to 12 mm from planned site result in an average error of 0.005 mm (blue line). The number of False Positive (FP; central plot) and False Negative (FN; right plot) divided by the total number of real contacts increase with target point displacements but remained below 10% for distances up to 13 mm. Shaded area in all plots indicate the interval between the 95th and the 5th percentiles extracted from 28 subjects and 5 samples for each distance (see methods for details). |
Openigtlink Interface for State Control and Visualisation of a Robot for Image-Guided Therapy Systems
|
Publication: Int J Comput Assist Radiol Surg. 2015 Mar;10(3):285-92. PMID: 24923473 Authors: Tauscher S, Tokuda J, Schreiber G, Neff T, Hata N, Ortmaier T. Institution: Institute of Mechatronic Systems, Leibniz Universität, Hannover, Germany. Background/Purpose: The integration of a robot into an image-guided therapy system is still a time consuming process, due to the lack of a well-accepted standard for interdevice communication. The aim of this project is to simplify this procedure by developing an open interface based on three interface classes: state control, visualisation, and sensor. A state machine on the robot control is added to the concept because the robot has its own workflow during surgical procedures, which differs from the workflow of the surgeon. Methods: A KUKA Light Weight Robot is integrated into the medical technology environment of the Institute of Mechatronic Systems as a proof of concept. Therefore, 3D Slicer was used as visualisation and state control software. For the network communication the OpenIGTLink protocol was implemented. In order to achieve high rate control of the robot the "KUKA Sunrise. Connectivity SmartServo" package was used. An exemplary state machine providing states typically used by image-guided therapy interventions, was implemented. Two interface classes, which allow for a direct use of OpenIGTLink for robot control on the one hand and visualisation on the other hand were developed. Additionally, a 3D Slicer module was written to operate the state control. Utilising the described software concept the state machine could be operated by the 3D Slicer module with 20 Hz cycle rate and no data loss was detected during a test phase of approximately [Formula: see text] (13,640 packages). Furthermore, the current robot pose could be sent with more than 60 Hz. No influence on the performance of the state machine by the communication thread could be measured. Conclusion: Simplified integration was achieved by using only one programming context for the implementation of the state machine, the interfaces, and the robot control. Eventually, the exemplary state machine can be easily expanded by adding new states. |
|
Publication: J Laryngol Otol. 2015 Mar;129 Suppl 2:S62-8. PMID: 25706165 Authors: Kamizono K, Yoshida S, Cho B, Matsumoto N, Fukushima J, Jinnouchi M, Ouchida R, Sawatsubashi M, Hashizume M, Komune S. Institution: Department of Otorhinolaryngology, Graduate School of Medical Sciences, Kyushu University, Fukuoka, Japan. Background/Purpose: Bone contouring is currently the best treatment for fibro-osseous lesions after bone growth arrest. Navigation systems available for this surgery allow intra-operative visualisation with improved cosmetic outcomes. However, conventional navigation systems using superficial skin registration cannot prevent subtle discrepancies. Method: To address this problem, we used a non-invasive cranial bone registration that uses patient-specific dental templates to maintain exact registration. We created the preset goal using the mirror image of the unaffected side for unilateral lesions, and using images obtained before the onset of symptoms for bilateral lesions. This system achieved precise pre-operative simulation. A sound aid in the navigation system provided information regarding proximity to critical structures and to the preset goal. Results: We used this system to contour fibro-osseous lesions in three patients. All patients achieved good facial contours and improvement in symptoms. Conclusions: This method offers a safe, rapid surgical aid in treating orbital fibro-osseous lesions. The data were imported to an open-source image- guided surgery software program 3D Slicer. |
Open Source Software in a Practical Approach for Post Processing of Radiologic Images
|
Publication: Radiol Med. 2015 Mar;120(3):309-23. PMID: 25024063 Authors: Valeri G, Mazza FA, Maggi S, Aramini D, La Riccia L, Mazzoni G, Giovagnoni A. Institution: Clinical Radiology, AOU Ospedali Riuniti, Ancona, Italy. Background/Purpose: The purpose of this paper is to evaluate the use of open source software (OSS) to process DICOM images. We selected 23 programs for Windows and 20 programs for Mac from 150 possible OSS programs including DICOM viewers and various tools (converters, DICOM header editors, etc.). The programs selected all meet the basic requirements such as free availability, stand-alone application, presence of graphical user interface, ease of installation and advanced features beyond simple display monitor. Capabilities of data import, data export, metadata, 2D viewer, 3D viewer, support platform and usability of each selected program were evaluated on a scale ranging from 1 to 10 points. Results: Twelve programs received a score higher than or equal to eight. Among them, five obtained a score of 9, 3D Slicer, MedINRIA, MITK 3M3, VolView, VR Render; while OsiriX received 10. Conclusions: OsiriX appears to be the only program able to perform all the operations taken into consideration, similar to a workstation equipped with proprietary software, allowing the analysis and interpretation of images in a simple and intuitive way. OsiriX is a DICOM PACS workstation for medical imaging and software for image processing for medical research, functional imaging, 3D imaging, confocal microscopy and molecular imaging. This application is also a good tool for teaching activities because it facilitates the attainment of learning objectives among students and other specialists. |
Functional Mapping of the Human Visual Cortex with Intravoxel Incoherent Motion MRI
|
Publication: PLoS One. 2015 Feb 3;10(2):e0117706 PMID: 25647423 | PDF Authors: Federau C, O'Brien K, Birbaumer A, Meuli R, Hagmann P, Maeder P. Institution: Department of Diagnostic and Interventional Radiology, Centre Hospitalier Universitaire Vaudois (CHUV), Lausanne, Switzerland. Background/Purpose: Functional imaging with intravoxel incoherent motion (IVIM) magnetic resonance imaging (MRI) is demonstrated. Images were acquired at 3 Tesla using a standard Stejskal-Tanner diffusion-weighted echo-planar imaging sequence with multiple b-values. Cerebro-spinal fluid signal, which is highly incoherent, was suppressed with an inversion recovery preparation pulse. IVIM microvascular perfusion parameters were calculated according to a two-compartment (vascular and non-vascular) diffusion model. The results obtained in 8 healthy human volunteers during visual stimulation are presented. The IVIM blood flow related parameter fD* increased 170% during stimulation in the visual cortex, and 70% in the underlying white matter. |
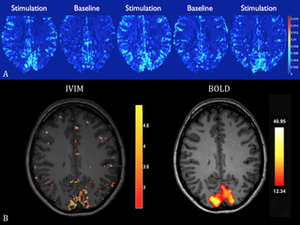 IVIM flow subtraction maps. Maps of the difference in blood flow related IVIM parameter fD*, in all volunteers (except the one already shown in Fig. 2), as obtained by subtracting the averaged flow maps obtained under baseline to the averaged maps obtained under visual stimulation. Scale of the colorbar: 10-3 mm2·s-1. The corresponding BOLD statistical t-map is given below each IVIM subtraction map. Those maps were registered to the IVIM space using 3D Slicer. |
Factors Affecting Capsular Volume Changes and Association with Outcomes after Bankart Repair and Capsular Shift
|
Publication: Am J Sports Med. 2015 Feb;43(2):428-38. PMID: 25492036 Authors: Park JY, Chung SW, Kumar G, Oh KS, Choi JH, Lee D, Park S. Institution: Department of Orthopaedic Surgery, Konkuk University School of Medicine, Seoul, Korea. Background/Purpose: Capsular laxity is a main contributing factor in recurrent shoulder instability and is suggested to be correlated with increased capsular volume. Arthroscopic capsular shift combined with Bankart repair can reduce the capsular volume and reinforce the redundant capsule; however, as the capsuloligamentous structure has viscoelastic properties, it is possible for the shifted and tensioned capsule of the glenohumeral joint to slowly stretch out again over time, resulting in an increase in capsular volume. Purpose: To analyze changes in capsular volume of the glenohumeral joint over time after arthroscopic Bankart repair and capsular shift, the factors associated with these changes, and their relevance to outcomes. Study Design: Case series; Level of evidence, 4. Methods: Included in this study were 105 patients (mean age, 25.8 ± 8.2 years) who underwent arthroscopic Bankart repair and capsular shift for anterior shoulder instability and computed tomography arthrography (CTA) at 3 months and 1 year postoperatively and whose various functional outcomes were evaluated preoperatively and at the last follow-up (>12 months). Among these patients, 27 also had preoperative CTA. These 27 patients were used to make comparisons between preoperative and 3-month postoperative CTA measurements, and all 105 patients were used for all other comparisons. Two raters measured the separate anterior and posterior capsular volume and cross-sectional area at the 5-o'clock position using 3-dimensional 3D Slicer software. These measurements were subsequently adjusted for each glenoid size. The changes in capsular volume and cross-sectional area at the 5-o'clock position over time, the factors related to higher change in anterior capsular volume, and their correlation with outcomes were evaluated. Results: Three months postoperatively, the total and anterior capsular volume and anterior cross-sectional area significantly decreased; however, these values increased again at 1 year postoperatively (all P < .01). The inter- and intraobserver reliabilities of the measurements were excellent (interclass correlation coefficient = 0.717-0.945). Female sex, being an elite athlete, and more dislocations before surgery were related to a higher increase in anterior capsular volume at 1 year (all P < .05). Eight patients had redislocation, and 18 exhibited positive apprehension test postoperatively, and these patients showed significantly higher increases in anterior and total capsular volume at 1 year than did those without redislocation or positive apprehension sign (all P < .01). However, with the exception of Rowe score, a higher increase in anterior capsular volume was not related to functional outcome measures. Conclusion: Surgeons should be aware of the re-increase in anterior capsular volume or restretching trait of the anterior capsule over time, even after successful arthroscopic Bankart repair and capsular shift. In this study, women, elite athletes, and those with frequent dislocations were at high risk of capsular restretching. An increase in capsular volume was related to redislocation and positive apprehension sign as well as with Rowe score. |
A Gradient in Cortical Pathology in Multiple Sclerosis by in vivo Quantitative 7 T Imaging
|
Publication: Brain. A Journal of Neurology. 2015 Feb; 138(2):1-14. PMID: 25681411| PDF Authors: Mainero C, Louapre C, Govindarajan ST, Gianni C, Nielsen AS, Cohen-Adad J, Sloane J, Kinkel RP. Institution: A. Martinos Center for Biomedical Imaging, Massachusetts General Hospital, Boston, MA, USA. Background/Purpose: We used a surface-based analysis of T2* relaxation rates at 7 T magnetic resonance imaging, which allows sampling quantitative T2* throughout the cortical width, to maP < in vivo the spatial distribution of intracortical pathology in multiple sclerosis. Ultra- high resolution quantitative T2* maps were obtained in 10 subjects with clinically isolated syndrome/early multiple sclerosis (< 3 years disease duration), 18 subjects with relapsing-remitting multiple sclerosis ( > 4 years disease duration), 13 subjects with secondary progressive multiple sclerosis, and in 17 age-matched healthy controls. Quantitative T2* maps were registered to anatomical cortical surfaces for sampling T2* at 25%, 50% and 75% depth from the pial surface. Differences in laminar quan- titative T2* between each patient grouP < and controls were assessed using general linear model ( P < 0.05 corrected for multiple comparisons). In all 41 multiple sclerosis cases, we tested for associations between laminar quantitative T2* , neurological disability, Multiple Sclerosis Severity Score, cortical thickness, and white matter lesions. In patients, we measured, T2* in intracortical lesions and in the intracortical portion of leukocortical lesions visually detected on 7 T scans. Cortical lesional T2* was compared with patients’ normal-appearing cortical grey matter T2* (paired t -test) and with mean cortical T2* in controls (linear regression using age as nuisance factor). Subjects with multiple sclerosis exhibited relative to controls, independent from cortical thickness, signifi- cantly increased T2* , consistent with cortical myelin and iron loss. In early disease, T2* changes were focal and mainly confined at 25% depth, and in cortical sulci. In later disease stages T2* changes involved deeper cortical laminae, multiple cortical areas and gyri. In patients, T2* in intracortical and leukocortical lesions was increased compared with normal-appearing cortical grey matter ( P < 10 -10 and P < 10 -7 ), and mean cortical T2* in controls ( P < 10 -5 and P < 10 -6 ). In secondary progressive multiple sclerosis, T2* in normal-appearing cortical grey matter was significantly increased relative to controls ( P < 0.001). Laminar T2* changes may, thus, result from cortical pathology within and outside focal cortical lesions. Neurological disability and Multiple Sclerosis Severity Score correlated each with the degree of laminar quantitative T2* changes, independently from white matter lesions, the greatest association being at 25% depth, while they did not correlate with cortical thickness and volume. These findings demonstrate a gradient in the expression of cortical pathology throughout stages of multiple sclerosis, which was associated with worse disability and provides in vivo evidence for the existence of a cortical pathological process driven from the pial surface. Funding:
|
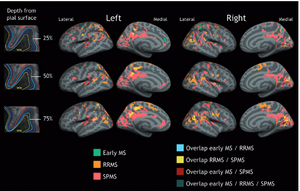 Quantitative T2* differences between multiple sclerosis patients and controls. Overlay of the GLM significance maps ( P < 0.05 corrected for multiple comparisons) on the average pial surface showing in the three subgroups of patients, early multiple sclerosis (MS), RRMS and SPMS, clusters of increased T2* relaxation time relative to healthy controls at 25% ( top row ), 50% ( middle row ), and 75% depth ( bottom row ) from the pial surface, as well as overlap of significant clusters across patients’ subgroups. In early disease, quantitative T2* changes were focal and mainly confined to the juxtameningeal cortex, and cortical sulci (darker grey areas); in RRMS and SPMS quantitative T2* changes involved deeper cortical laminae, and multiple cortical areas. WM = white matter. White matter lesion volume (mm3) was assessed from white matter lesions segmented on magnitude images from 7T single-echo FLASH T2* scans using a semi-automated method implemented in 3D Slicer version 4.2.0. |
Role of Mri-Based Tumor Volume Measurements in Surgical Treatment of Breast Cancer
|
Publication: Medical Diploma Thesis, 2015 Feb. (in Hungarian). | PDF Authors: Meszaros A. Institution: Sebészeti Klinika, Szegedi Tudomány Egyetem Általános Orvostudományi Kar, Szeged, Hungary. Background/Purpose: Szakdolgozatomban az MRI alapján mért tumortérfogat lehetséges szerepét vizsgáltam az emlőrák sebészeti kezelése során alkalmazott indikációk megerősítésében illetve megkönnyítésében. Az első vizsgálat során az SZTE ÁOK Sebészeti Klinikán a 2013. január 1 és 2014. április 9 közötti időszakban 60, emlőrák miatt operált és primer szisztémás (neoadjuváns) kemoterápiában nem részesült beteg; a második vizsgálat során pedig a 2012.06.05 és 2014.09.23 közötti időszakban 16, emlőrák miatt operált és (TEX-protokoll szerinti) primer szisztémás kezelésben részesült beteg MRI-vizsgálatai alapján a 3D Slicer szoftver segítségével retrospektíve meghatároztuk a primer tumor, illetve -a neoadjuváns terápiát követően- a regrediált tumor térfogatát. A műtéti indikáció felállításához előzetes biopsziás mintavétel történt. A daganatok és őrszem és/vagy további axillaris nyirokcsomók sebészi eltávolítását követően a preparátumok végleges szövettani eredményeivel hasonlítottuk össze a mérési eredményeket. A vizsgálatok során az alábbi 4 cut-off pontot kaptuk: 1624,9 mm³-nél állapítottuk meg a határt, ami felett az elváltozás már tapintható (AUC:0,861). 3439,02 mm³ az a pont, ami felett valószínűsíthető a pozitív SNB előfordulása (AUC: 0,636). 4029,2 mm³ az a tumortérfogat, amely felett megnő a hónalji áttétképzés valószínűsége (AUC: 0,645) 4688,38 mm³ felett az onko-team mastectomia végzését javasolja (AUC: 0,642). A tumortérfogat-tapinthatóság tekintetében bizonyítható összefüggést találtunk, a többi hat vizsgált hipotézis közül az észlelhető tendencia ellenére egyik sem bizonyult megalapozottnak 5%-os szignifikanciaszinten. Ebből 4 esetben a várt eredménytől való elmaradást magyarázhatja a viszonylag kis minták alkalmazása (kevés beteg) és extrém szélsőértékek (így nagy szórás) megjelenése. Ezeket a lehetséges okokat a jövőben kiküszöbölve a kapott prediktív értékek javíthatóak lehetnek. Az MRI-vizsgálat során meghatározott tumortérfogat a sebészi kezelésben könnyebbséget jelent a tumor emlőállományon belüli elhelyezkedésének és kiterjedésének megítélésében, és így a műtéti típus megválasztásában is. Jelen előkísérletünk eredményének segítségével megtervezhetünk egy olyan következő progresszív vizsgálatot, melyben a betegszám növelésével és a beválasztási kritériumok finomításával pontosabb képet kaphatunk a tumortérfogat prognosztikai szerepéről. |
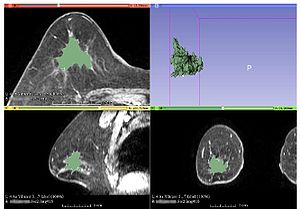 Axial (red), sagittal (yellow) and coronal (green) view of the tumor segmentation and the 3D model of the breast tumor (right upper quadrant)using 3D Slicer. |
Factors Affecting Capsular Volume Changes and Association with Outcomes after Bankart Repair and Capsular Shift
|
Publication: Am J Sports Med. 2015 Feb;43(2):428-38. PMID: 25492036 Authors: Park JY, Chung SW, Kumar G, Oh KS, Choi JH, Lee D, Park S. Institution: Department of Orthopaedic Surgery, Konkuk University School of Medicine, Seoul, Korea. Background/Purpose: Capsular laxity is a main contributing factor in recurrent shoulder instability and is suggested to be correlated with increased capsular volume. Arthroscopic capsular shift combined with Bankart repair can reduce the capsular volume and reinforce the redundant capsule; however, as the capsuloligamentous structure has viscoelastic properties, it is possible for the shifted and tensioned capsule of the glenohumeral joint to slowly stretch out again over time, resulting in an increase in capsular volume. To analyze changes in capsular volume of the glenohumeral joint over time after arthroscopic Bankart repair and capsular shift, the factors associated with these changes, and their relevance to outcomes. Methods: Included in this study were 105 patients (mean age, 25.8 ± 8.2 years) who underwent arthroscopic Bankart repair and capsular shift for anterior shoulder instability and computed tomography arthrography (CTA) at 3 months and 1 year postoperatively and whose various functional outcomes were evaluated preoperatively and at the last follow-up (>12 months). Among these patients, 27 also had preoperative CTA. These 27 patients were used to make comparisons between preoperative and 3-month postoperative CTA measurements, and all 105 patients were used for all other comparisons. Two raters measured the separate anterior and posterior capsular volume and cross-sectional area at the 5-o'clock position using 3-dimensional 3D Slicer software. These measurements were subsequently adjusted for each glenoid size. The changes in capsular volume and cross-sectional area at the 5-o'clock position over time, the factors related to higher change in anterior capsular volume, and their correlation with outcomes were evaluated. Results: Three months postoperatively, the total and anterior capsular volume and anterior cross-sectional area significantly decreased; however, these values increased again at 1 year postoperatively (all P < .01). The inter- and intraobserver reliabilities of the measurements were excellent (interclass correlation coefficient = 0.717-0.945). Female sex, being an elite athlete, and more dislocations before surgery were related to a higher increase in anterior capsular volume at 1 year (all P < .05). Eight patients had redislocation, and 18 exhibited positive apprehension test postoperatively, and these patients showed significantly higher increases in anterior and total capsular volume at 1 year than did those without redislocation or positive apprehension sign (all P < .01). However, with the exception of Rowe score, a higher increase in anterior capsular volume was not related to functional outcome measures. Conclusions: Surgeons should be aware of the re-increase in anterior capsular volume or restretching trait of the anterior capsule over time, even after successful arthroscopic Bankart repair and capsular shift. In this study, women, elite athletes, and those with frequent dislocations were at high risk of capsular restretching. An increase in capsular volume was related to redislocation and positive apprehension sign as well as with Rowe score. |
B-Mode and Acoustic Radiation Force Impulse (ARFI) Imaging of Prostate Zonal Anatomy: Comparison with 3T T2-Weighted MR Imaging
|
Publication: Ultrason Imaging. 2015 Jan;37(1):22-41. PMID: 25060914 | | PDF Authors: Palmeri ML, Miller ZA, Glass TJ, Garcia-Reyes K, Gupta RT, Rosenzweig SJ, Kauffman C, Polascik TJ, Buck A, Kulbacki E, Madden J, Lipman SL, Rouze NC, Nightingale KR. Institution: Duke University Pratt School of Engineering, NC, USA. Background/Purpose: Prostate cancer (PCa) is the most common non-cutaneous malignancy among men in the United States and the second leading cause of cancer-related death. Multi-parametric magnetic resonance imaging (mpMRI) has gained recent popularity to characterize PCa. Acoustic Radiation Force Impulse (ARFI) imaging has the potential to aid PCa diagnosis and management by using tissue stiffness to evaluate prostate zonal anatomy and lesions. MR and B-mode/ARFI in vivo imaging datasets were compared with one another and with gross pathology measurements made immediately after radical prostatectomy. Images were manually segmented in 3D Slicer to delineate the central gland (CG) and prostate capsule, and 3D models were rendered to evaluate zonal anatomy dimensions and volumes. Both imaging modalities showed good correlation between estimated organ volume and gross pathologic weights. Ultrasound and MR total prostate volumes were well correlated (R 2 = 0.77), but B-mode images yielded prostate volumes that were larger (16.82% ± 22.45%) than MR images, due to overestimation of the lateral dimension (18.4% ± 13.9%), with less significant differences in the other dimensions (7.4% ± 17.6%, anterior-to-posterior, and -10.8% ± 13.9%, apex-to-base). ARFI and MR CG volumes were also well correlated (R 2 = 0.85). CG volume differences were attributed to ARFI underestimation of the apex-to-base axis (-28.8% ± 9.4%) and ARFI overestimation of the lateral dimension (21.5% ± 14.3%). B-mode/ARFI imaging yielded prostate volumes and dimensions that were well correlated with MR T2-weighted image (T2WI) estimates, with biases in the lateral dimension due to poor contrast caused by extraprostatic fat. B-mode combined with ARFI imaging is a promising low-cost, portable, real-time modality that can complement mpMRI for PCa diagnosis, treatment planning, and management. |
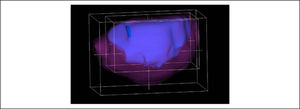 An example of the 3D Slicer ROI tool surrounding the prostate capsule (magenta) and central gland (blue) of study subject. This ROI tool is used to find the tri-axial dimensions of the prostate, in both the ultrasound and MR image datasets. MR = magnetic resonance. |
Optical Polarization Tractography Revealed Significant Fiber Disarray in Skeletal Muscles of a Mouse Model for Duchenne Muscular Dystrophy
|
Publication: Biomed Opt Express. 2015 Jan 7;6(2):347-52. PMID: 25780728 | PDF Authors: Wang Y, Zhang K, Wasala NB, Duan D, Yao G. Institution: Department of Bioengineering, Department of Molecular Microbiology & Immunology, University of Missouri, Columbia, MO, USA. Background/Purpose: Optical polarization tractography (OPT) was recently developed to visualize tissue fiber architecture with cellular-level resolution and accuracy. In this study, we explored the feasibility of using OPT to study muscle disease in the mdx4cv mouse model of Duchenne muscular dystrophy. The freshly dissected tibialis anterior muscles of mdx4cv and normal mice were imaged. A "fiber disarray index" (FDI) was developed to quantify the myofiber disorganization. In necrotic muscle regions of the mdx4cv mice, the FDI was significantly elevated and can be used to segment the 3D necrotic regions for assessing the overall muscle damage. These results demonstrated the OPT's capability for imaging microscopic fiber alternations in muscle research.
|
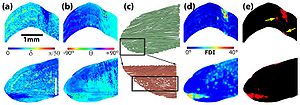 The corresponding images of local (a) retardance and (b) optical axis at the same imaging locations as in Fig. 1. The size bars in (a) indicate 1 mm. (c) OPT fiber tractography obtained in the same en face plane as in Fig. 1. (d) The image of fiber disarray index. (e) Image segmentation using the disarray index (threshold = 16°). Yellow arrows indicate small necrotic regions corresponding to those marked in Fig. 1(d). The tractographic image was constructed based on the local optical axis using the streamline functionality in MATLAB and visualized using the 3D Slicer software. |
Hippocampal Volume is Reduced in Schizophrenia and Schizoaffective Disorder but Not in Psychotic Bipolar I Disorder Demonstrated by Both Manual Tracing and Automated Parcellation (Freesurfer)
|
Publication: Schizophr Bull. 2015 Jan;41(1):233-49. PMID: 24557771 | PDF Authors: Arnold SJ, Ivleva EI, Gopal TA, Reddy AP, Jeon-Slaughter H, Sacco CB, Francis AN, Tandon N, Bidesi AS, Witte B, Poudyal G, Pearlson GD, Sweeney JA, Clementz BA, Keshavan MS, Tamminga CA. Institution: Department of Psychiatry, UT Southwestern Medical Center, Dallas, TX, USA. Background/Purpose: This study examined hippocampal volume as a putative biomarker for psychotic illness in the Bipolar-Schizophrenia Network on Intermediate Phenotypes (B-SNIP) psychosis sample, contrasting manual tracing and semiautomated (FreeSurfer) region-of-interest outcomes. The study sample (n = 596) included probands with schizophrenia (SZ, n = 71), schizoaffective disorder (SAD, n = 70), and psychotic bipolar I disorder (BDP, n = 86); their first-degree relatives (SZ-Rel, n = 74; SAD-Rel, n = 62; BDP-Rel, n = 88); and healthy controls (HC, n = 145). Hippocampal volumes were derived from 3Tesla T1-weighted MPRAGE images using manual tracing/3D Slicer 3.6.3 and semiautomated parcellation/FreeSurfer5.1,64bit. Volumetric outcomes from both methodologies were contrasted in HC and probands and relatives across the 3 diagnoses, using mixed-effect regression models (SAS9.3 Proc MIXED); Pearson correlations between manual tracing and FreeSurfer outcomes were computed. SZ (P = .0007-.02) and SAD (P = .003-.14) had lower hippocampal volumes compared with HC, whereas BDP showed normal volumes bilaterally (P = .18-.55). All relative groups had hippocampal volumes not different from controls (P = .12-.97) and higher than those observed in probands (P = .003-.09), except for FreeSurfer measures in bipolar probands vs relatives (P = .64-.99). Outcomes from manual tracing and FreeSurfer showed direct, moderate to strong, correlations (r = .51-.73, P < .05). These findings from a large psychosis sample support decreased hippocampal volume as a putative biomarker for schizophrenia and schizoaffective disorder, but not for psychotic bipolar I disorder, and may reflect a cumulative effect of divergent primary disease processes and/or lifetime medication use. Manual tracing and semiautomated parcellation regional volumetric approaches may provide useful outcomes for defining measurable biomarkers underlying severe mental illness. Funding:
|
2014
Structural and Functional Bases of Inhibited Temperament
|
Publication: Soc Cogn Affect Neurosci. 2014 Dec;9(12):2049-58. PMID: 24493850 | PDF Authors: Clauss JA, Seay AL, VanDerKlok RM, Avery SN, Cao A, Cowan RL, Benningfield MM, Blackford JU. Institution: Department of Psychiatry, Vanderbilt University Medical School, Nashville, TN, USA. Background/Purpose: Children born with an inhibited temperament are at heightened risk for developing anxiety, depression and substance use. Inhibited temperament is believed to have a biological basis; however, little is known about the structural brain basis of this vulnerability trait. Structural MRI scans were obtained from 84 (44 inhibited, 40 uninhibited) young adults. Given previous findings of amygdala hyperactivity in inhibited individuals, groups were compared on three measures of amygdala structure. To identify novel substrates of inhibited temperament, a whole brain analysis was performed. Functional activation and connectivity were examined across both groups. Inhibited adults had larger amygdala and caudate volume and larger volume predicted greater activation to neutral faces. In addition, larger amygdala volume predicted greater connectivity with subcortical and higher order visual structures. Larger caudate volume predicted greater connectivity with the basal ganglia, and less connectivity with primary visual and auditory cortex. We propose that larger volume in these salience detection regions may result in increased activation and enhanced connectivity in response to social stimuli. Given the strong link between inhibited temperament and risk for psychiatric illness, novel therapeutics that target these brain regions and related neural circuits have the potential to reduce rates of illness in vulnerable individuals. Funding:
|
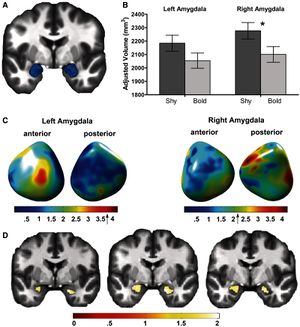 Inhibited adults have larger amygdalae. (A) Average manually traced amygdala displayed in 3-D. (B) Overall amygdala volume was greater in the inhibited compared with the uninhibited group in the right amygdala (inhibited: 2277 ± 62 mm3; uninhibited: 2101 ± 59 mm3; P = 0.045). (C) In the inhibited group, shape analysis reveals areas of greater convexity in the left and right amygdala. The peak areas of convexity are shown in red. Group differences in surface amygdala shape are displayed on an average amygdala surface. (D) Inhibited adults had regions of significantly larger gray matter volume in both the left and right amygdalae (P < 0.05 FWE corrected at the cluster level). For the left amygdala, the significant cluster was 442 voxels (35% of 1252 voxels; peak voxel: x = −21, y = −4, z = −16). For the right amygdala, the significant cluster was 402 voxels (33% of 1217 voxels; peak voxel: x = 18, y = −3, z = −22). Areas of significant between-group differences are illustrated on multiple coronal slices of an average brain. Amygdala volume was estimated for each of the subjects in 3D Slicer, Version 3.4. |
Femoral and Tibial Insert Downsizing Increases the Laxity Envelope in TKA
|
Publication: Knee Surg Sports Traumatol Arthrosc. 2014 Dec;22(12):3003-11. PMID: 25274088 | PDF Authors: Mueller JK, Wentorf FA, Moore RE. Institution: Zimmer, Inc., Warsaw, IN, USA. Background/Purpose: Purpose: This study examines the effect of component downsizing in a modern total knee arthroplasty (TKA) system on the laxity envelope of the knee throughout flexion. Methods: A robotic testing system was utilized to measure laxity envelopes in the implanted knee by in the anterior-posterior (AP), medial-lateral (ML), internal-external (IE) and varus-valgus (VV) directions. Five fresh-frozen cadavers were tested with a modern cruciate retaining TKA implantation, a 1-mm thinner polyethylene insert and a femoral component 2 mm smaller in the AP dimension. Results: The downsized tibial insert was more lax throughout the flexion arc with up to 2.0 mm more laxity in the AP direction at full extension, a 43.8 % increase over the original implantation. A thinner insert consistently increased laxity throughout the arc of flexion in all degrees of freedom. Downsizing the femoral component resulted in 8.5 mm increase in AP laxity at 90°, a 73.9 % increase. In mid-flexion, downsizing the femur produced similar laxity values to the downsized insert in AP, ML, IE and VV directions. Conclusion: Downsizing the TKA components had significant effects on laxity throughout flexion. Downsizing a femoral component 2 mm had an equivalent increase in laxity in mid-flexion as downsizing the tibial insert 1 mm. This study quantifies the importance of choosing the appropriate implant component size, having the appropriate size available and the effect of downsizing. The laxity of the implanted knee contributes to how the implant feels to the patient and ultimately the patient's satisfaction with their new knee. |
|
Publication: Cardiovasc Intervent Radiol. 2014 Dec;37(6):1589-96. PMID: 24722894 Authors: Fritz J, U-Thainual P, Ungi T, Flammang AJ, Kathuria S, Fichtinger G, Iordachita II, Carrino JA. Institution: Russell H. Morgan Department of Radiology and Radiological Science, Johns Hopkins University School of Medicine, Baltimore, MD, USA. Background/Purpose: To evaluate the feasibility of magnetic resonance imaging (MRI)-guided vertebroplasty at 1.5 Tesla using augmented reality image overlay navigation. Materials and Methods: Twenty-five unilateral vertebroplasties [5 of 25 (20 %) thoracic, 20 of 25 (80 %) lumbar] were prospectively planned in 5 human cadavers. A clinical 1.5-Teslan MRI system was used. An augmented reality image overlay navigation system and 3D Slicer visualization software were used for MRI display, planning, and needle navigation. Intermittent MRI was used to monitor placement of the MRI-compatible vertebroplasty needle. Cement injections (3 ml of polymethylmethacrylate) were performed outside the bore. The cement deposits were assessed on intermediate-weighted MR images. Outcome variables included type of vertebral body access, number of required intermittent MRI control steps, location of final needle tip position, cement deposit location, and vertebroplasty time. Results: All planned procedures (25 of 25, 100 %) were performed. Sixteen of 25 (64 %) transpedicular and 9 of 25 (36 %) parapedicular access routes were used. Six (range 3-9) MRI control steps were required for needle placement. No inadvertent punctures were visualized. Final needle tip position and cement location were adequate in all cases (25 of 25, 100 %) with a target error of the final needle tip position of 6.1 ± 1.9 mm (range 0.3-8.7 mm) and a distance between the planned needle tip position and the center of the cement deposit of 4.3 mm (range 0.8-6.8 mm). Time requirement for one level was 16 (range 11-21) min. Conclusion: MRI-guided vertebroplasty using image overlay navigation is feasible allowing for accurate vertebral body access and cement deposition in cadaveric thoracic and lumbar vertebral bodies. Funding:
|
Medial Frontal White and Gray Matter Contributions to General Intelligence
|
Publication: PLoS One. 2014 Dec 31;9(12):e112691. PMID: 25551572 | PDF Authors: Ohtani T, Nestor PG, Bouix S, Saito Y, Hosokawa T, Kubicki M. Institution: Department of Diagnostic and Interventional Radiology, Centre Hospitalier Universitaire Vaudois (CHUV) and University of Lausanne, Lausanne, Switzerland. Background/Purpose: The medial orbitofrontal cortex (mOFC) and rostral anterior cingulate cortex (rACC) are part of a wider neural network that plays an important role in general intelligence and executive function. We used structural brain imaging to quantify magnetic resonance gray matter volume and diffusion tensor white matter integrity of the mOFC-rACC network in 26 healthy participants who also completed neuropsychological tests of intellectual abilities and executive function. Stochastic tractography, the most effective Diffusion Tensor Imaging method for examining white matter connections between adjacent gray matter regions, was employed to assess the integrity of mOFC-rACC pathways. Fractional anisotropy (FA), which reflects the integrity of white matter connections, was calculated. Results indicated that higher intelligence correlated with greater gray matter volumes for both mOFC and rACC, as well as with increased FA for left posterior mOFC-rACC connectivity. Hierarchical regression analyses revealed that DTI-derived FA of left posterior mOFC-rACC uniquely accounted for 29%-34% of the variance in IQ, in comparison to 11%-16% uniquely explained by gray matter volume of the left rACC. Together, left rACC gray matter volume and white matter connectivity between left posterior mOFC and rACC accounted for up to 50% of the variance in general intelligence. This study is to our knowledge the first to examine white matter connectivity between OFC and ACC, two gray matter regions of interests that are very close in physical proximity, and underscores the important independent contributions of variations in rACC gray matter volume and mOFC-rACC white matter connectivity to individual differences in general intelligence. |
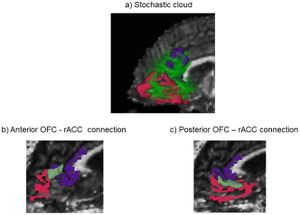 The stochastic cloud connecting the medial orbitofrontal cortex (mOFC) and the rostral anterior cingulate cortex (rACC). The red structure is the mOFC, the purple is the rACC, and the light green is the stochastic cloud connecting the mOFC and rACC. Stochastic tractography (part of Slicer3 software was performed to generate WM connections. |
Elastography using Multi-Stream GPU: An Application to Online Tracked Ultrasound Elastography, In-Vivo and the da Vinci Surgical System
|
Publication: PLoS One. 2014 Dec 26;9(12):e115881. PMID: 25541954 | PDF Authors: Deshmukh NP, Kang HJ, Billings SD, Taylor RH, Hager GD, Boctor EM. Institution: Department of Computer Science, Johns Hopkins University, Baltimore, MD, USA. Background/Purpose: A system for real-time ultrasound (US) elastography will advance interventions for the diagnosis and treatment of cancer by advancing methods such as thermal monitoring of tissue ablation. A multi-stream graphics processing unit (GPU) based accelerated normalized cross-correlation (NCC) elastography, with a maximum frame rate of 78 frames per second, is presented in this paper. A study of NCC window size is undertaken to determine the effect on frame rate and the quality of output elastography images. This paper also presents a novel system for Online Tracked Ultrasound Elastography (O-TRuE), which extends prior work on an offline method. By tracking the US probe with an electromagnetic (EM) tracker, the system selects in-plane radio frequency (RF) data frames for generating high quality elastograms. A novel method for evaluating the quality of an elastography output stream is presented, suggesting that O-TRuE generates more stable elastograms than generated by untracked, free-hand palpation. Since EM tracking cannot be used in all systems, an integration of real-time elastography and the da Vinci Surgical System is presented and evaluated for elastography stream quality based on our metric. The da Vinci surgical robot is outfitted with a laparoscopic US probe, and palpation motions are autonomously generated by customized software. It is found that a stable output stream can be achieved, which is affected by both the frequency and amplitude of palpation. The GPU framework is validated using data from in-vivo pig liver ablation; the generated elastography images identify the ablated region, outlined more clearly than in the corresponding B-mode US images.
|
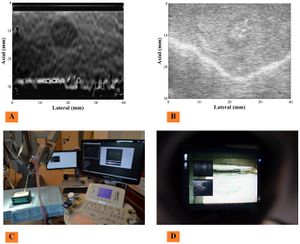 Integration with da Vinci surgical systems. Untracked elastography has been integrated with da Vinci surgical systems using a laparoscopic probe controlled by an arm of the da Vinci surgical robot. (C) Shows the overall setup. (D) Shows the view from surgeon's console of how B-mode (B) and Elastography image (A) appear when overlaid in the console display. The system is highly modular and connected via the OpenIGTLinkMUSiiC API. This grants the ability to connect our system to various open source frontend modules, such as 3D Slicer for advanced visualization of the image stream. |
Texture Descriptors to distinguish Radiation Necrosis from Recurrent Brain Tumors on multi-parametric MRI
|
Publication: Proc SPIE. 2014;9035:90352B. PMID: 24910722 | PDF Authors: Pallavi T, Prateek P, Lisa R, Leo W, Chaitra B, Andrew S, Mark C, Anant M. Institution: Department of Biomedical Engineering, Case Western Reserve University, Cleveland, OH, USA. Background/Purpose: Differentiating radiation necrosis (a radiation induced treatment effect) from recurrent brain tumors (rBT) is currently one of the most clinically challenging problems in care and management of brain tumor (BT) patients. Both radiation necrosis (RN), and rBT exhibit similar morphological appearance on standard MRI making non-invasive diagnosis extremely challenging for clinicians, with surgical intervention being the only course for obtaining definitive "ground truth". Recent studies have reported that the underlying biological pathways defining RN and rBT are fundamentally different. This strongly suggests that there might be phenotypic differences and hence cues on multi-parametric MRI, that can distinguish between the two pathologies. One challenge is that these differences, if they exist, might be too subtle to distinguish by the human observer. In this work, we explore the utility of computer extracted texture descriptors on multi-parametric MRI (MP-MRI) to provide alternate representations of MRI that may be capable of accentuating subtle micro-architectural differences between RN and rBT for primary and metastatic (MET) BT patients. We further explore the utility of texture descriptors in identifying the MRI protocol (from amongst T1-w, T2-w and FLAIR) that best distinguishes RN and rBT across two independent cohorts of primary and MET patients. A set of 119 texture descriptors (co-occurrence matrix homogeneity, neighboring gray-level dependence matrix, multi-scale Gaussian derivatives, Law features, and histogram of gradient orientations (HoG)) for modeling different macro and micro-scale morphologic changes within the treated lesion area for each MRI protocol were extracted. Principal component analysis based variable importance projection (PCA-VIP), a feature selection method previously developed in our group, was employed to identify the importance of every texture descriptor in distinguishing RN and rBT on MP-MRI. PCA-VIP employs regression analysis to provide an importance score to each feature based on their ability to distinguish the two classes (RN/rBT). The top performing features identified via PCA-VIP were employed within a random-forest classifier to differentiate RN from rBT across two cohorts of 20 primary and 22 MET patients. Our results revealed that, (a) HoG features at different orientations were the most important image features for both cohorts, suggesting inherent orientation differences between RN, and rBT, (b) inverse difference moment (capturing local intensity homogeneity), and Laws features (capturing local edges and gradients) were identified as important for both cohorts, and (c) Gd-C T1-w MRI was identified, across the two cohorts, as the best MRI protocol in distinguishing RN/rBT. Funding:
|
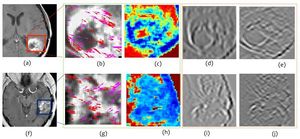 Representative T1-w MR images for rBT (a) and RN (f). Figures 3 (b), (c) and (g), (h) outlined in green, represent top performing features (HoG (red, magenta arrows show top 2 prominent directions), and Laplacian inverse moment (red shows more heterogeneity)) for rBT, RN respectively. Figures 3 (d), (e) and (i), (j), outlined in orange, represent the worst performing features (S5L5 and L5E5 (laplacian) Laws features) for rBT and RN respectively for primary BT patients. |
Comparison of the Tada Formula with Software Slicer: Precise and Low-Cost Method for Volume Assessment of Intracerebral Hematoma
|
Publication: Stroke. 2014 Nov;45(11):3433-5. PMID: 25316277. | PDF Authors: Xu X, Chen X, Zhang J, Zheng Y, Sun G, Yu X, Xu B. Institution: Department of Neurosurgery, People's Liberation Army General Hospital, Beijing, China. Background/Purpose: The Tada (ABC/2) formula has been used widely for volume assessment of intracerebral hematoma. However, the formula is crude for irregularly shaped hematoma. We aimed to compare the accuracy of the ABC/2 formula with open source software 3D Slicer. Methods—Computed tomographic images of 294 patients with spontaneous intracerebral hematoma were collected. Hematoma volumes were assessed with the ABC/2 formula and calculated with software 3D Slicer. Results of these 2 methods were compared with regard to hematoma size and shape. Results—The estimated hematoma volume was 58.41±37.83 cm3 using the ABC/2 formula, compared with 50.38±31.93 cm3 with 3D Slicer (mean percentage deviation, 16.38±9.15%). When allocate patients into groups according to hematoma size, the mean estimation error were 3.24 cm3 (17.72%), 5.85 cm3 (13.72%), and 15.14 cm3 (17.48%) for groups 1, 2, and 3, respectively. When divided by shape, estimation error was 3.33 cm3 (9.76%), 7.19 cm3 (18.37%), and 29.39 cm3 (39.12%) for regular, irregular, and multilobular hematomas. Conclusions—There is significant estimation error using the ABC/2 formula to calculate hematoma volume. Compared with hematoma size, estimation error is more significantly associated with hematoma shape. Funding:
|
Segmentation of Metastatic Lesions in Large-scale Registries: Comparison of Expert Manual Segmentation vs. Semi-automated Methods
|
Publication: Neuro Oncol. 2014 Nov; 16(Suppl 5): v149. PMC4218376 | PDF Authors: LaMontagne P, Milchencko M, Vélez M, Abraham C, Marcus D, Robinson C, Fouke S. Institution: Washington University School of Medicine, St. Louis, MO, USA. Background/Purpose: To better understand the outcomes after stereotactic radiosurgery (SRS) for brain metastases, we have created a registry that archives MRI studies alongside clinical data in this population. To consider outcomes quantitatively, each metastatic lesion must be segmented to define a 3D volume. In large populations, lesion segmentation is time consuming (and expensive when this requires an experienced Radiation Oncologist or Neurosurgeon) to manually segment each lesion slice by slice. We sought to determine whether semi-automated segmentation using the Growth-Cut toolbox in 3D Slicer (Egger et al. 2013) provides contours equivalent to those created by physicians using manual segmentation methods. A subset of 40 lesions that had undergone manual segmentation for SRS planning were selected to compare with semi-automated segmentation methods. Using the 3D Slicer Growth-Cut toolbox, a novice member of the team partially outlined the lesion tumor and non-tumor tissues. The toolbox then propagated lesion boundaries and created a complete 3D volume. Dice Coefficient (DC), Hausdorff Distance (HD), and Modified Hausdorf Distance (MHD), were used to establish volume similarity between Growth-Cut toolbox output and manual segmentation on metastatic lesions. Additionally, lesion volume, diffusion (ADC), and perfusion (rCBV) were analyzed to determine if segmentation discrepancies resulted in differences in imaging parameter estimates. There was strong similarity of the 3D volumes according to the DC (µ = 0.77), HD (µ = 3.89), and MHD (µ = 0.85). Imaging parameters between segmentation methods, agreed well for both diffusion (ADC R2 = 0.94), and perfusion (rCBV R2 = 0.986). Using 3D Slicer did not substantially decrease tracing time; however, it produced similar results by a novice to those of experts. This study supports the use of the Growth-Cut toolbox when expert manual segmentation does not exist. This finding is particularly useful for large scale studies that would otherwise require significant clinician involvement for ROI generation. |
A New Improved Method for Assessing Brain Deformation after Decompressive Craniectomy
|
Publication: PLoS One. 2014 Oct 10;9(10):e110408. PMID: 25303305 | PDF Authors: Fletcher TL, Kolias AG, Hutchinson PJ, Sutcliffe MP. Institution: Department of Engineering, University of Cambridge, Cambridge, UK. Background/Purpose: Decompressive craniectomy (DC) is a surgical intervention used following traumatic brain injury to prevent or alleviate raised intracranial pressure. However the clinical effectiveness of the intervention remains in doubt. The location of the craniectomy (unilateral or bifrontal) might be expected to change the brain deformation associated with the operation and hence the clinical outcome. As existing methods for assessing brain deformation have several limitations, we sought to develop and validate a new improved method. Funding:
|
Posterior Cerebral Artery Angle and the Rupture of Basilar Tip Aneurysms
|
Publication: PLoS One. 2014 Oct 29;9(10):e110946. PMID: 25353989 | PDF Authors: Ho AL, Mouminah A, Du R. Institution: Department of Neurosurgery, Brigham and Women's Hospital, Harvard Medical School, Boston, MA, USA. Background/Purpose: Since the initial publication of the International Study of Unruptured Intracranial Aneurysms (ISUIA), management of unruptured intracranial aneurysms has been mainly based on the size of the aneurysm. The contribution of morphological characteristics to treatment decisions of unruptured aneurysms has not been well studied in a systematic and location specific manner. We present a large sample of basilar artery tip aneurysms (BTA) that were assessed using a diverse array of morphological variables to determine the parameters associated with ruptured aneurysms. Demographic and clinical risk factors of aneurysm rupture were obtained from chart review. CT angiograms (CTA) were evaluated with 3D Slicer, an open source visualization and image analysis software, to generate 3-D models of the aneurysms and surrounding vascular architecture. Morphological parameters examined in each model included aneurysm volume, aspect ratio, size ratio, aneurysm angle, basilar vessel angle, basilar flow angle, and vessel to vessel angles. Univariate and multivariate analyses were performed to determine statistical significance. From 2008-2013, 54 patients with BTA aneurysms were evaluated in a single institution, and CTAs from 33 patients (15 ruptured, 18 unruptured) were available and analyzed. Aneurysms that underwent reoperation, that were associated with arteriovenous malformations, or that lacked preoperative CTA were excluded. Multivariate logistic regression revealed that a larger angle between the posterior cerebral arteries (P1-P1 angle, p = 0.037) was most strongly associated with aneurysm rupture after adjusting for other morphological variables. In this location specific study of BTA aneurysms, the larger the angle formed between posterior cerebral arteries was found to be a new morphological parameter significantly associated with ruptured BTA aneurysms. This is a physically intuitive parameter that can be measured easily and readily applied in the clinical setting.
|
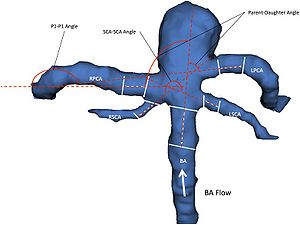 Figure 2 3D model of BTA aneurysm depicting angular variables of the surrounding vasculature. There were three vessel to vessel angles -measured. The Parent-Daughter angle is a composite angle that refers to the average of the two angles formed between the basilar artery (BA) and each posterior cerebral artery (RPCA, LPCA). The P1-P1 angle refers to the angle formed between the two posterior cerebral arteries (RPCA, LPCA). The SCA-SCA angle refers to the angle formed between the two superior cerebellar arteries (RSCA, LSCA). This 3D surface model of the aneurysm and surrounding vessels could be manipulated freely in the 3D Slicer environment. Volumes, lengths, and angles were then manually measured with fiducial-based tractography. |
Distribution of Coronoid Fracture Lines by Specific Patterns of Traumatic Elbow Instability
|
Publication: J Hand Surg Am. 2014 Oct;39(10):2041-6. PMID: 25070699 | PDF Authors: Mellema JJ, Doornberg JN, Dyer GS, Ring D. Institution: Orthopaedic Hand and Upper Extremity Service, Massachusetts General Hospital, Boston, MA, USA. Background/Purpose: To determine if specific coronoid fractures relate to specific overall traumatic elbow instability injury patterns and to depict any relationship on fracture maps and heat maps. Methods: We collected 110 computed tomography (CT) studies from patients with coronoid fractures. Fracture types and pattern of injury were characterized based on anteroposterior and lateral radiographs, 2- and 3-dimensional CT scans, and intraoperative findings as described in operative reports. Using quantitative 3-dimensional CT techniques we were able to reconstruct the coronoid and reduce fracture fragments. Based on these reconstructions, fracture lines were identified and graphically superimposed onto a standard template in order to create 2-dimensional fracture maps. To further emphasize the fracture maps, the initial diagrams were converted into fracture heat maps following arbitrary units of measure. The Fisher exact test was used to evaluate the association between coronoid fracture types and elbow fracture-dislocation patterns. Results: Forty-seven coronoid fractures were associated with a terrible triad fracture dislocation, 30 with a varus posteromedial rotational injury, 1 with a anterior olecranon fracture dislocation, 22 with a posterior olecranon fracture dislocation, and 7 with a posterior Monteggia injury associated with terrible triad fracture dislocation of the elbow. The association between coronoid fracture types and elbow fracture-dislocation patterns, as shown on 2-dimensional fracture and heat maps, was strongly significant. Conclusions: Our fracture maps and heat maps support the observation that specific patterns of traumatic elbow instability have correspondingly specific coronoid fracture patterns. Knowledge of these patterns is useful for planning management because it directs exposure and fixation and helps identify associated ligament injuries and fractures that might benefit from treatment. Clinical Relevance: Two-dimensional fracture and heat mapping techniques may help surgeons to predict the distribution of coronoid fracture lines associated with specific injury patterns.
|
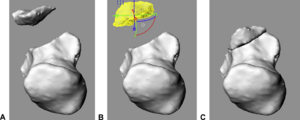 Images show fracture fragment reduction of 3-dimensional mesh reconstructions in Rhinoceros (McNeel, Seattle, WA). A. Imported 3-dimensional mesh reconstruction was created in 3D Slicer. B. Fracture fragment selected for reduction. C. Image of 3-dimensional mesh reconstruction after reduction of the fracture fragment. |
Cardiovascular Magnetic Resonance Imaging of Scar Development Following Pulmonary Vein Isolation: A Prospective Study
|
Publication: PLoS One. 2014 Sep 24;9(9):e104844. PMID: 25251403 | PDF Authors: Hsing J, Peters DC, Knowles BR, Manning WJ, Josephson ME. Institution: Department of Medicine, Cardiovascular Division, Beth Israel Deaconess Medical Center, Harvard Medical School, Boston, MA, USA. Background/Purpose: Decompressive craniectomy (DC) is a surgical intervention used following traumatic brain injury to prevent or alleviate raised intracranial pressure. However the clinical effectiveness of the intervention remains in doubt. The location of the craniectomy (unilateral or bifrontal) might be expected to change the brain deformation associated with the operation and hence the clinical outcome. As existing methods for assessing brain deformation have several limitations, we sought to develop and validate a new improved method. Funding:
|
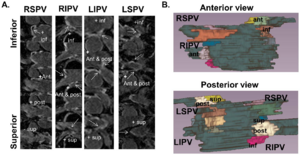 16 segment model showing the 4 regions evaluated around each pulmonary vein. A) Zoomed and cropped slices labeled by region. B) 3D color-coded display, showing 4 regions about each PV, with explicit labeling for the right inferior and left superior PV. Image analyses were performed using ImageJ (NIH Image, Bethesda, MD) and 3D Slicer (v3.6, NA-MIC, Boston, MA). |
Clinical Testing of an Alternate Method of Inserting Bone-Implanted Fiducial Markers
|
Publication: Int J Comput Assist Radiol Surg. 2014 Sep;9(5):913-20. PMID: 24493228 | PDF Authors: Balachandran R, Fritz MA, Dietrich MS, Danilchenko A, Mitchell JE, Oldfield VL, Lipscomb WW, Fitzpatrick JM, Neimat JS, Konrad PE, Labadie RF. Institution: Department of Otolaryngology, Vanderbilt University Medical Center, Nashville, TN, USA. Background/Purpose: Deep brain stimulation (DBS) surgery utilizes image guidance via bone-implanted fiducial markers to achieve the desired submillimetric accuracy and to provide means for attaching microstereotactic frames. For maximal benefit, the markers must be inserted to the correct depth since over-insertion leads to stripping and under-insertion leads to instability. PURPOSE: The purpose of the study was to test clinically a depth-release drive system, the PosiSeat™, versus manual insertion (pilot hole followed by manual screwing until tactile determined correct seating) for implanting fiducial markers into the bone. METHODS: With institutional review board approval, the PosiSeat™ was used to implant markers in 15 DBS patients (57 fiducials). On post-insertion CT scans, the depth of the gap between the shoulder of the fiducial markers and the closest bone surface was measured. Similar depth measurements were performed on the CT scans of 64 DBS patients (250 fiducials), who underwent manual fiducial insertion. RESULTS: Median of shoulder-to-bone distance for PosiSeat™ and manual insertion group were 0.03 and 1.06 mm, respectively. Fifty percent of the fiducials had the shoulder-to-bone distances within 0.01-0.09 mm range for the PosiSeat group and 0.04-1.45 mm range for the manual insertion group. These differences were statistically significant. CONCLUSIONS: A depth-release drive system achieves more consistent placement of bone-implanted fiducial markers than manual insertion. Funding:
|
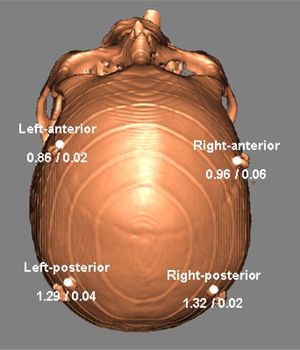 Median shoulder-to-bone distances at typical anchor locations. The anchor locations are shown as white circles. The two values associated with each location indicate the median value of the shoulder-to-bone distance in mm using the manual method and the PosiSeat method respectively. The scans of patients were analyzed with 3D Slicer Version 3.4. |
Three-Dimensional Imaging of HIV-1 Virological Synapses Reveals Membrane Architectures Involved in Virus Transmission
|
Publication: J. Virol. 2014 Sept; 88(18):10327-39. PMID: 24965444 | PDF Authors: Do T, Murphy G, Earl LA, Del Prete GQ, Grandinetti G, Li GH, Estes JD, Rao P, Trubey CM, Thomas J, Spector J, Bliss D, Nath A, Lifson JD, Subramaniam S. Institution: Laboratory of Cell Biology, Center for Cancer Research, National Cancer Institute, National Institutes of Health, Bethesda, Maryland, USA. Background/Purpose: HIV transmission efficiency is greatly increased when viruses are transmitted at virological synapses formed between infected and uninfected cells. We have previously shown that virological synapses formed between HIV-pulsed mature dendritic cells (DCs) and uninfected T cells contain interdigitated membrane surfaces, with T cell filopodia extending toward virions sequestered deep inside invaginations formed on the DC membrane. To explore membrane structural changes relevant to HIV transmission across other types of intercellular conjugates, we used a combination of light and focused ion beam scanning electron microscopy (FIB-SEM) to determine the three-dimensional (3D) architectures of contact regions between HIV-1-infected CD4+ T cells and either uninfected human CD4+ T cells or human fetal astrocytes. We present evidence that in each case, membrane extensions that originate from the uninfected cells, either as membrane sheets or filopodial bridges, are present and may be involved in HIV transmission from infected to uninfected cells. We show that individual virions are distributed along the length of astrocyte filopodia, suggesting that virus transfer to the astrocytes is mediated, at least in part, by processes originating from the astrocyte itself. Mechanisms that selectively disrupt the polarization and formation of such membrane extensions could thus represent a possible target for reducing viral spread. Funding:
|
 Segmentation of FIB-SEM data shows clear differences between Jurkat cell and primary CD4+ T cell synapses. (A and B) Segmentation of Jurkat cells from the data set in Fig. 3 reveals three infected (*) and two uninfected cells. (B) Zoomed-in view of the cells in panel A. Short membrane extensions cross the synapse from both infected and uninfected cells. (C to F) Uninfected and HIV-1 NL4-3-infected primary CD4+ T cells were cocultured for 8 h and imaged as described for panels A and B. (C) Zoomed-out view of the primary cell cluster reveals extensive membrane interdigitation between infected (*) and uninfected cells. Several virions (red) can be seen at the contact zones with infected cells. (D) Rotated view of the cells shown in panel C. An uninfected cell (brown) with a large membrane-enclosed extension (white arrow) stretches around another uninfected cell (purple), making direct contact with an infected cell (blue). (E) Segmentation of primary T cell cluster shows close contacts between uninfected and infected (*) T cells, as well as a long filopodial contact between the infected cell and a distant, uninfected cell. (F) Back view of the primary cell cluster shown in panel E. Cells display many long filopodia and membrane extensions, common in primary CD4+ T cells but not in Jurkat cells. e. Features of interest were automatically selected with 3DSlicer, or Avizo Fire (Visualization Sciences Group) using a thresholding tool. |
How Action Selection can be Embodied: Intracranial Gamma Band Recording Shows Response Competition during the Eriksen Flankers Test
|
Publication: Front Hum Neurosci. 2014 Aug 26;8:668. PMID: 25206328 | PDF Authors: Caruana F, Uithol S, Cantalupo G, Sartori I, Lo Russo G, Avanzini P. Institution: Brain Center for Social and Motor Cognition - Istituto Italiano di Tecnologia Parma, Italy. Background/Purpose: Recent findings in monkeys suggest that action selection is based on a competition between various action options that are automatically planned by the motor system. Here we discuss data from intracranial EEG recordings in human premotor cortex (PMC) during a bimanual version of the Eriksen flankers test that suggest that the same principles apply to human action decisions. Recording sites in the dorsal PMC show an early but undifferentiated activation, a delayed response that depends on the experimental conditions and, finally, a movement related activation during action execution. Additionally, we found that the medial part of the PMC show a significant increase in response for ipsilateral trials, suggesting a role in inhibiting the wrong response. The ventral PMC seems to be involved in action execution, rather than action selection. Together these findings suggest that the human PMC is part of a network that specifies, selects, and executes actions. Funding:
|
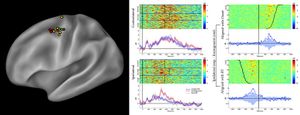 (Left panel) Sites showing significant unspecific, short-latency activations according to the gamma band reactivity within 100 ms after stimulus onset, are shown in yellow. Choice-related sites, showing significant activation during the incongruent trials, are shown in red. Furthermore, sites showing both effect are shown in green. Results are plotted on a template (Caret® ) according to their MNI coordinates. (Central panel) Results from a representative d premotor cortex (PMC) site are shown (P3, M’12). Figure shows the gamma modulation during the congruent, incongruent, and neutral trials requiring a response with the hand contralateral (top) and ipsilateral (bottom) to the implanted hemisphere. Data are aligned with the stimulus onset. The average reaction time for the three conditions is shown at the single trial level (black vertical lines). The short-latency activations is clear in both contralateral- and ipsilateral-response trials, in the three conditions. In the contralateral-response trials the activity is prolonged after the response, while in the ipsilateral-response trials is suppressed before the response. The greater activity during the incongruent conditions is visible in the ipsilateral-response trials. (Right panel) The same dataset, showing a representative dPMC site (P3, M’12) during the incongruent condition requiring a response with the ipsilateral hand, aligned to both the onset of the stimulus (upper part) and the onset of the response (lower panel). For each selected alignment, the other event is indicated by a curved line. Cerebral structures explored by each electrode contact were visualized by a software package for visualization and image analysis (3D Slicer). |
Airway Wall Thickness is Increased in COPD Patients with Bronchodilator Responsiveness
|
Publication: Respir Res. 2014 Aug 8;15:84. PMID: 25248436 | PDF Authors: Kim V, Desai P, Newell JD, Make BJ, Washko GR, Silverman EK, Crapo JD, Bhatt SP, Criner GJ; COPDGene Investigators. Institution: Temple University School of Medicine, Philadelphia, PA, USA. Background/Purpose: Bronchodilator responsiveness (BDR) is a common but variable phenomenon in COPD. The CT characteristics of airway dimensions that differentiate COPD subjects with BDR from those without BDR have not been well described. We aimed to assess airway dimensions in COPD subjects with and without BDR. Methods: We analyzed subjects with GOLD 1-4 disease in the COPDGene® study who had CT airway analysis. We divided patients into two groups: BDR + (post bronchodilator ΔFEV1 ≥ 10%) and BDR-(post bronchodilator ΔFEV1 < 10%). The mean wall area percent (WA%) of six segmental bronchi in each subject was quantified using VIDA. Using 3D Slicer, airway wall thickness was also expressed as the square root wall area of an airway of 10 mm (Pi10) and 15 mm (Pi15) diameter. %Emphysema and %gas trapping were also calculated. Results: 2355 subjects in the BDR-group and 1306 in the BDR + group formed our analysis. The BDR + group had a greater Pi10, Pi15, and mean segmental WA% compared to the BDR-group. In multivariate logistic regression using gender, race, current smoking, history of asthma, %emphysema, %gas trapping, %predicted FEV1, and %predicted FVC, airway wall measures remained independent predictors of BDR. Using a threshold change in FEV1 ≥ 15% and FEV1 ≥ 12% and 200 mL to divide patients into groups, the results were similar. Conclusion: BDR in COPD is independently associated with CT evidence of airway pathology. This study provides us with greater evidence of changes in lung structure that correlate with physiologic manifestations of airflow obstruction in COPD. Funding:
|
Compact Robotically Steerable Image-Guided Instrument for Multi-Adjacent-Point (MAP) Targeting
|
Publication: IEEE Transactions on Robotics. 2014 Aug;30(4):802-15. Authors: Torabi M, Gupta R, Walsh C.J. Institution: Harvard University, Cambridge, MA, USA. Background/Purpose: Accurately targeting multi-adjacent points (MAPs) during image-guided percutaneous procedures is challenging due to needle deflection and misalignment. The associated errors can result in inadequate treatment of cancer in the case of prostate brachytherapy, or inaccurate diagnosis during biopsy, while repeated insertions increase procedure time, radiation dose, and complications. To address these challenges, we present an image-guided robotic system capable of MAP targeting of irregularly shaped volumes after a single insertion of a percutaneous instrument. The design of the compact CT-compatible drive mechanism is based on a nested screw and screw-spline combination that actuates a straight outer cannula and a curved inner stylet that can be repeatedly straightened when retracted inside the cannula. The stylet translation and cannula rotation/translation enable a 3-D workspace to be reached with the stylet's tip. A closed-form inverse kinematics and image-to-robot registration are implemented in an image-guided system including a point-and-click user interface. The complete system is successfully evaluated with a phantom under a Siemens Definition Flash CT scanner. We demonstrate that the system is capable of MAP targeting for a 2-D shape of the letter “H” and a 3-D helical pattern with an average targeting error of 2.41 mm. These results highlight the benefit and efficacy of the proposed robotic system in seed placement during image-guided brachytherapy. Funding: Harvard School of Engineering and Applied Sciences, Cambridhe, MA, USA. |
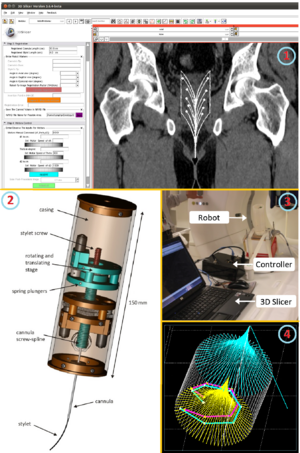 1. Graphical user interface, the robot kinematics, and the image-to-robot registration were developed and integrated into the new image-guided-therapy module in 3D Slicer. 2. Robotically steerable percutaneous instrument that targets multiple adjacent points in irregularly-shaped volumes in soft tissue after a single needle insertion. 3. Robot, positioned with some arbitrary angles on the CT scanner bed, ready to move inside a Dual Source MDCT Siemens scanner. The robot was connected via Ethernet to a laptop computer via OpenIGTLink. 4. The green and pink plots, visualized inside the feasible volume, are the planned and actual shapes of a 3D helix respectively, which represents the location of the seeds in phantom. |
Combined Compared to Dissociated Oral and Intestinal Sucrose Stimuli induce Different Brain Hedonic Processes
|
Publication: Front Psychol. 2014 Aug; 5: 861. PMID: 25147536 | PDF Authors: Clouard C, Meunier-Salaün M-C, Meurice P, Malbert C-H, Val-Laillet D. Institution: INRA, UR1341 Alimentation et Adaptations Digestives, Nerveuses et Comportementales, Saint Gilles, France. Background/Purpose: The characterization of brain networks contributing to the processing of oral and/or intestinal sugar signals in a relevant animal model might help to understand the neural mechanisms related to the control of food intake in humans and suggest potential causes for impaired eating behaviors. This study aimed at comparing the brain responses triggered by oral and/or intestinal sucrose sensing in pigs. Seven animals underwent brain single photon emission computed tomography (99mTc-HMPAO) further to oral stimulation with neutral or sucrose artificial saliva paired with saline or sucrose infusion in the duodenum, the proximal part of the intestine. Oral and/or duodenal sucrose sensing induced differential cerebral blood flow changes in brain regions known to be involved in memory, reward processes and hedonic (i.e., pleasure) evaluation of sensory stimuli, including the dorsal striatum, prefrontal cortex, cingulate cortex, insular cortex, hippocampus, and parahippocampal cortex. Sucrose duodenal infusion only and combined sucrose stimulation induced similar activity patterns in the putamen, ventral anterior cingulate cortex and hippocampus. Some brain deactivations in the prefrontal and insular cortices were only detected in the presence of oral sucrose stimulation. Finally, activation of the right insular cortex was only induced by combined oral and duodenal sucrose stimulation, while specific activity patterns were detected in the hippocampus and parahippocampal cortex with oral sucrose dissociated from caloric load. This study sheds new light on the brain hedonic responses to sugar and has potential implications to unravel the neuropsychological mechanisms underlying food pleasure and motivation.
|
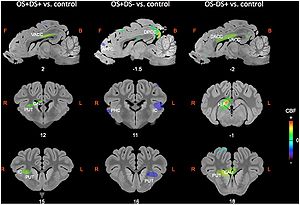 Sagittal and coronal MRI sections showing clusters of differential cerebral blood flow identified during the small volume correction (SVC) analyses in different regions of interest chosen upon a priori hypotheses for the three following contrasts: OS+DS+ (oral and duodenal sucrose stimulation) vs. control, OS+DS- (oral sucrose stimulation) vs. control, and OS-DS+ (duodenal sucrose stimulation) vs. control. The x or y coordinates in the CA–CP (commissura anterior–commissura posterior) plane are indicated below the images. The threshold for significance was set at P < 0.01 (uncorrected). Positive cerebral blood flow (CBF) values indicate a brain metabolism activation and negative CBF values indicate a brain metabolism deactivation compared to control. L, left; R, right; APFC, anterior prefrontal cortex; CAU, caudate nucleus; PUT, putamen; HIP, hippocampus; IC, insular cortex; DACC, dorsal anterior cingulate cortex; VACC, ventral anterior cingulate cortex; PHC, parahippocampal cortex. The representation of the clusters with different metabolism was performed using 3D Slicer. |
Microstructural Changes in the Striatum and Their Impact on Motor and Neuropsychological Performance in Patients with Multiple Sclerosis
|
Publication: PLoS One. 2014 Jul 21;9(7):e101199. PMID: 25047083 | PDF Authors: Cavallari M, Ceccarelli A, Wang GY, Moscufo N, Hannoun S, Matulis CR, Jackson JS, Glanz BI, Bakshi R, Neema M, Guttmann CR. Institution: Dipartimento di Neuroscienze, Salute Mentale e Organi di Senso (NESMOS), Università La Sapienza, Rome, Italy. Background/Purpose: Grey matter (GM) damage is a clinically relevant feature of multiple sclerosis (MS) that has been previously assessed with diffusion tensor imaging (DTI). Fractional anisotropy (FA) of the basal ganglia and thalamus might be increased in MS patients, and correlates with disability scores. Despite the established role of the striatum and thalamus in motor control, mood and cognition, the impact of DTI changes within these structures on motor and neuropsychological performance has not yet been specifically addressed in MS. We investigated DTI metrics of deep GM nuclei and their potential association with mobility and neuropsychological function. DTI metrics from 3T MRI were assessed in the caudate, putamen, and thalamus of 30 MS patients and 10 controls. Sixteen of the patients underwent neuropsychological testing. FA of the caudate and putamen was higher in MS patients compared to controls. Caudate FA correlated with Expanded Disability Status Scale score, Ambulation Index, and severity of depressive symptomatology. Putamen and thalamus FA correlated with deficits in memory tests. In contrast, cerebral white matter (WM) lesion burden showed no significant correlation with any of the disability, mobility and psychometric parameters. Our findings support evidence of FA changes in the basal ganglia in MS patients, as well as deep GM involvement in disabling features of MS, including mobility and cognitive impairment. Deep GM FA appears to be a more sensitive correlate of disability than WM lesion burden. Funding:
|
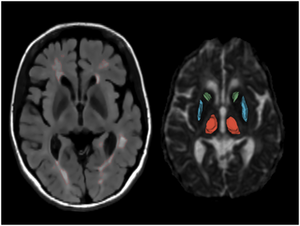 MRI example of white matter lesions and the segmented deep grey matter structures. Lesions and anatomical regions of interest are illustrated on a set of MR images from a 53 year-old male MS patient. Left – axial FLAIR; right – axial diffusivity map. The output of computer-assisted segmentation of the lesions is shown on FLAIR. The 3D models of the manually outlined caudate (green), putamen (blue) and thalamus (red) are overlaid on the fractional anisotropy map of a single section containing these structures. The putamen and the thalamus was manually outlined on AD maps using 3D Slicer (www.slicer.org) |
Design and Initial Evaluation of a Treatment Planning Software System for MRI-guided Laser Ablation in the Brain
|
Publication: Int J Comput Assist Radiol Surg. 2014 Jul;9(4):659-67. PMID: 24091853 Authors: Yeniaras E, Fuentes DT, Fahrenholtz SJ, Weinberg JS, Maier F, Hazle JD, Stafford RJ. Institution: Department of Imaging Physics, University of Texas MD Anderson Cancer Center, Houston, TX, USA. Background/Purpose: An open-source software system for planning magnetic resonance (MR)-guided laser-induced thermal therapy (MRgLITT) in brain is presented. The system was designed to provide a streamlined and operator-friendly graphical user interface (GUI) for simulating and visualizing potential outcomes of various treatment scenarios to aid in decisions on treatment approach or feasibility. Methods: A portable software module was developed on the 3D Slicer platform, an open-source medical imaging and visualization framework. The module introduces an interactive GUI for investigating different laser positions and power settings as well as the influence of patient-specific tissue properties for quickly creating and evaluating custom treatment options. It also provides a common treatment planning interface for use by both open-source and commercial finite element solvers. In this study, an open-source finite element solver for Pennes' bioheat equation is interfaced to the module to provide rapid 3D estimates of the steady-state temperature distribution and potential tissue damage in the presence of patient-specific tissue boundary conditions identified on segmented MR images. Results: The total time to initialize and simulate an MRgLITT procedure using the GUI was [Formula: see text]5 min. Each independent simulation took [Formula: see text]30 s, including the time to visualize the results fused with the planning MRI. For demonstration purposes, a simulated steady-state isotherm contour was correlated with MR temperature imaging (N = 5). The mean Hausdorff distance between simulated and actual contours was 2.0 mm, whereas the mean Dice similarity coefficient was 0.93. Conclusion: We have designed, implemented, and conducted initial feasibility evaluations of a software tool for intuitive and rapid planning of MRgLITT in brain. The retrospective in vivo dataset presented herein illustrates the feasibility and potential of incorporating fast, image-based bioheat predictions into an interactive virtual planning environment for such procedures. Funding:
|
Orbitofrontal Cortex Volume in Area 11/13 Predicts Reward Devaluation, but not Reversal Learning Performance, in Young and Aged Monkeys
|
Publication: J Neurosci. 2014 Jul 23;34(30):9905-16. PMID: 25057193 | PDF Authors: Burke SN, Thome A, Plange K, Engle JR, Trouard TP, Gothard KM, Barnes CA. Institution: ARL Division of Neural Systems, Memory & Aging, Evelyn F. McKnight Brain Institute, University of Arizona, Tucson, AZ, USA. Background/Purpose: The orbitofrontal cortex (OFC) and amygdala are both necessary for decisions based on expected outcomes. Although behavioral and imaging data suggest that these brain regions are affected by advanced age, the extent to which aging alters appetitive processes coordinated by the OFC and the amygdala is unknown. In the current experiment, young and aged bonnet macaques were trained on OFC- and amygdala-dependent tasks that test the degree to which response selection is guided by reward value and can be adapted when expected outcomes change. To assess whether the structural integrity of these regions varies with levels of performance on reward devaluation and object reversal tasks, volumes of areas 11/13 and 14 of the OFC, central/medial (CM), and basolateral (BL) nuclei of the amygdala were determined from high-resolution anatomical MRIs. With age, there were significant reductions in OFC, but not CM and BL, volume. Moreover, the aged monkeys showed impairments in the ability to associate an object with a higher value reward, and to reverse a previously learned association. Interestingly, greater OFC volume of area 11/13, but not 14, was significantly correlated with an animal's ability to anticipate the reward outcome associated with an object, and smaller BL volume was predictive of an animal's tendency to choose a higher value reward, but volume of neither region correlated with reversal learning. Together, these data indicate that OFC volume has an impact on monkeys' ability to guide choice behavior based on reward value but does not impact ability to reverse a previously learned association. 3D Slicer; Pieper and Kikinis, Harvard University) was used to preprocess brain images.
|
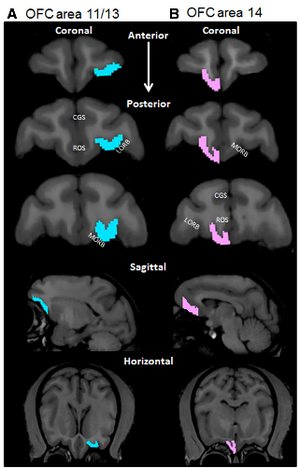 OFC boundaries. Representative boundaries of the OFC for areas 11/13 in the left hemisphere (A; blue) and 14 in the right hemisphere (B; pink) (scan view of left and right hemispheres are reversed). Two independent observers determined the OFC ROI according to the guidelines of Carmichael and Price (1994 ) and Preuss and Goldman-Rakic (1991). The top three images show representative coronal sections along the anterior to posterior axis. The fourth row of images represents a representative sagittal section; and the bottom row represents horizontal sections containing the OFC from the same monkey. CGS,Cingulatesulcus; ROS, rostral sulcus; LORB, lateral orbital sulcus; MORB, medial orbital sulcus. |
Robust Radiomics Feature Quantification using Semiautomatic Volumetric Segmentation
|
Publication: PLoS One. 2014 Jul; 9(7):e102107. PMID: 25025374 | PDF Authors: Parmar C, Rios Velazquez E, Leijenaar R, Jermoumi M, Carvalho S, Mak RH, Mitra S, Shankar BU, Kikinis R, Haibe-Kains B, Lambin P, Aerts HJ. Institution: Department of Radiation Oncology, Dana-Farber Cancer Institute, Brigham and Women's Hospital, Harvard Medical School, Boston, MA, USA. Background/Purpose: Due to advances in the acquisition and analysis of medical imaging, it is currently possible to quantify the tumor phenotype. The emerging field of Radiomics addresses this issue by converting medical images into minable data by extracting a large number of quantitative imaging features. One of the main challenges of Radiomics is tumor segmentation. Where manual delineation is time consuming and prone to inter-observer variability, it has been shown that semi-automated approaches are fast and reduce inter-observer variability. In this study, a semiautomatic region growing volumetric segmentation algorithm, implemented in the free and publicly available 3D Slicer platform, was investigated in terms of its robustness for quantitative imaging feature extraction. Fifty-six 3D-radiomic features, quantifying phenotypic differences based on tumor intensity, shape and texture, were extracted from the computed tomography images of twenty lung cancer patients. These radiomic features were derived from the 3D-tumor volumes defined by three independent observers twice using 3D Slicer, and compared to manual slice-by-slice delineations of five independent physicians in terms of intra-class correlation coefficient (ICC) and feature range. Radiomic features extracted from 3D Slicersegmentations had significantly higher reproducibility (ICC = 0.8560.15, p = 0.0009) compared to the features extracted from the manual segmentations (ICC = 0.7760.17). Furthermore, we found that features extracted from 3D Slicer segmentations were more robust, as the range was significantly smaller across observers (p = 3.819e-07), and overlapping with the feature ranges extracted from manual contouring (boundary lower: p = 0.007, higher: p = 5.863e-06). Our results show that 3D Slicer segmented tumor volumes provide a better alternative to the manual delineation for feature quantification, as they yield more reproducible imaging descriptors. Therefore, 3D Slicer can be employed for quantitative image feature extraction and image data mining research in large patient cohorts. Funding:
UM 2011-5020, KWF UM 2009-4454)
|
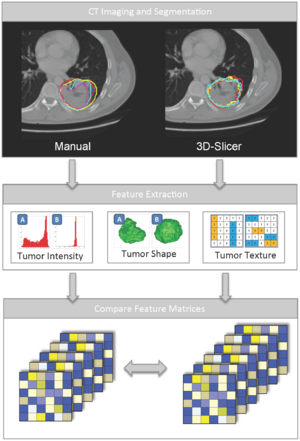 Schematic diagram depicting the overview of the analysis. A: First, we performed five manual delineations and six 3D Slicer segmentations (three observers twice) on twenty lung tumors. B: Second, fifty-six radiomic features quantifying tumor intensity, texture and shape were extracted from these segmentations. C: Third, the resulting feature matrices were compared for robustness of the feature values. |
Tranexamic Acid for Spontaneous Intracerebral Hemorrhage: A Randomized Controlled Pilot Trial (ISRCTN50867461)
|
Publication: J Stroke Cerebrovasc Dis. 2014 Jul;23(6):1312-8. PMID: 24680087 | PDF Authors: Sprigg N, Renton CJ, Dineen RA, Kwong Y, Bath PM. Institution: Stroke Trials Unit, Division of Clinical Neurosciences, School of Medicine, University of Nottingham, Nottingham, UK. Background/Purpose: Spontaneous intracerebral hemorrhage (ICH) can be devastating, particularly if hematoma expansion (HE) occurs. Tranexamic acid (TA), an antifibrinolytic drug, significantly reduced mortality in bleeding patients after trauma in the large CRASH-2 trial. The CRASH-2 ICH substudy found that TA nonsignificantly reduced mortality and dependency in traumatic ICH. The aim of this study was to assess the feasibility of performing a randomized controlled trial of tranexamic acid in spontaneous ICH, ahead of a definitive study. Methods: We performed a single-center, prospective, randomized (2:1), double-blind, placebo-controlled blinded endpoint trial of TA (intravenous 1 g bolus, 1 g infusion/8 h) in acute (<24 hours) spontaneous ICH. The primary objective was to test the feasibility of recruiting to the trial. Other objectives included tolerability (adverse events) and the effect of TA on HE and death and dependency. Results: The trial was feasible, with 24 patients enrolled (TA, n=16; placebo, n=8) between March 2011 and March 2012, and acceptable-only 3 patients declined to participate. All patients received the correct randomized treatment; 1 patient in the TA group did not complete the infusion because of neurologic deterioration. There were no significant differences in secondary outcomes including adverse events, HE, death, and dependency. One patient in the TA group had a deep vein thrombosis. Conclusions: This, the first randomized controlled trial of TA in ICH, found that the protocol could be delivered on schedule (2 patients/mo) and was feasible. Larger studies are needed to assess safety and efficacy of TA in ICH. The data were converted to analyze format before volumetric analysis using 3D Slicer software. |
Bi-modal Non-rigid Registration of Brain MRI Data with Deconvolution of Joint Statistics
|
Publication: IEEE Trans Image Process. 2014 Jul 8. PMID: 25020093 Authors: Pilutti D, Strumia M, Hadjidemetriou S. Institution: Department of Radiology Medical Physics, University Medical Center Freiburg, Freiburg, Germany. Background/Purpose: A brain MRI protocol typically includes several imaging contrasts that can provide complementary information by highlighting different tissue properties. The acquired data sets often need to be coregistered or placed in a standard anatomic space before any further processing. Current registration methods particularly for multicontrast data are computationally very intensive, their resolution is lower than that of the images, and their distance metric and its optimization can be limiting. In this paper, a novel and effective nonrigid registration method is proposed that is based on the restoration of the joint statistics of pairs of such images. The registration is performed with the deconvolution of the joint statistics with an adaptive Wiener filter. The deconvolved statistics are forced back to the spatial domain to estimate a preliminary registration. The spatial transformation is also regularized with Gaussian spatial smoothing. The registration method has been compared with the B-Splines method implemented in 3D Slicer and with the SyN method implemented in the ANTs toolkit. The validation has been performed with a simulated Shepp–Logan phantom, a BrainWeb phantom, the real data of the NIREP database, and real multicontrast data sets of healthy volunteers. The proposed method has shown improved comparative accuracy as well as analytical efficiency. |
|
Publication: IEEE-EMBS International Conference on Biomedical and Health Informatics (BHI), 2014 Jun; | PDF Authors: Burke SN, Thome A, Plange K, Engle JR, Trouard TP, Gothard KM, Barnes CA. Institution: ARL Division of Neural Systems, Memory & Aging, Evelyn F. McKnight Brain Institute, University of Arizona, Tucson, AZ, USA. Background/Purpose: The orbitofrontal cortex (OFC) and amygdala are both necessary for decisions based on expected outcomes. Although behavioral and imaging data suggest that these brain regions are affected by advanced age, the extent to which aging alters appetitive processes coordinated by the OFC and the amygdala is unknown. In the current experiment, young and aged bonnet macaques were trained on OFC- and amygdala-dependent tasks that test the degree to which response selection is guided by reward value and can be adapted when expected outcomes change. To assess whether the structural integrity of these regions varies with levels of performance on reward devaluation and object reversal tasks, volumes of areas 11/13 and 14 of the OFC, central/medial (CM), and basolateral (BL) nuclei of the amygdala were determined from high-resolution anatomical MRIs. With age, there were significant reductions in OFC, but not CM and BL, volume. Moreover, the aged monkeys showed impairments in the ability to associate an object with a higher value reward, and to reverse a previously learned association. Interestingly, greater OFC volume of area 11/13, but not 14, was significantly correlated with an animal's ability to anticipate the reward outcome associated with an object, and smaller BL volume was predictive of an animal's tendency to choose a higher value reward, but volume of neither region correlated with reversal learning. Together, these data indicate that OFC volume has an impact on monkeys' ability to guide choice behavior based on reward value but does not impact ability to reverse a previously learned association. 3D Slicer; Pieper and Kikinis, Harvard University) was used to preprocess brain images. Funding:
|
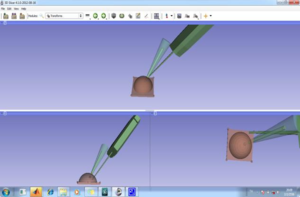 Real-time movement of 3D models in 3D Slicer Software. |
The Efficacy of Neuroendoscopic Treatment for Middle Cranial Fossa Arachnoid Cysts Assessed by MRI 3D Segmentation and Modeling
|
Publication: Childs Nerv Syst. 2014 Jun;30(6):1037-44. PMID: 24258453 Authors: Li Y, Chen X, Xu B. Institution: Department of Neurosurgery, People's Liberation Army General Hospital, Beijing, China. Background/Purpose: The purpose of this study was to present a more precise and objective way to assess the effectiveness of neuroendoscopic application in the treatment of middle cranial fossa arachnoid cysts. Methods: Between March 2009 and December 2012, 28 patients affected by middle cranial fossa arachnoid cysts were initially treated with endoscopic fenestration at the three spaces. The volumes of the cysts on MR images at the time of pre-op and 4 months after surgery were reconstructed by 3D Slicer and quantitatively calculated to compare the volumetric changes. The possible predisposing factors of surgical outcomes were analyzed as well. Results: All the models of the cysts were successfully reconstructed, and the mean volume of the cysts was 135.77 ± 90.43 cm3 before surgery and 93.08 ± 100.31 cm3 after surgery at 4 months follow-up (t = 2.98, P = 0.006). The volumes of those two cases (7.14 %), presenting intracranial hypertension and ventricular dilation after surgery, were dramatically increased, whereas the others were decreased in 20 cases (71.43 %) or remained unchanged in 6 cases (21.43 %). There was significant difference on the age factor among the three result groups (P = 0.001). Conclusion: The reconstruction of 3D for the assessment of the endoscopic fenestration outcomes is a feasible and precise way for clinical work. The variety of outcomes probably depends on age discrepancy. |
Relationship between Interleukin-6 Gene Polymorphism and Hippocampal Volume in Antipsychotic-Naïve Schizophrenia: Evidence for Differential Susceptibility?
|
Publication: PLoS One. 2014 May 2;9(5):e96021. PMID: 24787542 | PDF Authors: Kalmady SV, Venkatasubramanian G, Shivakumar V, Gautham S, Subramaniam A, Jose DA, Maitra A, Ravi V, Gangadhar BN. Institution: The Schizophrenia Clinic, Department of Psychiatry, National Institute of Mental Health and Neuro Sciences, Bangalore, India. Background/Purpose: Various lines of evidence including epidemiological, genetic and foetal pathogenetic models suggest a compelling role for Interleukin-6 (IL-6) in the pathogenesis of schizophrenia. IL-6 mediated inflammatory response triggered by maternal infection or stress induces disruption of prenatal hippocampal development which might contribute towards psychopathology during adulthood. There is a substantial lack of knowledge on how genetic predisposition to elevated IL-6 expression effects hippocampal structure in schizophrenia patients. In this first-time study, we evaluated the relationship between functional polymorphism rs1800795 of IL-6 and hippocampal gray matter volume in antipsychotic-naïve schizophrenia patients in comparison with healthy controls. Funding:
|
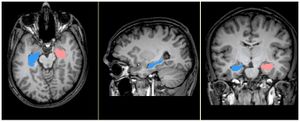 Cerebral MRI depicting manual segmentation of hippocampus. Figure shows MRI with segmented hippocampus in axial, sagittal & coronal sections within 3D Slicer software interface. |
Multi-Modal Glioblastoma Segmentation: Man versus Machine
|
Publication: PLoS One. 2014 May; 9(5):e96873. PMID: 24804720 | PDF Authors: Porz N, Bauer S, Pica A, Schucht P, Beck J, Verma RK, Slotboom J, Reyes M, Wiest R. Institution: Support Center for Advanced Neuroimaging - Institute for Diagnostic and Interventional Neuroradiology, University Hospital Inselspital and University of Bern, Bern, Switzerland. Background/Purpose: Reproducible segmentation of brain tumors on magnetic resonance images is an important clinical need. This study was designed to evaluate the reliability of a novel fully automated segmentation tool for brain tumor image analysis in comparison to manually defined tumor segmentations.Methods: We prospectively evaluated preoperative MR Images from 25 glioblastoma patients. Two independent expert raters performed manual segmentations. Automatic segmentations were performed using the Brain Tumor Image Analysis software (BraTumIA). In order to study the different tumor compartments, the complete tumor volume TV (enhancing part plus non-enhancing part plus necrotic core of the tumor), the TV+ (TV plus edema) and the contrast enhancing tumor volume CETV were identified. We quantified the overlap between manual and automated segmentation by calculation of diameter measurements as well as the Dice coefficients, the positive predictive values, sensitivity, relative volume error and absolute volume error. Results: Comparison of automated versus manual extraction of 2-dimensional diameter measurements showed no significant difference (p = 0.29). Comparison of automated versus manual segmentation of volumetric segmentations showed significant differences for TV+ and TV (p<0.05) but no significant differences for CETV (p>0.05) with regard to the Dice overlap coefficients. Spearman's rank correlation coefficients (ρ) of TV+, TV and CETV showed highly significant correlations between automatic and manual segmentations. Tumor localization did not influence the accuracy of segmentation. Conclusions: In summary, we demonstrated that BraTumIA supports radiologists and clinicians by providing accurate measures of cross-sectional diameter-based tumor extensions. The automated volume measurements were comparable to manual tumor delineation for CETV tumor volumes, and outperformed inter-rater variability for overlap and sensitivity. Funding:
|
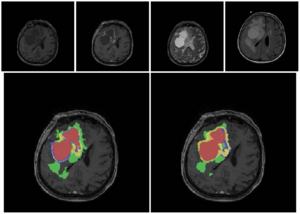 The figures show the original images and the segmentations as overlays on the post-contrast T1-weighted images for a patient with a good overlap of manual and automatic segmentation. Upper row: an axial slice of the original images (T1w, T1wGd, T2, FLAIR from left to right). Bottom row left column: manual segmentation, right column: automatic segmentation. Color code for segmentations: red = necrosis, yellow = enhancing tumor, blue = non-enhancing tumor, green = edema. TV+ corresponds to a combination of all colors, TV corresponds to red+yellow+blue compartments, CETV corresponds to the yellow compartment. Manual segmentation was performed with the open source software 3D Slicer Version 4.2.2.3. |
Rapid Amygdala Responses during Trace Fear Conditioning without Awareness
|
Publication: PLoS One. 2014 May 13;9(5):e96803. PMID: 24823365 | PDF Authors: Balderston NL, Schultz DH, Baillet S, Helmstetter FJ. Institution: Department of Psychology, University of Wisconsin-Milwaukee, Milwaukee, WI, USA. Background/Purpose: The role of consciousness in learning has been debated for nearly 50 years. Recent studies suggest that conscious awareness is needed to bridge the gap when learning about two events that are separated in time, as is true for trace fear conditioning. This has been repeatedly shown and seems to apply to other forms of classical conditioning as well. In contrast to these findings, we show that individuals can learn to associate a face with the later occurrence of a shock, even if they are unable to perceive the face. We used a novel application of magnetoencephalography (MEG) to non-invasively record neural activity from the amygdala, which is known to be important for fear learning. We demonstrate rapid (∼170-200 ms) amygdala responses during the stimulus free period between the face and the shock. These results suggest that unperceived faces can serve as signals for impending threat, and that rapid, automatic activation of the amygdala contributes to this process. In addition, we describe a methodology that can be applied in the future to study neural activity with MEG in other subcortical structures.
|
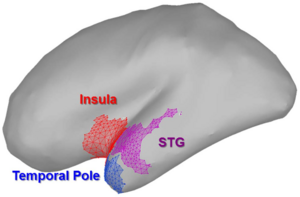 Regions identified as potentially contributing to signal observed in the amygdala. We used a rigorous and unbiased approach to identify potential sources of contamination. Of all the regions sampled, these are the only regions to potentially show evidence of gamma oscillations at ,170 ms. Therefore they were subjected to further analysis. We used 3D Slicer to create the surface models of the cortex, amygdala, and hippocampus. |
BNST Neurocircuitry in Humans
|
Publication: Neuroimage. 2014 May 1;91:311-23. PMID: 24444996 | PDF Authors: Avery SN, Clauss JA, Winder DG, Woodward N, Heckers S, Blackford JU. Institution: Vanderbilt Brain Institute, Vanderbilt University, Nashville, TN, USA. Background/Purpose: Anxiety and addiction disorders are two of the most common mental disorders in the United States, and are typically chronic, disabling, and comorbid. Emerging evidence suggests the bed nucleus of the stria terminalis (BNST) mediates both anxiety and addiction through connections with other brain regions, including the amygdala and nucleus accumbens. Although BNST structural connections have been identified in rodents and a limited number of structural connections have been verified in non-human primates, BNST connections have yet to be described in humans. Neuroimaging is a powerful tool for identifying structural and functional circuits in vivo. In this study, we examined BNST structural and functional connectivity in a large sample of humans. The BNST showed structural and functional connections with multiple subcortical regions, including limbic, thalamic, and basal ganglia structures, confirming structural findings in rodents. We describe two novel connections in the human brain that have not been previously reported in rodents or non-human primates, including a structural connection with the temporal pole, and a functional connection with the paracingulate gyrus. The findings of this study provide a map of the BNST's structural and functional connectivity across the brain in healthy humans. In large part, the BNST neurocircuitry in humans is similar to the findings from rodents and non-human primates; however, several connections are unique to humans. Future explorations of BNST neurocircuitry in anxiety and addiction disorders have the potential to reveal novel mechanisms underlying these disabling psychiatric illnesses. Funding:
|
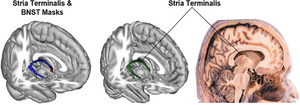 The stria terminalis mask (blue) and BNST mask (red) traced in 3D Slicer are shown on a 3-dimensional template brain (left). The group DTI streamlines map, masked by the stria terminalis mask, is shown in green on a 3-dimensional template brain (middle). Each voxel of the stria terminalis mask overlapped with the group streamlines map, demonstrating that tractography streamlines were coursing through the entire stria terminalis. For reference, a histological section of the stria terminalis is shown (right). |
An Intra-Individual Comparison of MRI, [18F]-FET and [18F]-FLT PET in Patients with High-Grade Gliomas
|
Publication: PLos One. 2014 Apr; 9(4):e95830. PMID: 24759867 | PDF Authors: Nowosielski M, DiFranco MD, Putzer D, Seiz M, Recheis W, Jacobs AH, Stockhammer G, Hutterer M. Institution: Department of Neurology, Innsbruck Medical University, Innsbruck, Austria. Background/Purpose: Intra-individual spatial overlap analysis of tumor volumes assessed by MRI, the amino acid PET tracer [18F]-FET and the nucleoside PET tracer [18F]-FLT in high-grade gliomas (HGG). Methods: MRI, [18F]-FET and [18F]-FLT PET data sets were retrospectively analyzed in 23 HGG patients. Morphologic tumor volumes on MRI (post-contrast T1 (cT1) and T2 images) were calculated using a semi-automatic image segmentation method. Metabolic tumor volumes for [18F]-FET and [18F]-FLT PETs were determined by image segmentation using a threshold-based volume of interest analysis. After co-registration with MRI the morphologic and metabolic tumor volumes were compared on an intra-individual basis in order to estimate spatial overlaps using the Spearman’s rank correlation coefficient and the Mann-Whitney U test. Registration of MRI (cT1 and T2), [18F]-FET and [18F]-FLT PET data sets was performed using the fast rigid registration package in 3D Slicer Version 3.6.3.1.0 [26]. All data were co-registered to MRI cT1 imaging sequence. Results: [18F]-FLT uptake was negative in tumors with no or only moderate contrast enhancement on MRI, detecting only 21 of 23 (91%) HGG. In addition, [18F]-FLT uptake was mainly restricted to cT1 tumor areas on MRI and [18F]-FLT volumes strongly correlated with cT1 volumes (r = 0.841, p,0.001). In contrast, [18F]-FET PET detected 22 of 23 (96%) HGG. [18F]-FET uptake beyond areas of cT1 was found in 61% of cases and [18F]-FET volumes showed only a moderate correlation with cT1 volumes (r = 0.573, p,0.001). Metabolic tumor volumes beyond cT1 tumor areas were significantly larger for [18F]-FET compared to [18F]-FLT tracer uptake (8.3 vs. 2.7 cm3, p,0.001). Conclusion: In HGG [18F]-FET but not [18F]-FLT PET was able to detect metabolic active tumor tissue beyond contrast enhancing tumor on MRI. In contrast to [18F]-FET, blood-brain barrier breakdown seems to be a prerequisite for [18F]-FLT tracer uptake. Funding:
|
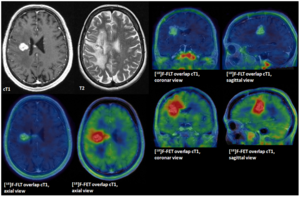 [18F]-FET tracer uptake independent from contrast enhancement on MRI, overlap. GBM WHO IV at 2nd tumor recurrence. Contrast enhanced T1 sequences (cT1) tumor volume 5.4 cm3, metabolically active tumor volumes for [18F]-FET 17.58 cm3 and [18F]-FLT of 3.9 cm3. Overlap analysis detected a [18F]-FET volume of 9.2 cm3 beyond the borders of cT1. |
The Swallow Tail Appearance of the Healthy Nigrosome – A New Accurate Test of Parkinson’s Disease: A Case- Control and Retrospective Cross-Sectional MRI Study at 3T
|
Publication: PLos One 2014 Apr; 9(4):e93814. PMID: 24710392 | PDF Authors: Schwarz ST, Afzal M, Morgan PS, Bajaj N, Gowland PA, Auer DP. Institution: Stroke Trials Unit, Division of Clinical Neurosciences, School of Medicine, University of Nottingham, Nottingham, UK. Background/Purpose: There is no well-established in vivo marker of nigral degeneration in Parkinson’s disease (PD). An ideal imaging marker would directly mirror the loss of substantia nigra dopaminergic neurones, which is most prominent in sub-regions called nigrosomes. High-resolution, iron-sensitive, magnetic resonance imaging (MRI) at 7T allows direct nigrosome-1 visualisation in healthy people but not in PD. Here, we investigated the feasibility of nigrosome-1 detection using 3T - susceptibility- weighted (SWI) MRI and the diagnostic accuracy that can be achieved for diagnosing PD in a clinical population. 114 high- resolution 3T – SWI-scans were reviewed consisting of a prospective case-control study in 19 subjects (10 PD, 9 controls) and a retrospective cross-sectional study in 95 consecutive patients undergoing routine clinical SWI-scans (.50 years, 9 PD, 81 non-PD, 5 non-diagnostic studies excluded). Two raters independently classified subjects into PD and non-PD according to absence or presence of nigrosome-1, followed by consensus reading. Diagnostic accuracy was assessed against clinical diagnosis as gold standard. Absolute inter- and intra-rater agreement was $94% (kappa$0.82, p,0.001). In the prospective study 8/9 control and 8/10 PD; and in the retrospective study 77/81 non-PD and all 9 PD subjects were correctly classified. Diagnostic accuracy of the retrospective cohort was: sensitivity 100%, specificity 95%, NPV 1, PPV 0.69 and accuracy 96% which dropped to 91% when including non-diagnostic scans (‘intent to diagnose’). The healthy nigrosome-1 can be readily depicted on high-resolution 3T - SWI giving rise to a ‘swallow tail’ appearance of the dorsolateral substantia nigra, and this feature is lost in PD. Visual radiological assessment yielded a high diagnostic accuracy for PD vs. an unselected clinical control population. Assessing the substantia nigra on SWI for the typical ‘swallow tail’ appearance has potential to become a new and easy applicable 3T MRI diagnostic tool for nigral degeneration in PD. Funding:
|
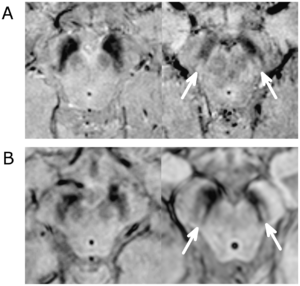 SWI MRI in PD and Non-PD patients. A. High resolution SWI MRI (3D gradient echo EPI, magnitude image) of a PD patient (left, 60 years, female, UPDRS: 53, HY score 3, nigrosome-1 absent bilaterally) and a control (right, 61 years, female, nigrosome-1 present bilaterally). B. Clinical high resolution 3D-T2*/SWI MRI (Philips ‘PRESTO’ sequence), of a PD patient (left, 58 years old, male, nigrosome-1 absent bilaterally) and a non-PD patient (right, 70 years old, female, diagnosed with an aneurysmal subarachnoid haemorrhage, nigrosome-1 present bilaterally). The magnitude images were reviewed in multiple planes using 3D Slicer or a locally developed image viewing and analysis software. |
Clinical and Computed Tomographic Predictors of Chronic Bronchitis in COPD: A Cross Sectional Analysis of the COPDGene Study
|
Publication: Respir Res. 2014 Apr 27;15(1):52. PMID: 24766722 | PDF Authors: Kim V, Davey A, Comellas AP, Han MK, Washko G, Martinez CH, Lynch D, Lee JH, Silverman EK, Crapo JD, Make BJ, Criner GJ. Institution: Temple University School of Medicine, Philadelphia, PA, USA. Background/Purpose: Chronic bronchitis (CB) has been related to poor outcomes in Chronic Obstructive Pulmonary Disease (COPD). From a clinical standpoint, we have shown that subjects with CB in a group with moderate to severe airflow obstruction were younger, more likely to be current smokers, male, Caucasian, had worse health related quality of life, more dyspnea, and increased exacerbation history compared to those without CB. We sought to further refine our clinical characterization of chronic bronchitics in a larger cohort and analyze the CT correlates of CB in COPD subjects. We hypothesized that COPD patients with CB would have thicker airways and a greater history of smoking, acute bronchitis, allergic rhinitis, and occupational exposures compared to those without CB. Methods: We divided 2703 GOLD 1-4 subjects in the Genetic Epidemiology of COPD (COPDGene(R)) Study into two groups based on symptoms: chronic bronchitis (CB+, n = 663, 24.5%) and no chronic bronchitis (CB-, n = 2040, 75.5%). Subjects underwent extensive clinical characterization, and quantitative CT analysis to calculate mean wall area percent (WA%) of 6 segmental airways was performed using VIDA PW2. Square roots of the wall areas of bronchi with internal perimeters 10 mm and 15 mm (Pi10 and Pi15, respectively),%emphysema,%gas trapping, were calculated using 3D Slicer. Results: There were no differences in%emphysema (11.4 ± 12.0 vs. 12.0 ± 12.6%, p = 0.347) or%gas trapping (35.3 ± 21.2 vs. 36.3 ± 20.6%, p = 0.272) between groups. Mean segmental WA% (63.0 ± 3.2 vs. 62.0 ± 3.1%, p < 0.0001), Pi10 (3.72 ± 0.15 vs. 3.69 ± 0.14 mm, p < 0.0001), and Pi15 (5.24 ± 0.22 vs. 5.17 ± 0.20, p < 0.0001) were greater in the CB + group. Greater percentages of gastroesophageal reflux, allergic rhinitis, histories of asthma and acute bronchitis, exposures to dusts and occupational exposures, and current smokers were seen in the CB + group. In multivariate binomial logistic regression, male gender, Caucasian race, a lower FEV1%, allergic rhinitis, history of acute bronchitis, current smoking, and increased airway wall thickness increased odds for having CB. Conclusion: Histories of asthma, allergic rhinitis, acute bronchitis, current smoking, a lower FEV1%, Caucasian race, male gender, and increased airway wall thickness are associated with CB. These data provide clinical and radiologic correlations to the clinical phenotype of CB. Funding:
|
Faceted Visualization of Three Dimensional Neuroanatomy by Combining Ontology with Faceted Search
|
Publication: Neuroinformatics. 2014 Apr;12(2):245-59. PMID: 24006207 | PDF Authors: Veeraraghavan H, Miller JV. Institution: Memorial Sloan-Kettering Cancer Center, New York, NY, USA. Background/Purpose: In this work, we present a faceted-search based approach for visualization of anatomy by combining a three dimensional digital atlas with an anatomy ontology. Specifically, our approach provides a drill-down search interface that exposes the relevant pieces of information (obtained by searching the ontology) for a user query. Hence, the user can produce visualizations starting with minimally specified queries. Furthermore, by automatically translating the user queries into the controlled terminology our approach eliminates the need for the user to use controlled terminology. We demonstrate the scalability of our approach using an abdominal atlas and the same ontology. We implemented our visualization tool on the opensource 3D Slicer software. We present results of our visualization approach by combining a modified Foundational Model of Anatomy (FMA) ontology with the Surgical Planning Laboratory (SPL) Brain 3D digital atlas, and geometric models specific to patients computed using the SPL brain tumor dataset. Funding:
|
An ITK Implementation of a Physics-based Non-rigid Registration Method for Brain Deformation in Image-guided Neurosurgery
|
Publication: Front Neuroinform. 2014 Apr 7;8:33. PMID: 24778613 | PDF Authors: Liu Y, Kot A, Drakopoulos F, Yao C, Fedorov A, Enquobahrie A, Clatz O, Chrisochoides NP. Institution: CRTC Lab and Computer Science, Old Dominion University, Norfolk, VA, USA. Background/Purpose: As part of the ITK v4 project efforts, we have developed ITK filters for physics-based non-rigid registration (PBNRR), which satisfies the following requirements: account for tissue properties in the registration, improve accuracy compared to rigid registration, and reduce execution time using GPU and multi-core accelerators. The implementation has three main components: (1) Feature Point Selection, (2) Block Matching (mapped to both multi-core and GPU processors), and (3) a Robust Finite Element Solver. The use of multi-core and GPU accelerators in ITK v4 provides substantial performance improvements. For example, for the non-rigid registration of brain MRIs, the performance of the block matching filter on average is about 10 times faster when 12 hyperthreaded multi-cores are used and about 83 times faster when the NVIDIA Tesla GPU is used in Dell Workstation. Funding:
|
Morphological Parameters Associated with Ruptured Posterior Communicating Aneurysms
|
Publication: PLoS One. 2014 Apr;9(4):e94837. PMID: 24733151 | PDF Authors: Ho A, Lin N, Charoenvimolphan N, Stanley M, Frerichs KU, Day AL, Du R. Institution: Department of Neurosurgery, Brigham and Women's Hospital, Harvard Medical School, Boston, MA, USA. Background/Purpose: The rupture risk of unruptured intracranial aneurysms is known to be dependent on the size of the aneurysm. However, the association of morphological characteristics with ruptured aneurysms has not been established in a systematic and location specific manner for the most common aneurysm locations. We evaluated posterior communicating artery (PCoA) aneurysms for morphological parameters associated with aneurysm rupture in that location. CT angiograms were evaluated to generate 3-D models of the aneurysms and surrounding vasculature. Univariate and multivariate analyses were performed to evaluate morphological parameters including aneurysm volume, aspect ratio, size ratio, distance to ICA bifurcation, aneurysm angle, vessel angles, flow angles, and vessel-to-vessel angles. From 2005-2012, 148 PCoA aneurysms were treated in a single institution. Preoperative CTAs from 63 patients (40 ruptured, 23 unruptured) were available and analyzed. Multivariate logistic regression revealed that smaller volume (p = 0.011), larger aneurysm neck diameter (0.048), and shorter ICA bifurcation to aneurysm distance (p = 0.005) were the most strongly associated with aneurysm rupture after adjusting for all other clinical and morphological variables. Multivariate subgroup analysis for patients with visualized PCoA demonstrated that larger neck diameter (p = 0.018) and shorter ICA bifurcation to aneurysm distance (p = 0.011) were significantly associated with rupture. Intracerebral hemorrhage was associated with smaller volume, larger maximum height, and smaller aneurysm angle, in addition to lateral projection, male sex, and lack of hypertension. We found that shorter ICA bifurcation to aneurysm distance is significantly associated with PCoA aneurysm rupture. This is a new physically intuitive parameter that can be measured easily and therefore be readily applied in clinical practice to aid in the evaluation of patients with PCoA aneurysms.
|
 3D model of PCoA aneurysm depicting angular variables of the surrounding vasculature. There were three vessel-to-vessel angles measured. The ICA1 to ICA2 angle refers to the angle between the distal ICA (ICA2) and the proximal ICA (ICA1). The ICA1 to PCoA angle refers to the angle formed between the proximal ICA (ICA1) and PCoA. We utilized 3D Slicer, an open source, multi-platform visualization and image analysis software. |
Computational Modelling of Emboli Travel Trajectories in Cerebral Arteries: Influence of Microembolic Particle Size and Density
|
Publication: Biomech Model Mechanobiol. 2014 Apr;13(2):289-302. PMID: 24585077 | PDF Authors: Fabbri D, Long Q, Das S, Pinelli M. Institution: Brunel Institute for Bioengineering, Brunel University, Uxbridge, UK. Background/Purpose: Ischaemic stroke is responsible for up to 80 % of stroke cases. Prevention of the reoccurrence of ischaemic attack or stroke for patients who survived the first symptoms is the major treatment target. Accurate diagnosis of the emboli source for a specific infarction lesion is very important for a better treatment for the patient. However, due to the complex blood flow patterns in the cerebral arterial network, little is known so far of the embolic particle flow trajectory and its behaviour in such a complex flow field. The present study aims to study the trajectories of embolic particles released from carotid arteries and basilar artery in a cerebral arterial network and the influence of particle size, mass and release location to the particle distributions, by computational modelling. The cerebral arterial network model, which includes major arteries in the circle of Willis and several generations of branches from them, was generated from MRI images. Particles with diameters of 200, 500 and 800 μm and densities of 800, 1,030 and 1,300 kg/m3 were released in the vessel’s central and near-wall regions. A fully coupled scheme of particle and blood flow in a computational fluid dynamics software ANASYS CFX 13 was used in the simulations. The results show that heavy particles (density large than blood or a diameter larger than 500 μm ) normally have small travel speeds in arteries; larger or lighter embolic particles are more likely to travel to large branches in cerebral arteries. In certain cases, all large particles go to the middle cerebral arteries; large particles with higher travel speeds in large arteries are likely to travel at more complex and tortuous trajectories; emboli raised from the basilar artery will only exit the model from branches of basilar artery and posterior cerebral arteries. A modified Circle of Willis configuration can have significant influence on particle distributions. The local branch patterns of internal carotid artery to middle cerebral artery and anterior communicating artery can have large impact on such distributions.
|
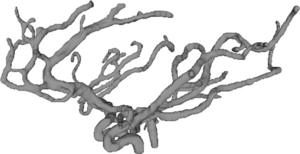 3D surface rendering of the cerebral arterial network. 3D Slicer was used for image processing and the 3D reconstruction. |
Adaptive Distance Metric Learning for Diffusion Tensor Image Segmentation
|
Publication: PLoSOne 2014 Mar; 9(3):e92069. PMID: 24651858 | PDF Authors: Kong Y, Wang D, Shi L, Hui SC, Chu WC. Institution: Department of Imaging and Interventional Radiology, The Chinese University of Hong Kong, Shatin, New Territories, Hong Kong, China. Background/Purpose: High quality segmentation of diffusion tensor images (DTI) is of key interest in biomedical research and clinical application. In previous studies, most efforts have been made to construct predefined metrics for different DTI segmentation tasks. These methods require adequate prior knowledge and tuning parameters. To overcome these disadvantages, we proposed to automatically learn an adaptive distance metric by a graph based semi-supervised learning model for DTI segmentation. An original discriminative distance vector was first formulated by combining both geometry and orientation distances derived from diffusion tensors. The kernel metric over the original distance and labels of all voxels were then simultaneously optimized in a graph based semi-supervised learning approach. Finally, the optimization task was efficiently solved with an iterative gradient descent method to achieve the optimal solution. With our approach, an adaptive distance metric could be available for each specific segmentation task. Experiments on synthetic and real brain DTI datasets were performed to demonstrate the effectiveness and robustness of the proposed distance metric learning approach. The performance of our approach was compared with three classical metrics in the graph based semi-supervised learning framework. Funding:
(Project No.: CUHK 411811, 475711, 416712, 473012, 462611, SEG_CUHK02)
|
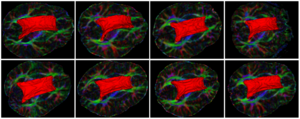 Surfaces of the corpus callosum segmentation results from another 8 datasets using our proposed approach. With the help of 3D Slicer tool, we visualized the 3D surfaces of the manual segmentation. |
Multiple White Matter Volume Reductions in Patients with Panic Disorder: Relationships between Orbitofrontal Gyrus Volume and Symptom Severity and Social Dysfunction
|
Publication: PLoS One. 2014 Mar 24;9(3):e92862. PMID: 24663245| PDF Authors: Konishi J, Asami T, Hayano F, Yoshimi A, Hayasaka S, Fukushima H, Whitford TJ, Inoue T, Hirayasu Y. Institution: Department of Psychiatry, Graduate School of Medicine, Yokohama City University, Yokohama, Japan. Background/Purpose: Numerous brain regions are believed to be involved in the neuropathology of panic disorder (PD) including fronto-limbic regions, thalamus, brain stem, and cerebellum. However, while several previous studies have demonstrated volumetric gray matter reductions in these brain regions, there have been no studies evaluating volumetric white matter changes in the fiber bundles connecting these regions. In addition, although patients with PD typically exhibit social, interpersonal and occupational dysfunction, the neuropathologies underlying these dysfunctions remain unclear. A voxel-based morphometry study was conducted to evaluate differences in regional white matter volume between 40 patients with PD and 40 healthy control subjects (HC). Correlation analyses were performed between the regional white matter volumes and patients' scores on the Panic Disorder Severity Scale (PDSS) and the Global Assessment of Functioning (GAF). Patients with PD demonstrated significant volumetric reductions in widespread white matter regions including fronto-limbic, thalamo-cortical and cerebellar pathways (p<0.05, FDR corrected). Furthermore, there was a significant negative relationship between right orbitofrontal gyrus (OFG) white matter volume and the severity of patients' clinical symptoms, as assessed with the PDSS. A significant positive relationship was also observed between patients' right OFG volumes and their scores on the GAF. Our results suggest that volumetric reductions in widespread white matter regions may play an important role in the pathology of PD. In particular, our results suggest that structural white matter abnormalities in the right OFG may contribute to the social, personal and occupational dysfunction typically experienced by patients with PD. Funding:
|
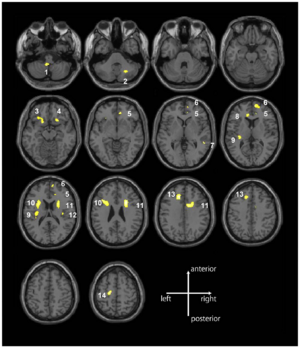 White matter volume reductions in the patients with panic disorder compared with the healthy control subjects. The patients with panic disorder had significant volume reductions in 14 distinct white matter regions (clusters) compared with the healthy control subjects (p,.05, FDR-corrected). The 14 white matter regions included fronto-limbic regions (bilateral OFG, right superior frontal gyrus, left precentral gyrus, bilateral cingulum, and insula), thalamo-cortical pathways (anterior and superior corona radiata), right superior and middle temporal gyrus, and the cerebellum. The gray-scale image was parcellated into each cluster using 3D Slicer. |
Using Stress MRI to Analyze the 3D Changes in Apical Ligament Geometry from Rest to Maximal Valsalva: A Pilot Study
|
Publication: Int Urogynecol J. 2014 Feb;25(2):197-203. PMID: 24008367 | PDF Authors: Luo J, Betschart C, Chen L, Ashton-Miller JA, Delancey JO. Institution: Pelvic Floor Research Group, University of Michigan, Ann Arbor, MI, USA. Background/Purpose: A method was developed using 3D stress magnetic resonance imaging (MRI) and was piloted to test hypotheses concerning changes in apical ligament lengths and lines of action from rest to maximal Valsalva. Methods: Ten women with (cases) and ten without (controls) pelvic organ prolapse (POP) were selected from an ongoing case-control study. Supine, multiplanar stress MRI was performed at rest and at maximal Valsalva and was imported into 3D Slicer v.3.4.1 and aligned. The 3D reconstructions of the uterus and vagina, cardinal ligament (CL), deep uterosacral ligament (USLd), and pelvic bones were created. Ligament length and orientation were then measured. Results: Adequate ligament representations were possible in all 20 study participants. When cases were compared with controls, the curve length of the CL at rest was 71 ±16 mm vs. 59 ± 9 mm (p = 0.051), and the USLd was 38 ± 16 mm vs. 36 ± 11 mm (p = 0.797). Similarly, the increase in CL length from rest to strain was 30 ± 16 mm vs. 15 ± 9 mm (p = 0.033), and USLd was 15 ± 12 mm vs. 7 ± 4 mm (p = 0.094). Likewise, the change in USLd angle was significantly different from CL (p < 0.001). Conclusion: This technique allows quantification of 3D geometry at rest and at strain. In our pilot sample, at maximal Valsalva, CL elongation was greater in cases than controls, whereas USLd was not; CL also exhibited greater changes in ligament length, and USLd exhibited greater changes in ligament inclination angle. Funding:
|
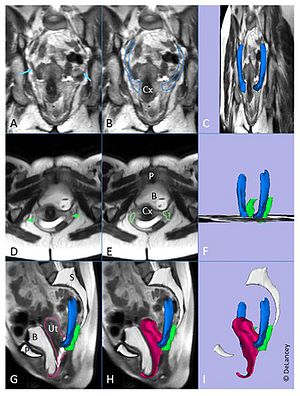 Creating the 3D model: Coronal magnetic resonance image (MRI) showing the cardinal ligament (a; blue arrow) and with outline (b). Model of cardinal ligament (c, blue) shown in slightly skewed coronal image. Axial image showing the deep uterosacral ligament (d; green arrow) and with outline (e). Model of deep uterosacral ligament f; green) shown in the same view angle as (c). Midsagittal image with outline (g) and 3D model (h) of uterus and vagina. Model without image (i) shown in same view angle as (c). Cx cervix, P pubic symphysis, B bladder, Ut uterus, V vagina, S sacrum. |
Scanning Fast and Slow: Current Limitations of 3 Tesla Functional MRI and Future Potential
|
Publication: Frontiersin Physics 2014 Feb;2(1):1-8. | PDF Authors: Boubela RN, Kalcher K, Nasel C, Moser E. Institution: Center for Medical Physics and Biomedical Engineering, Medical University of Vienna, Vienna, Austria. Background/Purpose: Functional MRI at 3T has become a workhorse for the neurosciences, e.g., neurology, psychology, and psychiatry, enabling non-invasive investigation of brain function and connectivity. However, BOLD-based fMRI is a rather indirect measure of brain function, confounded by physiology related signals, e.g., head or brain motion, brain pulsation, blood flow, intermixed with susceptibility differences close or distant to the region of neuronal activity. Even though a plethora of preprocessing strategies have been published to address these confounds, their efficiency is still under discussion. In particular, physiological signal fluctuations closely related to brain supply may mask BOLD signal changes related to “true” neuronal activation. Here we explore recent technical and methodological advancements aimed at disentangling the various components, employing fast multiband vs. standard EPI, in combination with fast temporal ICA. Our preliminary results indicate that fast (TR <0.5 s) scanning may help to identify and eliminate physiologic components, increasing tSNR and functional contrast. In addition, biological variability can be studied and task performance better correlated to other measures. This should increase specificity and reliability in fMRI studies. Furthermore, physiological signal changes during scanning may then be recognized as a source of information rather than a nuisance. As we are currently still undersampling the complexity of the brain, even at a rather coarse macroscopic level, we should be very cautious in the interpretation of neuroscientific findings, in particular when comparing different groups (e.g., age, sex, medication, pathology, etc.). From a technical point of view our goal should be to sample brain activity at layer specific resolution with low TR, covering as much of the brain as possible without violating SAR limits. We hope to stimulate discussion toward a better understanding and a more quantitative use of fMRI. Funding:
|
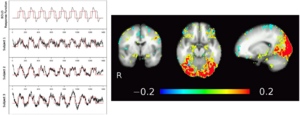 Temporal ICA of low TR, multiband EPI fMRI data from three subjects. Using a strong task (image matching paradigm, block design shown in red). tICA identifies the activation map in the visual cortex but also adjacent to the amygdalae and at the fronto-basis, corresponding to task related time courses as well as strong pulsations (high frequency noise). Note also the major draining vein (V. parieto-occipitalis interna connecting to V. basalis Rosenthal) following medially the temporal lobe next to the amygdalae. The three dimensional visualization of the veins as measured with SWI was done in 3D Slicer. |
Molecular Drivers and Cortical Spread of Lateral Entorhinal Cortex Dysfunction in Preclinical Alzheimer’s Disease
|
Publication: Nat Neurosci. 2014 Feb;17(2):304-11. PMID: 24362760 | PDF Authors: Khan UA, Liu L, Provenzano FA, Berman DE, Profaci CP, Sloan R, Mayeux R, Duff KE, Small SA. Institution: Taub Institute for Research on Alzheimer's Disease and the Aging Brain, Columbia University College of Physicians and Surgeons, New York, NY, USA. Background/Purpose: The entorhinal cortex has been implicated in the early stages of Alzheimer's disease, which is characterized by changes in the tau protein and in the cleaved fragments of the amyloid precursor protein (APP). We used a high-resolution functional magnetic resonance imaging (fMRI) variant that can map metabolic defects in patients and mouse models to address basic questions about entorhinal cortex pathophysiology. The entorhinal cortex is divided into functionally distinct regions, the medial entorhinal cortex (MEC) and the lateral entorhinal cortex (LEC), and we exploited the high-resolution capabilities of the fMRI variant to ask whether either of them was affected in patients with preclinical Alzheimer's disease. Next, we imaged three mouse models of disease to clarify how tau and APP relate to entorhinal cortex dysfunction and to determine whether the entorhinal cortex can act as a source of dysfunction observed in other cortical areas. We found that the LEC was affected in preclinical disease, that LEC dysfunction could spread to the parietal cortex during preclinical disease and that APP expression potentiated tau toxicity in driving LEC dysfunction, thereby helping to explain regional vulnerability in the disease. Funding:
|
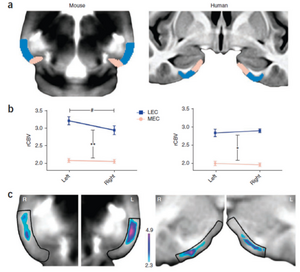 The LEC shows evidence of high metabolism in young unaffected individuals. (a) The entorhinal cortex was segmented into the MEC (pink) and the LEC (blue) in template brains of young wild-type mice (left) and young healthy human subjects (right). (b) In young wild-type mice (left), the LEC (blue) was found to have higher CBV values than the MEC (pink) (**F1,34 = 475.176, P < 0.001), and the left LEC was found to have higher CBV values than the right LEC (#F1,34 = 6.680, P = 0.01). In young healthy human subjects (right), the LEC (blue) was found to have higher CBV values than the MEC (pink) (*F1,34 = 706.199, P <0.001). Data are presented as mean ± s.e.m. (c) Thresholded mean CBV maps in young wild-type mice (left) revealed that the CBV was higher in the LEC than the MEC, with the left LEC showing the highest CBV. Mean CBV maps in young healthy human subjects (right) revealed that the LEC had a higher CBV than the MEC. This image map was thresholded above the mean intensity of the MEC and color-coded using 3D Slicer. |
Retrosigmoid Implantation of an Active Bone Conduction Stimulator in a Patient with Chronic Otitis Media
|
Publication: Auris Nasus Larynx. 2014 Feb;41(1):84-7. PMID: 23722197 Authors: Lassaletta L, Sanchez-Cuadrado I, Muñoz E, Gavilan J. Institution: Department of Otolaryngology, "La Paz" University Hospital, IdiPaz Research Institute, Madrid, Spain. Background/Purpose: Percutaneous bone conduction implants are widely used in patients with conductive and mixed hearing loss with no benefit from conventional air conduction hearing aids. These devices have several complications including skin reaction, wound infection, growth of skin over the abutment, and implant extrusion. We describe a case of a transcutaneous bone conduction implantation (Bonebridge, Med-el) in a patient with conductive hearing loss due to chronic otitis media. Surgical planification was performed with the software 3D Slicer 4.1. According to this program, the implant transductor was positioned in the retrosigmoid area. Aided thresholds demonstrate a significant benefit, with an improvement from 68dB to 25dB. Speech discrimination scores improved 35dB. The patient is very happy and uses her device daily. The Bonebridge implant is a promising transcutaneous bone conduction implant for patients with conductive hearing loss. Retrosigmoid implantation may be useful in cases with mastoid pathology or previous surgery.
|
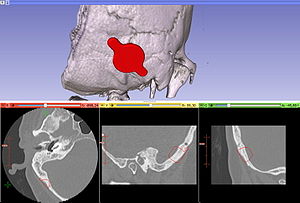 Top 3D Slicer reconstruction showing the planned location of the transductor (red) in the right retrosigmoid area. The theoretical position and area of dura compression (red figure) is shown in the axial (bottom, left), coronal (bottom, middle) and sagital (bottom, right) CT scan images. Note the planned position of one of the screws in the coronal view. |
Evaluation of Prostate Segmentation Algorithms for MRI: The PROMISE12 Challenge
|
Publication: Med Image Anal. 2014 Feb;18(2):359-73. PMID: 24418598 | PDF Authors: Litjens G, Toth R, van de Ven W, Hoeks C, Kerkstra S, van Ginneken B, Vincent G, Guillard G, Birbeck N, Zhang J, Strand R, Malmberg F, Ou Y, Davatzikos C, Kirschner M, Jung F, Yuan J, Qiu W, Gao Q, Edwards PE, Maan B, van der Heijden F, Ghose S, Mitra J, Dowling J, Barratt D, Huisman H, Madabhushi A. Institution: Radboud University Nijmegen Medical Centre, Nijmegen, The Netherlands. Background/Purpose: Prostate MRI image segmentation has been an area of intense research due to the increased use of MRI as a modality for the clinical workup of prostate cancer. Segmentation is useful for various tasks, e.g. to accurately localize prostate boundaries for radiotherapy or to initialize multi-modal registration algorithms. In the past, it has been difficult for research groups to evaluate prostate segmentation algorithms on multi-center, multi-vendor and multi-protocol data. Especially because we are dealing with MR images, image appearance, resolution and the presence of artifacts are affected by differences in scanners and/or protocols, which in turn can have a large influence on algorithm accuracy. The Prostate MR Image Segmentation (PROMISE12) challenge was setup to allow a fair and meaningful comparison of segmentation methods on the basis of performance and robustness. In this work we will discuss the initial results of the online PROMISE12 challenge, and the results obtained in the live challenge workshop hosted by the MICCAI2012 conference. In the challenge, 100 prostate MR cases from 4 different centers were included, with differences in scanner manufacturer, field strength and protocol. A total of 11 teams from academic research groups and industry participated. Algorithms showed a wide variety in methods and implementation, including active appearance models, atlas registration and level sets. Evaluation was performed using boundary and volume based metrics which were combined into a single score relating the metrics to human expert performance. The winners of the challenge where the algorithms by teams Imorphics and ScrAutoProstate, with scores of 85.72 and 84.29 overall. Both algorithms where significantly better than all other algorithms in the challenge (p<0.05) and had an efficient implementation with a run time of 8min and 3s per case respectively. Overall, active appearance model based approaches seemed to outperform other approaches like multi-atlas registration, both on accuracy and computation time. Although average algorithm performance was good to excellent and the Imorphics algorithm outperformed the second observer on average, we showed that algorithm combination might lead to further improvement, indicating that optimal performance for prostate segmentation is not yet obtained. Funding:
|
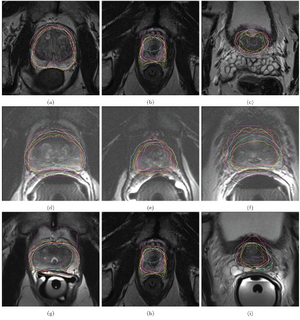 Qualitative segmentation results of case 3 (a, b, c), case 10 (d, e, f) and case 25 (g, h, i) at the center (a, d, g), apex (b, e, h) and base (c, f, i) of the prostate. Case 3 had the best, case 10 reasonable and case 25 the worst algorithm scores on average. The different colors indicate the results for the different teams. Contouring was performed by annotating spline-connected points in either 3D Slicer or MeVisLab. |
The Detection and Visualization of Brain Tumors on T2-Weighted MRI Images using Multiparameter Feature Blocks
|
Publication: International Journal of Emerging Technology and Advanced Engineering. 2014 Feb; 4(2):127-31. | PDF Authors: Wakchaure SL, Ghuge DG, Musale DS. Institution: Department of Computer Science, Indore Institute of Science and Technology, Madhya Pradesh, India. Background/Purpose: The main topic of this paper is to segment brain tumors, their components (edema and necrosis) and internal structures of the brain in 3D MR images. For tumor segmentation we propose a framework that is a combination of region-based and boundary-based paradigms. In this framework, segment the brain using a method adapted for pathological cases and extract some global information on the tumor by symmetry based histogram analysis. The objective of this paper is to present an analytical method to detect lesions or tumors in digitized medical images for 3D visualization. This research opens a new window in the field of image processing by 3D Volume Representation of tumor through the use of Magnetic Resonant Imaging and an integrated software tool 3D Slicer. The authors developed a tumor detection method using three parameters; edge (E), gray (G), and contrast (H) values. The method proposed here studied the EGH parameters in a supervised block of input images. These feature blocks were compared with standardized parameters (derived from normal template block) to detect abnormal occurrences, e.g. image block which contain lesions or tumor cells. The proposed method shows more precision among the others. Processing time is less. This will help the physicians in analyzing the brain tumors accurately and efficiently. |
Spinal Curvature Measurement by Tracked Ultrasound Snapshots
|
Publication: Ultrasound Med Biol. 2014 Feb;40(2):447-54. PMID: 24268452 Authors: Ungi T, King F, Kempston M, Keri Z, Lasso A, Mousavi P, Rudan J, Borschneck DP, Fichtinger G. Institution: Laboratory for Percutaneous Surgery, School of Computing, Queen's University, Kingston, ON, Canada. Background/Purpose: Monitoring spinal curvature in adolescent kyphoscoliosis requires regular radiographic examinations; however, the applied ionizing radiation increases the risk of cancer. Ultrasound imaging is favored over radiography because it does not emit ionizing radiation. Therefore, we tested an ultrasound system for spinal curvature measurement, with the help of spatial tracking of the ultrasound transducer. Tracked ultrasound was used to localize vertebral transverse processes as landmarks along the spine to measure curvature angles. The method was tested in two scoliotic spine models by localizing the same landmarks using both ultrasound and radiographic imaging and comparing the angles obtained. A close correlation was found between tracked ultrasound and radiographic curvature measurements. Differences between results of the two methods were 1.27 ± 0.84° (average ± SD) in an adult model and 0.96 ± 0.87° in a pediatric model. Our results suggest that tracked ultrasound may become a more tolerable and more accessible alternative to radiographic spine monitoring in adolescent kyphoscoliosis. |
Robust Radiomics Feature Quantification using Semiautomatic Volumetric Segmentation
|
Publication: Med. Phys. 2014; 41(6):452. Authors: Rios E, Parmar C, Jermoumi M, Aerts H. Institution: Dana-Farber Cancer Institute, Boston, MA, USA. Background/Purpose: Recent advances in medical imaging technologies provide opportunities to quantify the tumor phenotype throughout the course of treatment non-invasively. The emerging field of Radiomics addresses this by converting medical images into minable data by applying a large number of quantitative imaging algorithms. Accurate tumor segmentation is one of the main challenges of Radiomics. It has been shown that semiautomatic segmentation approaches efficiently reduce inter-observer variability as compared to the time consuming manual delineations. In this study, a semiautomatic volumetric segmentation algorithm, implemented in the free and publicly available 3D Slicer platform, was investigated in terms of its robustness for Radiomics features quantification. Methods: Fifty-six 3D-Radiomics features, quantifying phenotypic differences based on the tumor intensity, shape and texture, were extracted from the computed tomography images of twenty lung cancer patients. These Radiomics features were derived from the 3D-tumor volumes defined by three independent observers twice using 3D Slicer, and compared to manual slice-by-slice delineations of five independent physicians in terms of intra-class correlation coefficient (ICC) and feature range. Results: Radiomics features extracted from 3D Slicer segmentations had significantly higher reproducibility (ICC= 0.85 0.15, p=0.0009) compared to the features extracted from the manual segmentations (ICC= 0.77 0.17). Furthermore, the features extracted from 3D Slicer based segmentations, spread over significantly smaller range across observers as compared to those of the manual delineations (p= 3.819e-07). Moreover, the features derived from 3D Slicer segmentations overlapped in range with those of the manual delineations, as the lower(higher) limit(s) being significantly higher(lower) for the 3D Slicer features (p= 0.007, p= 5.863e-06). Conclusion: 3D Slicer based semiautomatic segmentation significantly improves the robustness of radiomics features and thus could serve as a potential alternative to the time consuming manual segmentation process. So 3D Slicer can have a large application in Radiomics, and be employed for high-throughput data mining research of medical imaging in clinical oncology. |
Sequencing Biological and Physical Events Affects Specific Frequency Bands within the Human Premotor Cortex: An Intracerebral EEG Study
|
Publication: PLoS One. 2014 Jan; 9(1): e86384. PMID: 24466067 | PDF Authors: Caruana F, Sartori I,Lo Russo G, Avanzini P. Institution: Brain Center for Social and Motor Cognition, Italian Institute of Technology, Parma, Italy. Background/Purpose: Evidence that the human premotor cortex (PMC) is activated by cognitive functions involving the motor domain is classically explained as the reactivation of a motor program decoupled from its executive functions, and exploited for different purposes by means of a motor simulation. In contrast, the evidence that PMC contributes to the sequencing of non-biological events cannot be explained by the simulationist theory. Here we investigated how motor simulation and event sequencing coexist within the PMC and how these mechanisms interact when both functions are executed. We asked patients with depth electrodes implanted in the PMC to passively observe a randomized arrangement of images depicting biological actions and physical events and, in a second block, to sequence them in the correct order. This task allowed us to disambiguate between the simple observation of actions, their sequencing (recruiting different motor simulation processes), as well as the sequencing of non-biological events (recruiting a sequencer mechanism non dependant on motor simulation). We analysed the response of the gamma, alpha and beta frequency bands to evaluate the contribution of each brain rhythm to the observation and sequencing of both biological and non-biological stimuli. We found that motor simulation (biological>physical) and event sequencing (sequencing>observation) differently affect the three investigated frequency bands: motor simulation was reflected on the gamma and, partially, in the beta, but not in the alpha band. In contrast, event sequencing was also reflected on the alpha band.
|
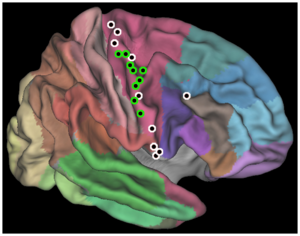 Illustration of the recording sites. Entrance point of the 19 electrodes implanted in the eight patients are plotted on an inflated PALS atlas surface according to their MNI coordinates. Brodmann areas are shown (Caret; see [36]). Green: electrodes with at least one contact showing a significant effect of condition (BIO>PHY) in the gamma band. White: electrodes with no contacts showing a significant effect of condition. Sites are illustrated in the right hemisphere. All entrance point are localized in the precentral gyrus, with the only exception of a rostral electrode, approaching the deep PMC from the BA44. The localization of each of the 107 recording contact was assessed by the coregistration of pre-implantation volumetric brain MRI with post-implantation volumetric brain CT (3D Slicer). |
Regional 3D Superimposition to assess Temporomandibular Joint Condylar Morphology
|
Publication: Dentomaxillofac Radiol. 2014;43(1):20130273. PMID: 24170802 | PDF Authors: Schilling J, Gomes LC, Benavides E, Nguyen T, Paniagua B, Styner M, Boen V, Gonçalves JR, Cevidanes LH. Institution: Department of Periodontics and Oral Medicine, School of Dentistry, University of Michigan, Ann Arbor, MI, USA. Background/Purpose: To investigate the reliability of regional three-dimensional registration and superimposition methods for assessment of temporomandibular joint condylar morphology across subjects and longitudinally. Methods: The sample consisted of cone beam CT scans of 36 patients. The across-subject comparisons included 12 controls, mean age 41.3 ± 12.0 years, and 12 patients with temporomandibular joint osteoarthritis, mean age 41.3 ± 14.7 years. The individual longitudinal assessments included 12 patients with temporomandibular joint osteoarthritis, mean age 37.8 ± 16.7 years, followed up at pre-operative jaw surgery, immediately after and one-year post-operative. Surface models of all condyles were constructed from the cone beam CT scans. Two previously calibrated observers independently performed all registration methods. A landmark-based approach was used for the registration of across-subject condylar models, and temporomandibular joint osteoarthritis vs control group differences were computed with shape analysis. A voxel-based approach was used for registration of longitudinal scans calculated x, y, z degrees of freedom for translation and rotation. Two-way random intraclass correlation coefficients tested the interobserver reliability. Results: Statistically significant differences between the control group and the osteoarthritis group were consistently located on the lateral and medial poles for both observers. The interobserver differences were ≤0.2 mm. For individual longitudinal comparisons, the mean interobserver differences were ≤0.6 mm in translation errors and 1.2° in rotation errors, with excellent reliability (intraclass correlation coefficient >0.75). Conclusion: Condylar registration for across-subjects and longitudinal assessments is reliable and can be used to quantify subtle bony differences in the three-dimensional condylar morphology. Funding:
|
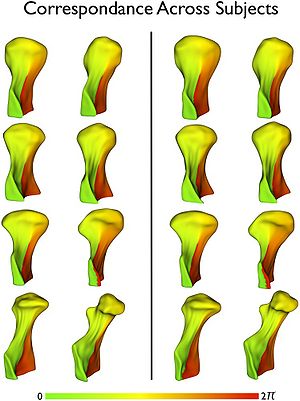 Quality control of the correspondence across 4002 points in the condylar surface models and between observers using parametric colour maps. These colour maps display one of the two spherical parameters, Phi, which is equivalent to geographical longitude. Eight condyles in the Observer 1 evaluation are shown in the left columns and the same condyles in Observer 2 evaluation are shown in the right columns. Note the consistency of the colour maps across all condyles and between observers. |
2013
|
Publication: Clin Orthop Relat Res. 2013 Dec;471(12):4047-55. PMID: 23955194 | PDF Authors: Ungi T, Moult E, Schwab JH, Fichtinger G. Institution: Laboratory for Percutaneous Surgery, School of Computing, Queen's University, Kingston, ON, Canada. Background/Purpose: Computerized navigation improves the accuracy of minimally invasive pedicle screw placement during spine surgery. Such navigation, however, exposes both the patient and the staff to radiation during surgery. To avoid intraoperative exposure to radiation, tracked ultrasound snapshots-ultrasound image frames coupled with corresponding spatial positions-could be used to map preoperatively defined screw plans into the intraoperative coordinate frame. The feasibility of such an approach, however, has not yet been investigated. Questions: Are there vertebral landmarks that can be identified using tracked ultrasound snapshots? Can tracked ultrasound snapshots allow preoperative pedicle screw plans to be accurately mapped-compared with CT-derived pedicle screw plans-into the intraoperative coordinate frame in a simulated setting? Methods: Ultrasound visibility of registration landmarks was checked on volunteers and phantoms. An ultrasound machine with integrated electromagnetic tracking was used for tracked ultrasound acquisition. Registration was performed using 3D Slicer open-source software. Two artificial lumbar spine phantoms were used to evaluate registration accuracy of pedicle screw plans using tracked ultrasound snapshots. Registration accuracy was determined by comparing the ultrasound-derived plans with the CT-derived plans. Results: The four articular processes proved to be identifiable using tracked ultrasound snapshots. Pedicle screw plans were registered to the intraoperative coordinate system using landmarks. The registrations were sufficiently accurate in that none of the registered screw plans intersected the pedicle walls. Registered screw plan positions had an error less than 1.28 ± 1.37 mm (average ± SD) in each direction and an angle difference less than 1.92° ± 1.95° around each axis relative to the CT-derived positions. Conclusion: Registration landmarks could be located using tracked ultrasound snapshots and permitted accurate mapping of pedicle screw plans to the intraoperative coordinate frame in a simulated setting. Clinical Relevance: Tracked ultrasound may allow accurate computer-navigated pedicle screw placement while avoiding ionizing radiation in the operating room; however, further studies that compare this approach with other navigation techniques are needed to confirm the practical use of this new approach.
|
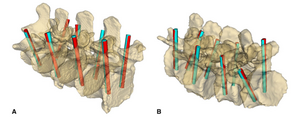 (A) Overview of pedicle screw plan positions as defined in the CT image (blue rods) and as registered using ultrasound snapshots (red rods) in the healthy spine model is shown. (B) Overview of pedicle screw plan positions as defined in the CT image (blue rods) and as registered using ultrasound snapshots (red rods) in the degenerative spine model is shown. Registration was performed using 3D Slicer open-source software. |
Dietary Cholesterol Increases Ventricular Volume and Narrows Cerebrovascular Diameter in a Rabbit Model of Alzheimer's Disease
|
Publication: Neuroscience. 2013 Dec 19;254:61-9. PMID: 24045100 | PDF Authors: Schreurs BG, Smith-Bell CA, Lemieux SK. Institution: Department of Physiology and Pharmacology, and the Blanchette Rockefeller Neurosciences Institute, West Virginia University, Morgantown, WV, USA. Background/Purpose: Using structural magnetic resonance imaging in a clinical scanner at 3.0T, we describe results showing that following 12weeks on a diet of 2% cholesterol, rabbits experience a significant increase in the volume of the third ventricle compared to rabbits on a diet of 0% cholesterol. Using time-of-flight magnetic resonance angiography, we find cholesterol-fed rabbits also experience a decrease in the diameter of a number of cerebral blood vessels including the basilar, posterior communicating, and internal carotid arteries. Taken together, these data confirm that, despite the inability of dietary cholesterol to cross the blood-brain barrier, it does significantly enlarge ventricular volume and decrease cerebrovascular diameter in the rabbit - effects that are also seen in patients with Alzheimer's disease. Using the editing function of 3D Slicer, the ventricles were manually selected using intensity-based threshold painting. The statistics module of 3D Slicer was used for quantification of ventricular volume. Funding:
|
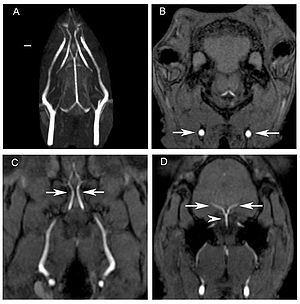 Blood vessels in the heads of rabbits fed different cholesterol or control diets. Sample time-of-flight magnetic resonance imaging images used to measure blood vessel diameters. Panel A shows the maximum intensity projection image of the blood vessels throughout the head of a rabbit. The scale bar is 2 mm. The remaining panels are different axial time-of-flight images showing the common carotid arteries (arrows, B), the internal carotid arteries (arrows, C), and the posterior communicating arteries (arrows, D) and basilar artery (arrow head, D). |
Rapid and Efficient Localization of Depth Electrodes and Cortical Labeling using Free and Open Source Medical Software in Epilepsy Surgery Candidates
|
Publication: Front Neurosci. 2013 Dec 31;7:260. PMID: 24427112 | PDF Authors: Princich JP, Wassermann D, Latini F, Oddo S, Blenkmann AO, Seifer G, Kochen S. Institution: Epilepsy Section, Neurosciences Clinic and Applicated Center, Hospital Ramos Mejia, Universidad de Buenos Aires Buenos Aires, Argentina. Background/Purpose: Depth intracranial electrodes (IEs) placement is one of the most used procedures to identify the epileptogenic zone (EZ) in surgical treatment of drug resistant epilepsy patients, about 20-30% of this population. IEs localization is therefore a critical issue defining the EZ and its relation with eloquent functional areas. That information is then used to target the resective surgery and has great potential to affect outcome. We designed a methodological procedure intended to avoid the need for highly specialized medical resources and reduce time to identify the anatomical location of IEs, during the first instances of intracranial EEG recordings. This workflow is based on established open source software; 3D Slicer and Freesurfer that uses MRI and Post-implant CT fusion for the localization of IEs and its relation with automatic labeled surrounding cortex. To test this hypothesis we assessed the time elapsed between the surgical implantation process and the final anatomical localization of IEs by means of our proposed method compared against traditional visual analysis of raw post-implant imaging in two groups of patients. All IEs were identified in the first 24 H (6-24 H) of implantation using our method in 4 patients of the first group. For the control group; all IEs were identified by experts with an overall time range of 36 h to 3 days using traditional visual analysis. It included (7 patients), 3 patients implanted with IEs and the same 4 patients from the first group. Time to localization was restrained in this group by the specialized personnel and the image quality available. To validate our method; we trained two inexperienced operators to assess the position of IEs contacts on four patients (5 IEs) using the proposed method. We quantified the discrepancies between operators and we also assessed the efficiency of our method to define the EZ comparing the findings against the results of traditional analysis.
|
Reduced Habituation in Patients with Schizophrenia
|
Publication: Schizophr Res. 2013 Dec;151(1-3):124-32 PMID: 24200419 | PDF Authors: Williams LE, Blackford JU, Luksik A, Gauthier I, Heckers S. Institution: Department of Psychiatry, Vanderbilt University, Nashville, TN, USA. Background/Purpose: Neural habituation, the decrease in brain response to repeated stimulation, is a basic form of learning. There is strong evidence for behavioral and physiological habituation deficits in schizophrenia, and one previous study found reduced neural habituation within the hippocampus. However, it is unknown whether neural habituation deficits are specific to faces and limited to the hippocampus. Here we studied habituation of several brain regions in schizophrenia, using both face and object stimuli. Post-scan memory measures were administered to test for a link between hippocampal habituation and memory performance. Mthods: During an fMRI scan, 23 patients with schizophrenia and 21 control subjects viewed blocks of a repeated neutral face or neutral object, and blocks of different neutral faces and neutral objects. Habituation in the hippocampus, primary visual cortex and fusiform face area (FFA) was compared between groups. Memory for faces, words, and word pairs was assessed after the scan. Results: Patients showed reduced habituation to faces in the hippocampus and primary visual cortex, but not the FFA. Healthy control subjects exhibited a pattern of hippocampal discrimination that distinguished between repeated and different images for both faces and objects, and schizophrenia patients did not. Hippocampal discrimination was positively correlated with memory for word pairs. Conclusion: Patients with schizophrenia showed reduced habituation of the hippocampus and visual cortex, and a lack of neural discrimination between old and new images in the hippocampus. Hippocampal discrimination correlated with memory performance, suggesting reduced habituation may contribute to the memory deficits commonly observed in schizophrenia. |
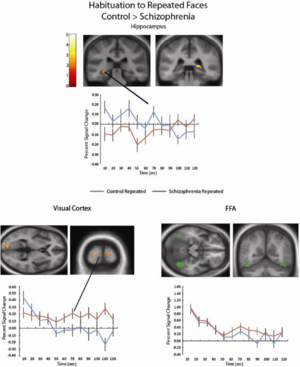 Patients with schizophrenia showed reduced habituation to Repeated faces in the left (k = 34; − 21, −22, −23) and right (k = 13; 18, −37, 4) hippocampus (cluster corrected p-value < .05). Extracting the percent signal change from these clusters shows that while control participants show decreasing hippocampal activity across the run, activity is more sustained for schizophrenia patients. A similar pattern was found in three clusters in the bilateral visual cortex (k = 111, −18, −79, 10; k = 22, 12, −76, 22; k = 19, 24, −97, 7, cluster-corrected p < .05). Percent signal change showed for a representative cluster. In contrast, both controls and schizophrenia patients show robust habituation to Repeated faces within the FFA (a representative single-subject FFA region of interest shown in green). Hippocampal segmentation used a previously established protocol in the 3D Slicer program (version 3.4) |
On the Prospect of Patient-specific Biomechanics without Patient-specific Properties of Tissues
|
Publication: J Mech Behav Biomed Mater. 2013 Nov;27:154-66. PMID: 23491073 | PDF Authors: Miller K, Lu J. Institution: Intelligent Systems for Medicine Laboratory, School of Mechanical and Chemical Engineering, University of Western Australia, Perth, WA, Australia. Background/Purpose: This paper presents main theses of two keynote lectures delivered at Euromech Colloquium "Advanced experimental approaches and inverse problems in tissue biomechanics" held in Saint Etienne in June 2012. We are witnessing an advent of patient-specific biomechanics that will bring in the future personalized treatments to sufferers all over the world. It is the current task of biomechanists to devise methods for clinically-relevant patient-specific modeling. One of the obstacles standing before the biomechanics community is the difficulty in obtaining patient-specific properties of tissues to be used in biomechanical models. We postulate that focusing on reformulating computational mechanics problems in such a way that the results are weakly sensitive to the variation in mechanical properties of simulated continua is more likely to bear fruit in near future. We consider two types of problems: (i) displacement-zero traction problems whose solutions in displacements are weakly sensitive to mechanical properties of the considered continuum; and (ii) problems that are approximately statically determinate and therefore their solutions in stresses are also weakly sensitive to mechanical properties of constituents. We demonstrate that the kinematically loaded biomechanical models of the first type are applicable in the field of image-guided surgery where the current, intraoperative configuration of a soft organ is of critical importance. We show that sac-like membranes, which are prototypes of many thin-walled biological organs, are approximately statically determinate and therefore useful solutions for wall stress can be obtained without the knowledge of the wall's properties. We demonstrate the clinical applicability and effectiveness of the proposed methods using examples from modeling neurosurgery and intracranial aneurysms. Funding:
|
Derivation of Neural Stem Cells from Human Adult Peripheral CD34+ Cells for an Autologous Model of Neuroinflammation
|
Publication: PLoS One. 2013 Nov 26;8(11):e81720 PMID: 24303066 | PDF Authors: Wang T, Choi E, Monaco MC, Campanac E, Medynets M, Do T, Rao P, Johnson KR, Elkahloun AG, Von Geldern G, Johnson T, Subramaniam S, Hoffman D, Major E, Nath A. Institution: Translational Neuroscience Center, National Institute of Neurological Disorders and Stroke, National Institutes of Health, Bethesda, MD, USA. Background/Purpose: Proinflammatory factors from activated T cells inhibit neurogenesis in adult animal brain and cultured human fetal neural stem cells (NSC). However, the role of inhibition of neurogenesis in human neuroinflammatory diseases is still uncertain because of the difficulty in obtaining adult NSC from patients. Recent developments in cell reprogramming suggest that NSC may be derived directly from adult fibroblasts. We generated NSC from adult human peripheral CD34+ cells by transfecting the cells with Sendai virus constructs containing Sox2, Oct3/4, c-Myc and Klf4. The derived NSC could be differentiated to glial cells and action potential firing neurons. Co-culturing NSC with activated autologous T cells or treatment with recombinant granzyme B caused inhibition of neurogenesis as indicated by decreased NSC proliferation and neuronal differentiation. Thus, we have established a unique autologous in vitro model to study the pathophysiology of neuroinflammatory diseases that has potential for usage in personalized medicine. Features of interest were automatically selected with 3D Slicer using a threshold tool that highlighted features within a specified range of pixel intensity. |
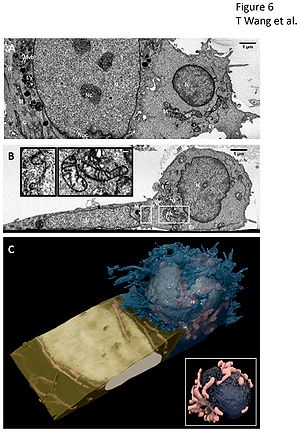 3D imaging of contact between neural stem cell (left) and activated T cell (right) by ion abrasion scanning electron microscopy (IA-SEM). (A, B) Representative, orthogonal 2D images from a 17.57 um x 6.30 um x 8.72 um stack volume show the two cells in direct contact with interlocking cellular membranes in the XZ plane (A) and XY plane (B). The XY plane reveals a localization of Golgi apparatus, vesicles, and mitochondria in the activated T cell near the site of contact. Subcellular organelles are well preserved including nucleus (N), nucleolus (Nc), nuclear pore complexes (Npc), multivesicular bodies (Mvb), lysosome (Ly), mitochondria (M), cytoskeleton (C), intermediate filament (IF), Golgi apparatus (G), vesicles (V), and endoplasmic recticulum (ER). (B, Inset) Expanded view of boxed regions in panel (B) of the interlocking membranes at the cell-cell junction (left) and the T cell mitochondria (right) to illustrate level of detail in images. Scale bars are 100 nm. (C) 3D visualization of the SEM image stack show the activated T cell membrane (blue) engulfing an edge of the neural stem cell membrane (gold). The activated T cell spherical shaped nucleus (ivory), compact mitochondria clusters (pink), and complex membrane protrusions are seen in stark contrast with the neural stem cell flat nucleus (ivory), elongated mitochondria (pink), and smooth cell membrane. (C, Inset) Expanded view of the interior of the T-cell showing the T cell nucleus (navy) is pinched in the center, with the cleft line oriented directly toward the site of contact. Mitochondria (pink) are found clustered along the cleft line. |
Can Transrectal Needle Biopsy be Optimised to Detect Nearly All Prostate Cancer with a Volume of ≥0.5 mL? A Three-dimensional Analysis
|
Publication: BJU Int. 2013 Nov;112(7):898-904. PMID: 23490279| PDF Authors: Kanao K, Eastham JA, Scardino PT, Reuter VE, Fine SW. Institution: Department of Pathology, Urology Service, Memorial Sloan-Kettering Cancer Center, New York, NY, USA. Background/Purpose: Retrospectively analysed 109 whole-mounted and entirely submitted radical prostatectomy specimens with prostate cancer. All tumours in each prostate were outlined on whole-mount slides and digitally scanned to produce tumour maps. Tumour map images were exported to three-dimensional 3D Slicer software to develop a 3D-prostate cancer model. In all, 20 transrectal biopsy schemes involving two to 40 cores and two to six anteriorly directed biopsy (ADBx) cores (including transition zone, TZ) were simulated, as well as models with various biopsy cutting lengths. Detection rates for tumours of different volumes were determined for the various biopsy simulation schemes. |
Analysis of Morphological Parameters to Differentiate Rupture Status in Anterior Communicating Artery Aneurysms
|
Publication: PLoS One. 2013 Nov 13;8(11):e79635. PMID: 24236149 | PDF Authors: Lin N, Ho A, Charoenvimolphan N, Frerichs KU, Day AL, Du R. Institution: Department of Neurosurgery, Brigham and Women’s Hospital, Harvard Medical School, Boston, MA, USA. Background/Purpose: In contrast to size, the association of morphological characteristics of intracranial aneurysms with rupture has not been established in a systematic manner. We present an analysis of the morphological variables that are associated with rupture in anterior communicating artery aneurysms to determine site-specific risk variables. One hundred and twenty-four anterior communicating artery aneurysms were treated in a single institution from 2005 to 2010, and CT angiograms (CTAs) or rotational angiography from 79 patients (42 ruptured, 37 unruptured) were analyzed. Vascular imaging was evaluated with 3D Slicer to generate models of the aneurysms and surrounding vasculature. Morphological parameters were examined using univariate and multivariate analysis and included aneurysm volume, aspect ratio, size ratio, distance to bifurcation, aneurysm angle, vessel angle, flow angle, and parent-daughter angle. Multivariate logistic regression revealed that size ratio, flow angle, and parent-daughter angle were associated with aneurysm rupture after adjustment for age, sex, smoking history, and other clinical risk factors. Simple morphological parameters such as size ratio, flow angle, and parent-daughter angle may thus aid in the evaluation of rupture risk of anterior communicating artery aneurysms. Funding:
|
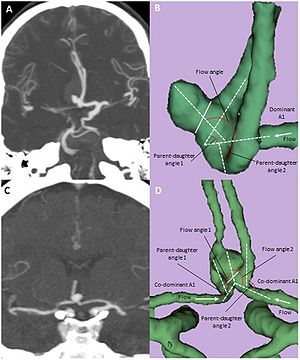 Computed Tomography Angiogram (CTA) and three-dimensional models of anterior communicating aneurysms with a dominant A1 or with co-dominant A1’s.Coronal MIP images are shown for an ruptured AcoA aneurysm with a dominant left A1 (A) and an unruptured AcoA aneurysm with co-dominant A1’s (C). The corresponding 3D reconstructed images from 3D Slicer are shown in B and D with definitions of morphological parameters. Solid line (B and D) indicates aneurysm neck. |
Anatomic and Morphological Evaluation of the Quadriceps Tendon using 3-Dimensional Magnetic Resonance Imaging Reconstruction
|
Publication: Am J Sports Med. 2013 Oct;41(10):2392-9. PMID: 23893419 | PDF Authors: Xerogeanes JW, Mitchell PM, Karasev PA, Kolesov IA, Romine SE. Institution: Department of Orthopaedic Surgery, Emory University School of Medicine, Atlanta, GA, USA. Background/Purpose: The autograft of choice for anterior cruciate ligament (ACL) reconstruction remains controversial. The quadriceps tendon is the least utilized and least studied of the potential autograft options. Purpose: To determine if the quadriceps tendon has the anatomic characteristics to produce a graft whose length and volume are adequate, reproducible, and predictable when compared with the other commonly used autografts. Study Design: Cross-sectional study; Level of evidence, 3.Methods: Axial proton density magnetic resonance imaging (MRI) scans of 60 skeletally mature patients (30 male and 30 female) were evaluated. Volumetric analysis of 3-dimensional models of the patellar and quadriceps tendons was performed before and after the removal of a 10 mm-wide graft from both tendons. Length, thickness, and width measurements of the quadriceps tendon were made at predetermined locations. Anthropometric data were collected, and subgroup analysis, sex analysis, and linear regression were performed. Results: The mean percentage of volume remaining after removal of a 10 mm-wide graft from the patellar tendon was 56.6%, compared with 61.3% when harvesting an 80 mm-long graft of the same width from the quadriceps tendon. The intra-articular volume of the proposed quadriceps tendon graft was 87.5% greater than that of the patellar tendon graft. The mean length of the quadriceps tendon was 73.5 ± 12.3 mm in female patients and 81.1 ± 10.6 mm in male patients. These measurements were most highly correlated with patient height. The width of the quadriceps tendon decreased as one proceeded proximally from its insertion, and the thickness of the quadriceps tendon remained relatively constant. Conclusion: The quadriceps tendon has the anatomic characteristics to produce a graft whose length and volume are both reproducible and predictable, while yielding a graft with a significantly greater intra-articular volume than a patellar tendon graft with a similar width. |
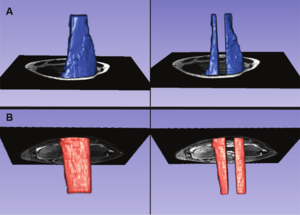 (A) A 3-dimensional model of the distal 8 cm of the quadriceps tendon, with and without the 10 mm–wide graft removed. Using the measurement tool on 3D Slicer, we measured the width of the quadriceps tendon from its insertion to 80 mm above its insertion. (B) A 3-dimensional model of the patellar tendon, with and without the 10 mm–wide graft removed. |
Optical Tractography of the Mouse Heart using Polarization-sensitive Optical Coherence Tomography
|
Publication: Biomed Opt Express. 2013 Oct 21;4(11):2540-5. PMID: 24298414 | PDF Authors: Wang Y, Yao G. Institution: Department of Bioengineering, University of Missouri, Columbia, MO, USA. Background/Purpose: We developed a method to image myocardial fiber architecture in the mouse heart using a Jones matrix-based polarization-sensitive optical coherence tomography (PSOCT) system. The “cross-helical” laminar structure of myocardial fibers can be clearly visualized using this technology. The obtained myocardial fiber organization agrees well with existing knowledge acquired using conventional histology and diffusion tensor magnetic resonance imaging. The open source 3D Slicer was used for 3D data visualization. |
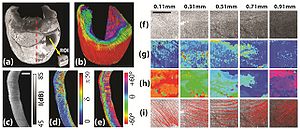 (a) The 3D structure image of the mouse heart; (b) the corresponding 3D tractographic visualization. The B-scan images of structure, local retardance and optical axis acquired along the dashed line in (a) are shown in (c)-(e). Also shown are the en face images of the (f) structure, (g) local retardance, (h) local optical axis, and (i) cardiac fiber tract of a small region of interest (ROI) extracted at transmural depths from 0.11 mm to 0.91 mm. As shown in (a), the ROI was extracted from the lateral side of the left ventricle wall and had a size of 1.57 mm × 20° rotation (B × C-scan). The size bars in (c) and (f) are 1 mm. |
Individual subject classification of mixed dementia from pure subcortical vascular dementia based on subcortical shape analysis
|
Publication: PLoS One. 2013 Oct 10;8(10):e75602. PMID: 24130724| PDF Authors: Kim HJ, Kim J, Cho H, Ye BS, Yoon CW, Noh Y, Kim GH, Lee JH, Kim JS, Choe YS, Lee KH, Kim CH, Seo SW, Weiner MW, Na DL, Seong JK. Institution: Department of Neurology, Samsung Medical Center, Sungkyunkwan University School of Medicine, Seoul, Korea. Background/Purpose: Subcortical vascular dementia (SVaD), one of common causes of dementia, has concomitant Alzheimer's disease (AD) pathology in over 30%, termed "mixed dementia". Identifying mixed dementia from SVaD is important because potential amyloid-targeted therapies may be effective for treatment in mixed dementia. The purpose of this study was to discriminate mixed dementia from pure SVaD using magnetic resonance imaging (MRI). We measured brain amyloid deposition using the 11C-Pittsburgh compound B positron emission tomography (PiB-PET) in 68 patients with SVaD. A PiB retention ratio greater than 1.5 was considered PiB(+). Hippocampal and amygdalar shape were used in the incremental learning method to discriminate mixed dementia from pure SVaD because these structures are known to be prominently involved by AD pathologies. Among 68 patients, 23 (33.8%) patients were positive for PiB binding. With use of hippocampal shape analysis alone, PiB(+) SVaD could be discriminated from PiB(-) SVaD with 77.9% accuracy (95.7% sensitivity and 68.9% specificity). With use of amygdalar shape, the discrimination accuracy was 75.0% (87.0% sensitivity and 68.9% specificity). When hippocampal and amygdalar shape were analyzed together, accuracy increased to 82.4% (95.7% sensitivity and 75.6% specificity). An incremental learning method using hippocampal and amygdalar shape distinguishes mixed dementia from pure SVaD. Furthermore, our results suggest that amyloid pathology and vascular pathology have different effects on the shape of the hippocampus and amygdala. |
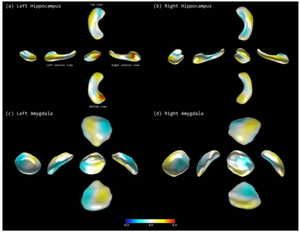 Discriminative regions in classification: (a) left hippocampus, (b) right hippocampus, (c) left amygdala, and (d) right amygdala. Each figure visualizes the LDA axes on the atlas meshes. An expert neuroanatomist manually delineated hippocampal volumes of 20 healthy subjects from the T1 images slice-by-slice using version 4.2.2 of 3D Slicer. |
3D Prostate Histology Image Reconstruction: Quantifying the Impact of Tissue Deformation and Histology Section Location
|
Publication: J Pathol Inform. 2013 Oct 31;4:31. PMID: 24392245 | PDF Authors: Gibson E, Gaed M, Gómez JA, Moussa M, Pautler S, Chin JL, Crukley C, Bauman GS, Fenster A, Ward AD. Institution: Robarts Research Institute, London, Canada. Background/Purpose: Guidelines for localizing prostate cancer on imaging are ideally informed by registered post-prostatectomy histology. 3D histology reconstruction methods can support this by reintroducing 3D spatial information lost during histology processing. The need to register small, high-grade foci drives a need for high accuracy. Accurate 3D reconstruction method design is impacted by the answers to the following central questions of this work. (1) How does prostate tissue deform during histology processing? (2) What spatial misalignment of the tissue sections is induced by microtome cutting? (3) How does the choice of reconstruction model affect histology reconstruction accuracy? Histology, paraffin block face and magnetic resonance images were acquired for 18 whole mid-gland tissue slices from six prostates. 7-15 homologous landmarks were identified on each image. Tissue deformation due to histology processing was characterized using the target registration error (TRE) after landmark-based registration under four deformation models (rigid, similarity, affine and thin-plate-spline [TPS]). The misalignment of histology sections from the front faces of tissue slices was quantified using manually identified landmarks. The impact of reconstruction models on the TRE after landmark-based reconstruction was measured under eight reconstruction models comprising one of four deformation models with and without constraining histology images to the tissue slice front faces. Isotropic scaling improved the mean TRE by 0.8-1.0 mm (all results reported as 95% confidence intervals), while skew or TPS deformation improved the mean TRE by <0.1 mm. The mean misalignment was 1.1-1.9(°) (angle) and 0.9-1.3 mm (depth). Using isotropic scaling, the front face constraint raised the mean TRE by 0.6-0.8 mm. For sub-millimeter accuracy, 3D reconstruction models should not constrain histology images to the tissue slice front faces and should be flexible enough to model isotropic scaling. |
Heat-induced Shrinkage and Shape Preservation of Teeth: A Radiologic Evaluation
|
Publication: J Forensic Odontostomatol. 2013 Oct 1;31 Suppl 1:40-1. Authors: Sandholzer MA, Walmsley DA, Lumley P, Landini G. Institution: School of Dentistry, University of Birmingham, UK. Background/Purpose: Teeth subjected to high temperatures following natural disasters, airplane crashes or house fires can sometimes be the only remains available for forensic identification. The information on macro- and microscopic heat-induced changes of teeth can therefore provide relevant information that can facilitate the identification process. An important macroscopic feature of burned dental remains is the gradual change in colour due to compositional changes (i.e. loss of organic content), which generally allows to deduce a temperature range and can indicate the possible preservation of DNA. In practice, the most reliable and frequently applied method for identification of fire victims is comparative dental radiography, based on the comparison of dentition features. Although forensic odontologists are often confronted with fragmented and isolated dental remains, there is still a lack of precise data for the heat-induced dimensional and morphological changes of human teeth that might influence the identification process. This study therefore investigated the volumetric shrinkage, shape preservation, weight loss and colour alterations of human teeth and looked at the effects of previously reported heating protocols to enable testing the reliability and inter-comparability of results published in literature. Materials and Methods: A total of 104 freshly extracted sound molars and premolars were included in this study. Micro-CT scans (SkyScan 1172; voxel-size 13.5 µm) were performed before and after exposure to three different previously reported heating regimes in a range of 400 - 1000°C. Volumetric shrinkage was analysed using Fiji and 3D Slicer software. The weight loss was documented with an high-precision analytical scale. Photographic colour measurements and image analysis were performed on calibrated digital photographs and representative colour palettes were computed for every experimental group using the Fiji software package. Results: A progressive, temperature-dependent shift of colours was observed, with apparent differences depending on the chosen heating regime. Although fragmentation and cracks at elevated temperatures often affected the pulp chamber and root canals, overall tooth morphology was well preserved. The temperature and the chosen heating regime had a statistically significant influence on the dentinal volumetric shrinkage, which ranged from 4.8% (at 400°C) to 32.5% (at 1000°C). A major increase in shrinkage occurred between 700°C and 800°C, whilst no significant statistical difference was found between lower temperature groups. The weight loss measurements overall correlated significantly with the shrinkage, with a mean weight loss between 7.8% (at 400°C) and 32.8% (at 1000°C), again significantly differing between the heating regimes. Conclusion: In conclusion, the findings of this study showed definite differences of the macro- and microscopic changes related to the experimental heating regime, adding information on the dentinal shrinkage and shape preservation over a large range of temperatures found in possible forensic scenarios. The colour changes are summarised in the newly developed colour palettes and can be used to deduce a temperature range. By vigilantly implementing the knowledge on the specific colour changes, dentinal shrinkage and shape preservation the odontological identification process of fire victims can eventually be facilitated in cases where only fragmented or isolated dental remains are present. |
Clinical Correlates of Nucleus Accumbens Volume in Drug-naive, Adult Patients with Obsessive-compulsive Disorder
|
Publication: Aust N Z J Psychiatry. 2013 Oct;47(10):930-7. PMID: 23737599 Authors: Narayanaswamy JC, Jose D, Kalmady S, Venkatasubramanian G, Reddy YJ. Institution: Obsessive Compulsive Disorder Clinic & Translational Psychiatry Lab, Neurobiology Research Center at National Institute of Mental Health and Neurosciences (NIMHANS), Bangalore, India. Background/Purpose: Background:Reward-processing deficits have been demonstrated in obsessive-compulsive disorder (OCD) and this has been linked to ventral striatal abnormalities. However, volumetric abnormalities of the nucleus accumbens (NAcc), a key structure in the reward pathway, have not been examined in OCD. We report on the volumetric abnormalities of NAcc and its correlation with illness severity in drug-naïve, adult patients with OCD. Method: In this cross-sectional study of case-control design, the magnetic resonance imaging (MRI) 1.5-T (1-mm) volume of NAcc was measured using 3D Slicer software in drug-naïve OCD patients (n = 44) and age, sex and handedness-matched healthy controls (HCs) (n = 36) using a valid and reliable method. OCD symptoms were assessed using the Yale-Brown Obsessive Compulsive Scale (Y-BOCS) Symptom checklist and severity and the Clinical Global Impression-Severity (CGI-S) scale. Results: There was no significant difference in NAcc volumes on either side between OCD patients and HCs (F = 3.45, p = 0.07). However, there was significant negative correlation between the right NAcc volume and Y-BOCS compulsion score (r = -0.48, p = 0.001). Conclusion:Study observations suggest involvement of the NAcc in the pathogenesis of OCD, indicating potential reward-processing deficits. Correlation between the right NAcc volume deficit and severity of compulsions offers further support for this region as a candidate for deep brain stimulation treatment in OCD. |
Probing the Regional Distribution of Pulmonary Gas Exchange through Single-breath gas- and Dissolved-phase 129Xe MR Imaging
|
Publication: J Appl Physiol. 2013 Sep;115(6):850-60. PMID: 23845983 | PDF Authors: Kaushik SS, Freeman MS, Cleveland ZI, Davies J, Stiles J, Virgincar RS, Robertson SH, He M, Kelly KT, Foster WM, McAdams HP, Driehuys BP. Institution: Department of Biomedical Engineering, Duke University, Durham, NC, USA. Background/Purpose: Although some central aspects of pulmonary function (ventilation and perfusion) are known to be heterogeneous, the distribution of diffusive gas exchange remains poorly characterized. A solution is offered by hyperpolarized 129Xe magnetic resonance (MR) imaging, because this gas can be separately detected in the lung's air spaces and dissolved in its tissues. Early dissolved-phase 129Xe images exhibited intensity gradients that favored the dependent lung. To quantitatively corroborate this finding, we developed an interleaved, three-dimensional radial sequence to image the gaseous and dissolved 129Xe distributions in the same breath. These images were normalized and divided to calculate "129Xe gas-transfer" maps. We hypothesized that, for healthy volunteers, 129Xe gas-transfer maps would retain the previously observed posture-dependent gradients. This was tested in nine subjects: when the subjects were supine, 129Xe gas transfer exhibited a posterior-anterior gradient of -2.00 ± 0.74%/cm; when the subjects were prone, the gradient reversed to 1.94 ± 1.14%/cm (P < 0.001). The 129Xe gas-transfer maps also exhibited significant heterogeneity, as measured by the coefficient of variation, that correlated with subject total lung capacity (r = 0.77, P = 0.015). Gas-transfer intensity varied nonmonotonically with slice position and increased in slices proximal to the main pulmonary arteries. Despite substantial heterogeneity, the mean gas transfer for all subjects was 1.00 ± 0.01 while supine and 1.01 ± 0.01 while prone (P = 0.25), indicating good "matching" between gas- and dissolved-phase distributions. This study demonstrates that single-breath gas- and dissolved-phase 129Xe MR imaging yields 129Xe gas-transfer maps that are sensitive to altered gas exchange caused by differences in lung inflation and posture. Funding:
|
 Image processing used to limit the analysis to the thoracic cavity. A: gas-phase image (green) overlaid on the corresponding thoracic cavity image (grayscale) prior to registration. Postregistration thoracic cavity image (B) was used to create a thoracic cavity mask that defines the data analysis region (C). Airways in the mask were manually segmented, and the mask was then subjected to morphological closing with a spherical structuring element (7-pixel diameter) and a filling operation to yield the final mask (D). E: outline of the processed thoracic cavity mask on the gas-phase image. The thoracic cavity image was then segmented using the region-growing algorithm in 3D Slicer to create a binary thoracic cavity “mask” |
Resection Probability Maps for Quality Assessment of Glioma Surgery without Brain Location Bias
|
Publication: PLoS One. 2013 Sep 6;8(9):e73353. PMID: 24039922| PDF Authors: De Witt Hamer PC, Hendriks EJ, Mandonnet E, Barkhof F, Zwinderman AH, Duffau H. Institution: Neurosurgical Center Amsterdam, VU University Medical Center, Amsterdam, The Netherlands. Background/Purpose: Intraoperative brain stimulation mapping reduces permanent postoperative deficits and extends tumor removal in resective surgery for glioma patients. Successful functional mapping is assumed to depend on the surgical team's expertise. In this study, glioma resection results are quantified and compared using a novel approach, so-called resection probability maps (RPM), exemplified by a surgical team comparison, here with long and short experience in mapping. Methods: Adult patients with glioma were included by two centers with two and fifteen years of mapping experience. Resective surgery was targeted at non-enhanced MRI extension and was limited by functional boundaries. Neurological outcome was compared. To compare resection results, we applied RPMs to quantify and compare the resection probability throughout the brain at 1 mm resolution. Considerations for spatial dependence and multiple comparisons were taken into account. Results: The senior surgical team contributed 56, and the junior team 52 patients. The patient cohorts were comparable in age, preoperative tumor volume, lateralization, and lobe localization. Neurological outcome was similar between teams. The resection probability on the RPMs was very similar, with none (0%) of 703,967 voxels in left-sided tumors being differentially resected, and 124 (0.02%) of 644,153 voxels in right-sided tumors. Conclusion: RPMs provide a quantitative volumetric method to compare resection results, which we present as standard for quality assessment of resective glioma surgery because brain location bias is avoided. Stimulation mapping is a robust surgical technique, because the neurological outcome and functional-based resection results using stimulation mapping are independent of surgical experience, supporting wider implementation. |
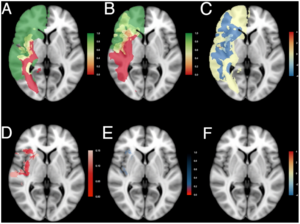 Resection probability maps for right-sided gliomas. Results comparing (A) the junior surgical team, n = 29, and (B) the senior surgical team, n = 29, are shown superimposed on standard brain space (MNI152). A probability of 0 (red) represents locations where tumor was never resected, and a probability of 1 (green) represents locations where tumor was resected in all patients. An intermediate probability (yellow) represents locations where glioma was removed in a subset of patients. (C) Relative differences in probability of resection as log odds ratio. (D) The adjusted p-value map adjusted by the empirical null-distribution to address spatial dependency of voxels. Values less than 0.15 are plotted in shades of red. (E) The q-value map to address multiple testing. Values below 0.2 are plotted in shades of red, values between 0.2 and 0.8 in shades of blue. (F) Differences in probability of resection as log odds ratio for voxels with a q-value less than 0.2 demonstrate similar resection results between the two patient cohorts. Results are superimposed on a transversal section at z = 0 of MNI152. See Movie S2 for all transversal sections. |
Consistent Surgeon Evaluations of Three-Dimensional Rendering of PET/CT Scans of the Abdomen of a Patient with a Ductal Pancreatic Mass
|
Publication: PLoS One. 2013 Sep 24;8(9):e75237. PMID: 24086475| PDF Authors: Wampole ME, Kairys JC, Mitchell EP, Ankeny ML, Thakur ML, Wickstrom E. Institution: Department of Biochemistry and Molecular Biology, Thomas Jefferson University, Philadelphia, PA, USA. Background/Purpose: Two-dimensional (2D) positron emission tomography (PET) and computed tomography (CT) are used for diagnosis and evaluation of cancer patients, requiring surgeons to look through multiple planar images to comprehend the tumor and surrounding tissues. We hypothesized that experienced surgeons would consistently evaluate three-dimensional (3D) presentation of CT images overlaid with PET images when preparing for a procedure. We recruited six Jefferson surgeons to evaluate the accuracy, usefulness, and applicability of 3D renderings of the organs surrounding a malignant pancreas prior to surgery. PET/CT and contrast-enhanced CT abdominal scans of a patient with a ductal pancreatic mass were segmented into 3D surface renderings, followed by co-registration. Version A used only the PET/CT image, while version B used the contrast-enhanced CT scans co-registered with the PET images. The six surgeons answered 15 questions covering a) the ease of use and accuracy of models, b) how these models, with/without PET, changed their understanding of the tumor, and c) what are the best applications of the 3D visualization, on a scale of 1 to 5. The six evaluations revealed a statistically significant improvement from version A (score 3.6±0.5) to version B (score 4.4±0.4). A paired-samples t-test yielded t(14) = -8.964, p<0.001. Across the surgeon cohort, contrast-enhanced CT fused with PET provided a more lifelike presentation than standard CT, increasing the usefulness of the presentation. The experienced surgeons consistently reported positive reactions to 3D surface renderings of fused PET and contrast-enhanced CT scans of a pancreatic cancer and surrounding organs. Thus, the 3D presentation could be a useful preparative tool for surgeons prior to making the first incision. This result supports proceeding to a larger surgeon cohort, viewing prospective 3D images from multiple types of cancer. Funding:
|
Fiber Tract-Driven Topographical Mapping (FTTM) Reveals Microstructural Relevance for Interhemispheric Visuomotor Function in the Aging Brain
|
Publication: Neuroimage. 2013 Aug 15;77:195-206. PMID: 23567886 | PDF Authors: Schulte T, Maddah M, Müller-Oehring EM, Rohlfing T, Pfefferbaum A, Sullivan EV. Institution: SRI International, Neuroscience Program, Menlo Park, CA, USA. Background/Purpose: We present a novel approach - DTI-based fiber tract-driven topographical mapping (FTTM) - to map and measure the influence of age on the integrity of interhemispheric fibers and challenge their selective functions with measures of interhemispheric integration of lateralized information. This approach enabled identification of spatially specific topographical maps of scalar diffusion measures and their relation to measures of visuomotor performance. Relative to younger adults, older adults showed lower fiber integrity indices in anterior than posterior callosal fibers. FTTM analysis identified a dissociation in the microstructural-function associates between age groups: in younger adults, genu fiber integrity correlated with interhemispheric transfer time, whereas in older adults, body fiber integrity was correlated with interhemispheric transfer time with topographical specificity along left-lateralized callosal fiber trajectories. Neural co-activation from redundant targets was evidenced by fMRI-derived bilateral extrastriate cortex activation in both groups, and a group difference emerged for a pontine activation cluster that was differently modulated by response hand in older than younger adults. Bilateral processing advantages in older but not younger adults further correlated with fiber integrity in transverse pontine fibers that branch into the right cerebellar cortex, thereby supporting a role for the pons in interhemispheric facilitation. In conclusion, in the face of compromised anterior callosal fibers, older adults appear to use alternative pathways to accomplish visuomotor interhemispheric information transfer and integration for lateralized processing. This shift from youthful associations may indicate recruitment of compensatory mechanisms involving medial corpus callosum fibers and subcortical pathways. Funding:
|
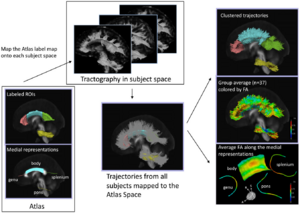 Pipeline for DTI-based fiber tract-driven topographic mapping (FTTM) analysis. Left panel: (Bottom) Labeled ROIs in the ICBM-DTI-81 atlas and the derived initial medial representation of each bundle. Middle panel: (Top) The ROIs are mapped to each subject space by applying the affine transformation obtained by registering the FA volume of the atlas to the FA volume of each subject. Seeded from the registered ROIs, streamline tractography is performed in each subject's native image space using 3D Slicer3). (Bottom) Trajectories from all 37 subjects are mapped back to the atlas space and are clustered into bundles based on their spatial proximity and shape similarity to the medial representation of fiber tracts in the atlas. Right panel: (Top) Trajectories are colored with the most probable label assigned in the clustering process. (Middle) Trajectories are colored with the FA values. (Bottom) The medial representation of each bundle is colored by the average FA of trajectories in each bundle summarizing the local variation of the diffusion parameter along that fiber bundle, thereby providing topographic parameter maps. |
Prostate Volumetric Assessment by Magnetic Resonance Imaging and Transrectal Ultrasound: Impact of Variation in Calculated Prostate-Specific Antigen Density on Patient Eligibility for Active Surveillance Program
|
Publication: Journal of Computer Assisted Tomography. 2013 Jul/Aug;37(4):589-95. PMID: 23863537 Authors: Dianat SS, Rancier Ruiz RM, Bonekamp D, Carter HB, Macura KJ. Institution: Department of Radiology, Johns Hopkins University, Baltimore, MD. Background/Purpose: The objective of this study was to investigate impact of prostate volume variations on prostate-specific antigen density (PSAD) and patient eligibility for active surveillance (AS). Methods: Prostate volume and PSAD were calculated for 46 patients with prostate cancer in AS who underwent prostate magnetic resonance imaging and transrectal ultrasound (TRUS). Manual method and 2 semiautomated methods for prostate segmentation (3D Slicer and OsiriX) were used for MR volumetry. Results: Magnetic resonance volumetric methods showed very good agreement (intraclass correlation coefficient, 0.98). The concordance correlation coefficient was higher among MR volumetry methods (0.971-0.998) than between TRUS and MR volumetry (0.849-0.863). The variation in PSAD estimated by TRUS versus magnetic resonance imaging was higher in large prostates (r = 0.327, P = 0.027). Transrectal ultrasonography volumetry may improperly classify 20% of patients as eligible for AS with PSAD greater than 0.15 threshold. Conclusion: Although clinically used TRUS reliably estimates PSAD, it may misclassify some patients who are not eligible for AS based on PSAD criteria. Magnetic resonance-based volumetry should be considered for a more reliable PSAD calculation. |
Quantification and Analysis of 3D Magnetic Resonance Image Brain Tumor
|
Publication: International Journal of Tomography & Simulation. 2013 Jul; 24(3):17-26. Authors: Aju D, Ray, BK. Institution: Department of Neurosurgery, Brigham and Women’s Hospital, Harvard Medical School, Boston, MA. Background/Purpose: An analysis and detection of brain tumor is performed using MRI scanned images. Also a 3D visualization of the detected tumor part and its quantification is achieved through the proposed methodology. Initially, the noise is reduced by applying high pass filter and image enhancement is performed as a preprocessing step to enhance the input image quality. Morphological operations are applied to the enhanced image to detect the shape of the tumor in the enhanced image. The tumor part is mapped onto the original gray scale image with 255 intensity values to make the tumor visible more in the image. 3D Slicer is utilized to extract and visualize the 3D tumor data. The volume of the extracted 3D tumor portion is also calculated using 3D Slicer. The methodology has been tried out on a number of different input data sets and it is observed that it always gave the precise and desired result. |
Optic Radiation Fiber Tractography in Glioma Patients Based on High Angular Resolution Diffusion Imaging with Compressed Sensing Compared with Diffusion Tensor Imaging - Initial Experience
|
Publication: PLoS One. 2013 Jul;8(7):e70973. PMID: 23923036 | PDF Authors: Kuhnt D, Bauer M, Sommer J, Merhof D, Nimsky C. Institution: Department of Neurosurgery, University of Marburg, Marburg, Germany. Background/Purpose: Up to now, fiber tractography in the clinical routine is mostly based on diffusion tensor imaging (DTI). However, there are known drawbacks in the resolution of crossing or kissing fibers and in the vicinity of a tumor or edema. These restrictions can be overcome by tractography based on High Angular Resolution Diffusion Imaging (HARDI) which in turn requires larger numbers of gradients resulting in longer acquisition times. Using compressed sensing (CS) techniques, HARDI signals can be obtained by using less non-collinear diffusion gradients, thus enabling the use of HARDI-based fiber tractography in the clinical routine. Eight patients with gliomas in the temporal lobe, in proximity to the optic radiation (OR), underwent 3T MRI including a diffusion-weighted dataset with 30 gradient directions. Fiber tractography of the OR using a deterministic streamline algorithm based on DTI was compared to tractography based on reconstructed diffusion signals using HARDI+CS. HARDI+CS based tractography displayed the OR more conclusively compared to the DTI-based results in all eight cases. In particular, the potential of HARDI+CS-based tractography was observed for cases of high grade gliomas with significant peritumoral edema, larger tumor size or closer proximity of tumor and reconstructed fiber tract. Overcoming the problem of long acquisition times, HARDI+CS seems to be a promising basis for fiber tractography of the OR in regions of disturbed diffusion, areas of high interest in glioma surgery. Funding:
|
 Fiber tractography results presented for each patient (patients 1–8 according rows 1–8) based on DTI (column 1), 3D Slicer (column 2), and based on HARDI+CS (column 4) within MedAlyVis. Overlay of DTI-based (red) and HARDI+CS-based tractography (green) (r = right; l = left; a = anterior; p = posterior). |
Endodontic Access Cavity Simulation in Ceramic Dental Crowns
|
Publication: Dent Mater. 2013 Jun;29(6):626-34. PMID: 23587359 Authors: Cuddihy M, Gorman CM, Burke FM, Ray NJ, Kelliher D. Institution: Department of Materials, Royal School of Mines, Imperial College London, London, UK. Background/Purpose: It is proposed that a non-uniform rational B-spline (NURBS) based solid geometric model of a ceramic crown would be a flexible and quick approach to virtually simulate root canal access cavities. The computation of strain components orthogonal to surface flaws generated during the drilling would be an appropriate way of comparing different access cavity configurations. Methods: A μCT scan is used to develop a full 3D NURBS geometric solid model of a ceramic crown. Three different access cavity configurations are created virtually in the geometric model and there are then imported into proprietary finite element software. A linear analysis of the each crown is carried out under appropriate in vivo loading and the results are post-processed to carry out a quantitative comparison of the three configurations. Results: The geometric model is shown to be a flexible and quick way of simulation access cavities. Preliminary indications are that post processed strain results from the finite element analysis are good comparators of competing access cavity configurations. SIGNIFICANCE: The generation of geometric solid models of dental crowns from μCT scans is a flexible and efficient methodology to simulate a number of access cavity configurations. Furthermore, advanced post-processing of the primary finite element analysis results is worthwhile as preliminary results indicate that improved quantitative comparisons between different access cavity configurations are possible. In this work, all image processing and reconstruction work is undertaken in 3D Slicer, an open source medical visualization software package. |
Augmented Reality Visualization using Image Overlay Technology for MR-Guided Interventions: Cadaveric Bone Biopsy at 1.5 T
|
Publication: Invest Radiol. 2013 Jun;48(6):464-70. PMID: 23328911 Authors: Fritz J, U-Thainual P, Ungi T, Flammang AJ, McCarthy EF, Fichtinger G, Iordachita II, Carrino JA. Institution: Russell H. Morgan Department of Radiology and Radiological Science, Johns Hopkins University School of Medicine, Baltimore, MD, USA. Background/Purpose: The purpose of this study was to prospectively test the hypothesis that image overlay technology facilitates accurate navigation for magnetic resonance (MR)-guided osseous biopsy. A prototype augmented reality image overlay system was used in conjunction with a clinical 1.5-T MR imaging system. Osseous biopsy of a total of 16 lesions was planned in 4 human cadavers with osseous metastases. A loadable module of 3D Slicer open-source medical image analysis and visualization software was developed and used for display of MR images, lesion identification, planning of virtual biopsy paths, and navigation of drill placement. The osseous drill biopsy was performed by maneuvering the drill along the displayed MR image containing the virtual biopsy path into the target. The drill placement and the final drill position were monitored by intermittent MR imaging. Outcome variables included successful drill placement, number of intermittent MR imaging control steps, target error, number of performed passes and tissue sampling, time requirements, and pathological analysis of the obtained osseous core specimens including adequacy of specimens, presence of tumor cells, and degree of necrosis. A total of 16 osseous lesions were sampled with percutaneous osseous drill biopsy. Eight lesions were located in the osseous pelvis (8/16, 50%) and 8 (8/16, 50%) lesions were located in the thoracic and lumbar spine. Lesion size was 2.2 cm (1.1-3.5 cm). Four (2-8) MR imaging control steps were required. MR imaging demonstrated successful drill placement inside 16 of the 16 target lesions (100%). One needle pass was sufficient for accurate targeting of all lesions. One tissue sample was obtained in 8 of the 16 lesions (50%); 2, in 6 of the16 lesions (38%); and 3, in 2 of the 16 lesions (12%). The target error was 4.3 mm (0.8-6.8 mm). Length of time required for biopsy of a single lesion was 38 minutes (20-55 minutes). Specimens of 15 of the 16 lesions (94%) were sufficient for pathological evaluation. Of those 15 diagnostic specimens, 14 (93%) contained neoplastic cells, whereas 1 (7%) specimen demonstrated bone marrow without evidence of neoplastic cells. Of those 14 diagnostic specimens, 11 (79%) were diagnostic for carcinoma or adenocarcinoma, which was concordant with the primary neoplasm, whereas, in 3 of the 14 diagnostic specimens (21%), the neoplastic cells were indeterminate. Image overlay technology provided accurate navigation for the MR-guided biopsy of osseous lesions of the spine and the pelvis in human cadavers at 1.5 T. The high technical and diagnostic yield supports further evaluation with clinical trials. Funding:
|
How to Detect Amygdala Activity with Magnetoencephalography using Source Imaging
|
Publication: J Vis Exp. 2013; (76):50212 PMID: 23770774 | PDF Authors: Balderston NL, Schultz DH, Baillet S, Helmstetter FJ. Institution: Department of Psychology, University of Wisconsin-Milwaukee, WI, USA. Background/Purpose: In trace fear conditioning a conditional stimulus (CS) predicts the occurrence of the unconditional stimulus (UCS), which is presented after a brief stimulus free period (trace interval)(1). Because the CS and UCS do not co-occur temporally, the subject must maintain a representation of that CS during the trace interval. In humans, this type of learning requires awareness of the stimulus contingencies in order to bridge the trace interval(2-4). However when a face is used as a CS, subjects can implicitly learn to fear the face even in the absence of explicit awareness*. This suggests that there may be additional neural mechanisms capable of maintaining certain types of "biologically-relevant" stimuli during a brief trace interval. Given that the amygdala is involved in trace conditioning, and is sensitive to faces, it is possible that this structure can maintain a representation of a face CS during a brief trace interval. It is challenging to understand how the brain can associate an unperceived face with an aversive outcome, even though the two stimuli are separated in time. Furthermore investigations of this phenomenon are made difficult by two specific challenges. First, it is difficult to manipulate the subject's awareness of the visual stimuli. One common way to manipulate visual awareness is to use backward masking. In backward masking, a target stimulus is briefly presented (< 30 msec) and immediately followed by a presentation of an overlapping masking stimulus(5). The presentation of the mask renders the target invisible(6-8). Second, masking requires very rapid and precise timing making it difficult to investigate neural responses evoked by masked stimuli using many common approaches. Blood-oxygenation level dependent (BOLD) responses resolve at a timescale too slow for this type of methodology, and real time recording techniques like electroencephalography (EEG) and magnetoencephalography (MEG) have difficulties recovering signal from deep sources. However, there have been recent advances in the methods used to localize the neural sources of the MEG signal(9-11). By collecting high-resolution MRI images of the subject's brain, it is possible to create a source model based on individual neural anatomy. Using this model to "image" the sources of the MEG signal, it is possible to recover signal from deep subcortical structures, like the amygdala and the hippocampus. Funding:
|
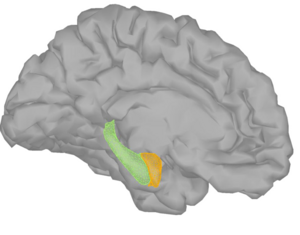 MEG results from a typical conditioning experiment. The figure shows the 3D models of the amygdala (orange), hippocampus (green), using 3D Slicer and cerebral cortex used to model the sources of the MEG signal. |
Paired Inspiratory-expiratory Chest CT Scans to Assess for Small Airways Disease in COPD
|
Publication: Respir Res. 2013 Apr;14:42. PMID: 23566024 | PDF Authors: Hersh CP, Washko GR, Estépar RS, Lutz S, Friedman PJ, Han MK, Hokanson JE, Judy PF, Lynch DA, Make BJ, Marchetti N, Newell JD Jr, Sciurba FC, Crapo JD, Silverman EK; COPDGene Investigators Institution: Channing Division of Network Medicine, Brigham and Women's Hospital, Harvard Medical School, Boston, MA, USA. Background/Purpose: Gas trapping quantified on chest CT scans has been proposed as a surrogate for small airway disease in COPD. We sought to determine if measurements using paired inspiratory and expiratory CT scans may be better able to separate gas trapping due to emphysema from gas trapping due to small airway disease. Methods: Smokers with and without COPD from the COPDGene Study underwent inspiratory and expiratory chest CT scans. Emphysema was quantified by the percent of lung with attenuation < −950HU on inspiratory CT. Four gas trapping measures were defined: (1) Exp−856, the percent of lung < −856HU on expiratory imaging; (2) E/I MLA, the ratio of expiratory to inspiratory mean lung attenuation; (3) RVC856-950, the difference between expiratory and inspiratory lung volumes with attenuation between −856 and −950 HU; and (4) Residuals from the regression of Exp−856 on percent emphysema. Results: In 8517 subjects with complete data, Exp−856 was highly correlated with emphysema. The measures based on paired inspiratory and expiratory CT scans were less strongly correlated with emphysema. Exp−856, E/I MLA and RVC856-950 were predictive of spirometry, exercise capacity and quality of life in all subjects and in subjects without emphysema. In subjects with severe emphysema, E/I MLA and RVC856-950 showed the highest correlations with clinical variables. Conclusions: Quantitative measures based on paired inspiratory and expiratory chest CT scans can be used as markers of small airway disease in smokers with and without COPD, but this will require that future studies acquire both inspiratory and expiratory CT scans. Funding:
|
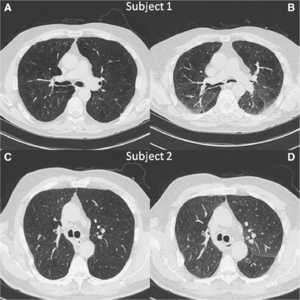 Inspiratory (A,C) and expiratory (B,D) chest CT images from two subjects with similar percent of lung voxels with attenuation values < −856HU on expiratory CT scans (Exp−856) demonstrate the inability of expiratory image analysis alone to distinguish gas trapping due to emphysema from gas trapping due to small airway disease. Computerized image analysis was performed with 3D SLICER software. |
Imaging in Audiology: A Case Report of a Patient with Bilateral Acoustic Neuroma
|
Publication: Poster Presentation at the 11th congress of the European Federation of Audiology Societies (EFAS) June 19-22, 2013. Poster with Embedded Video [codec: Xvid (free,open source), Office: MS Office 2010] | Case Time Line Authors: Nagy AL, Jarabin J, Toth F, Rovo L, Kiss JG. Institution: University of Szeged, Department of Oto-rhino-laryngology and Head and Neck Surgery, Szeged, Hungary. Background/Purpose: We present a patient with bilateral acoustic neuromas. The tumor was tracked from 2006 until 2013. Pre- and postoperative CT and MR scans are shown. Both neuroma volumes were computed at different time points, before and after various interventions (stereotaxic irradiation, neurosurgery). We also compared the size change of the neuromas over time at different time points, by registering five volumes of differing modalities (four MR and one CT) using a one-by-one registration technique. We used the freely available open source software 3D Slicer to reconstruct 3D CT and MR data, to register, and overlay them; and to visually track the changes. |
Computed Tomography Image Processing to Detect the Real Mechanism of Bioprosthesis Failure: Implication for Valve-in-valve Implantation
|
Publication: J Heart Valve Dis. 2013 Mar;22(2):236-8. PMID: 23798214 Authors: Ruggieri VG, Anselmi A, Wang Q, Esneault S, Haigron P, Verhoye JP. Institution: Department of Cardiovascular and Thoracic Surgery, Pontchaillou University Hospital, Rennes, France. Background/Purpose: Transcatheter valve-in-valve implantation is an emerging option for patients with structural deterioration of an aortic bioprosthesis and who are at a high surgical risk. The present case underlines the need for dedicated imaging to accurately understand the mechanism of valve failure, and the feasibility of a valve-in-valve procedure. Methods: A patient with structural bioprosthetic deterioration at echocardiography was investigated using computed tomography (CT) scanning and novel 3D Slicer software. The findings were compared with those revealed at intraoperative pathology. Results: Post-processed CT images showed the bulk of calcifications to be located at the subvalvular level, suggesting the presence of calcified pannus. Pathology of the explanted valve confirmed that the valve stenosis was due primarily to pannus. Misdiagnosed calcified pannus represents a major threat during valve-in-valve procedures, due mainly to embolic risk. Conclusion: The 3D Slicer elaboration of CT images may be invaluable in providing a precise definition of the mechanism of valve failure, and also to establish the feasibility of either a valve-in-valve procedure or conventional surgery. |
|
Publication: J Neurol Surg A Cent Eur Neurosurg. 2013 Mar;74(2):71-6. PMID: 23404553 Authors: Inoue D, Cho B, Mori M, Kikkawa Y, Amano T, Nakamizo A, Yoshimoto K, Mizoguchi M, Tomikawa M, Hong J, Hashizume M, Sasaki T. Institution: Department of Neurosurgery, Graduate School of Medical Sciences, Kyushu University, Fukuoka, Japan. Background/Purpose: To develop an augmented reality (AR) neuronavigation system with Web cameras and examine its clinical utility. The utility of the system was evaluated in three patients with brain tumors. One patient had a glioblastoma and two patients had convexity meningiomas. Our navigation system comprised the open-source software 3D Slicer (Brigham and Women's Hospital, Boston, MA, USA), the infrared optical tracking sensor Polaris (Northern Digital Inc., Waterloo, Canada), and Web cameras. We prepared two different types of Web cameras: a handheld type and a headband type. Optical markers were attached to each Web camera. We used this system for skin incision planning before the operation, during craniotomy, and after dural incision. Results: We were able to overlay these images in all cases. In Case 1, accuracy could not be evaluated because the tumor was not on the surface, though it was generally suitable for the outline of the external ear and the skin. In Cases 2 and 3, the augmented reality error was ∼2 to 3 mm. AR technology was examined with Web cameras in neurosurgical operations. Our results suggest that this technology is clinically useful in neurosurgical procedures, particularly for brain tumors close to the brain surface. |
Quantitative MRI Analysis of Craniofacial Bone Marrow in Patients with Sickle Cell Disease
|
Publication: AJNR Am J Neuroradiol. 2013 Mar;34(3):622-7. PMID: 22878006| PDF Authors: Elias EJ, Liao JH, Jara H, Watanabe M, Nadgir RN, Sakai Y, Erbay K, Saito N, Ozonoff A, Steinberg MH, Sakai O. Institution: Departments of Radiology and Medicine, Boston Medical Center, Boston University School of Medicine, Boston, MA, USA. Background/Purpose: Assessment of bone marrow is most commonly performed qualitatively in the spine or other large long bones. The craniofacial bones are less ideal for bone marrow analysis because of the relatively small bone marrow volume. Because patients with SCD often undergo repeated brain imaging to evaluate for cerebral vaso-occlusive disease, quantitative assessment of craniofacial bone marrow is a reasonable possibility in these patients. The purpose of this study was to investigate specific sickle cell disease changes in craniofacial bone marrow quantitatively by analyzing T1, T2 and secular-T2 relaxation times and volume with the use of quantitative MRI. Fourteen patients with SCD and 17 control subjects were imaged with the mixed TSE pulse sequence at 1.5T. The craniofacial bones were manually segmented by using 3D Slicer to generate bone marrow volumes and to provide T1, T2, and secular-T2 relaxation times. All subjects exhibited a bimodal T1 histogram. In the SCD group, there was a decrease in amplitude in the first T1 peak and an increase in amplitude in the second T1 peak. The first T1 peak showed a significant increase in relaxation time compared with control subjects (P < .0001), whereas there was no significant difference in the second T1 peak. T2 and secular-T2 relaxation times were significantly shorter in the SCD group (T2, P < .0001; secular-T2, P < .0001). Increasing numbers of blood transfusions resulted in a decrease in T2 and secular-T2 times. Patients with SCD exhibited a larger bone marrow volume compared with control subjects, even after standardization. Patients with SCD exhibited significant quantifiable changes in the craniofacial bone marrow because of failure of red-to-yellow marrow conversion and iron deposition that can be identified by qMRI relaxometry and volumetry. Both qMRI relaxometry and volumetry may be used as noninvasive tools for assessment of disease severity. |
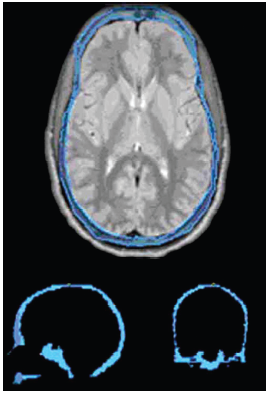 Craniofacial bone marrow segmentation. The bone marrow of a 24.5-year-old man with sickle cell disease (outlined in blue) has been segmented on the axial proton attenuation–weighted images with 3 mm thickness. Approximately 75 images were segmented per subject. After segmentation was complete, 3D Slicer was used to layer the images over each other to create a 3D model. Shown below are sagittal (bottom left) and coronal (bottom right) images cut through the fully segmented cranial bone marrow after 3D reconstruction. After segmentation, the image data were analyzed in Mathcad for T1, T2, and secular-T2 relaxation times and volume. |
Software for MR Image Overlay Guided Needle Insertions: The Clinical Translation Process
|
Publication: Proc. SPIE 8671, Medical Imaging 2013: Image-Guided Procedures, Robotic Interventions, and Modeling, 867116 (March 12, 2013). Authors: Ungi T, U-Thainual P, FritzJ, Iordachita II, Flammang AJ, Carrino JA, Fichtinger G. Institution: School of Computing, Queen's University, Kingston, ON, Canada. Background/Purpose: Needle guidance software using augmented reality image overlay was translated from the experimental phase to support preclinical and clinical studies. Major functional and structural changes were needed to meet clinical requirements. We present the process applied to fulfill these requirements, and selected features that may be applied in the translational phase of other image-guided surgical navigation systems. Methods: We used an agile software development process for rapid adaptation to unforeseen clinical requests. The process is based on iterations of operating room test sessions, feedback discussions, and software development sprints. The open-source application framework of 3D Slicer and the NA-MIC kit provided sufficient flexibility and stable software foundations for this work. Results: All requirements were addressed in a process with 19 operating room test iterations. Most features developed in this phase were related to workflow simplification and operator feedback. Conclusion: Efficient and affordable modifications were facilitated by an open source application framework and frequent clinical feedback sessions. Results of cadaver experiments show that software requirements were successfully solved after a limited number of operating room tests. |
Analysis of Conventional Swept-source OCT of Subglottic Stenosis in a Rabbit Model
|
Publication: Proc. SPIE 8565, Photonic Therapeutics and Diagnostics IX, 856521 (March 8, 2013). Authors: Hamamoto A, Su E, Peaks Y, Chen Z, Wong BJF. Institution: Beckman Laser Institute and Medical Clinic, Irvine, CA, USA. Background/Purpose: Acquired subglottic stenosis is a narrowing of the airway caused by prolonged endotracheal intubation. Currently, there are no non-invasive means to diagnose the disease. A previous study by this same group introduced optical coherence tomography (OCT) as a means of monitoring the progression of stenosis. The aim of the current study was to qualitatively and quantitatively analyze OCT images obtained from a subglottic stenosis model of the rabbit airway. 15 rabbits were used throughout the study, and a MEMs based OCT probe was utilized. The OCT images obtained were analyzed using a free software program, 3D Slicer. The region of scarred tissue was grown out and measured quantitatively. This study demonstrated the feasibility of using a program to quantify the progression of scarring in OCT images, in addition to qualitatively correlating between histology, endoscopic, and OCT images. Future works may include utilization of a long-range probe and use of a pressure necrosis model to better emulate the actual onset of neonatal subglottic stenosis. |
Three-dimensional Volumetric Rendition of Cannon Ball Pulmonary Metastases by the Use of 3D Slicer, an Open Source Free Software Package
|
Publication: BMJ Case Rep. 2013 Feb 4;2013. PMID: 23386494 | PDF Authors: Revannasiddaiah S, Susheela SP, Madhusudhan N, Mallarajapatna GJ. Institution: Department of Radiation Oncology, HealthCare Global-Bangalore Institute of Oncology, Bengaluru, Karnataka, India. Background/Purpose: A gentleman treated 6 years ago for colonic carcinoma (stage-IIA) had been on regular follow-up for a span of 4 years, when he was apparently disease-free. After being lost to follow-up in the past 2 years, he was recently diagnosed with a pathological fracture of the seventh thoracic vertebra for which he underwent surgery (vertebral fixation and cord decompression) on an emergency basis. Postoperatively, he underwent a CT simulation of the thorax with the purpose of planning radiotherapy (RT) to the involved vertebrae. The CT-scan demonstrated multiple bilateral pulmonary nodules. After palliative RT to the involved vertebral column, in the interest of academics, we utilised the CT-scan data for volumetric reconstructions to attempt a better depiction of the well-known phenomenon of ‘cannon ball metastases’. This was achieved by the use of 3D Slicer 4.2, an open source software package (distributed under a BSD-style open source license) intended for advanced visualisation and analysis of medical image datasets. This, to our knowledge, is possibly the first publication providing a three-dimensional depiction of ‘cannon ball’ pulmonary metastases. |
In Vivo Imaging of Dopaminergic Neurotransmission after Transient Focal Ischemia in Rats
|
Publication: J Cereb Blood Flow Metab. 2013 Feb;33(2):244-52. PMID: 23149560 | PDF Authors: Martín A, Gómez-Vallejo V, San Sebastián E, Padró D, Markuerkiaga I, Llarena I, Llop J. Institution: Molecular Imaging Unit, CIC biomaGUNE, San Sebastián, Spain. Background/Purpose: The precise biologic mechanisms involved in functional recovery processes in response to stroke such as dopaminergic neurotransmission are still largely unknown. For this purpose, we performed in parallel in vivo magnetic resonance imaging and positron emission tomography (PET) with [(18)F]fluorodeoxyglucose ([(18)F]FDG) and [(11)C]raclopride at 1, 3, 7, 14, 21, and 28 days after middle cerebral artery occlusion in rats. In the ischemic territory, PET [(18)F]FDG showed a initial decrease in cerebral metabolism followed by a time-dependent recovery to quasi-normal values at day 14 after ischemia. The PET with [(11)C]raclopride, a ligand for dopamine D(2) receptor, showed a sustained binding during the first week after ischemia that declined dramatically from day 14 to day 28. Interestingly, a slight increase in [(11)C]raclopride binding was observed at days 1 to 3 followed by the uppermost binding at day 7 in the contralateral territory. Likewise, in vitro autoradiography using [(3)H]raclopride confirmed these in vivo results. Finally, the neurologic test showed major neurologic impairment at day 1 followed by a recovery of the cerebral function at day 28 after cerebral ischemia. Taken together, these results might suggest that dopamine D(2) receptor changes in the contralateral hemisphere could have a key role in functional recovery after cerebral ischemia. |
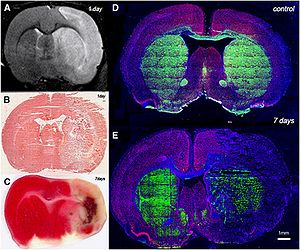 Brain lesion evolution after cerebral ischemia. magnetic resonance imaging (MRI) alterations in T2-weighted (T2W) signal (A) and hematoxyline-eosine stained brain section at day 1 after reperfusion (B). 2,3,5-Triphenyltetrazolium chloride (TTC) stained section at day 7 (C). Immunofluorescent labeling of tyrosine hydroxylase (TH) (green), NeuN (red), and 4′-6′-diamidino-2-phenylindole (DAPI) (blue) of an axial section of a control brain (D) and at day 7 after cerebral ischemia (E). Regions of interest were manually defined using the Open Source software 3D Slicer image analysis software (Version 3.6.3. for each rat on the region of increased signal in the ipsilateral hemisphere. |
MRI Evidence for Altered Venous Drainage and Intracranial Compliance in Mild Traumatic Brain Injury
|
Publication: PLoS One. 2013 Feb;8(2):e55447. PMID: 23405151 | PDF Authors: Pomschar A, Koerte I, Lee S, Laubender RP, Straube A, Heinen F, Ertl-Wagner B, Alperin N. Institution: Institute of Clinical Radiology, University of Munich - Grosshadern Campus, Ludwig-Maximilians-University, Munich, Germany. Background/Purpose: To compare venous drainage patterns and associated intracranial hydrodynamics between subjects who experienced mild traumatic brain injury (mTBI) and age- and gender-matched controls. Thirty adult subjects (15 with mTBI and 15 age- and gender-matched controls) were investigated using a 3T MR scanner. Time since trauma was 0.5 to 29 years (mean 11.4 years). A 2D-time-of-flight MR-venography of the upper neck was performed to visualize the cervical venous vasculature. Cerebral venous drainage through primary and secondary channels, and intracranial compliance index and pressure were derived using cine-phase contrast imaging of the cerebral arterial inflow, venous outflow, and the craniospinal CSF flow. The intracranial compliance index is the defined as the ratio of maximal intracranial volume and pressure changes during the cardiac cycle. MR estimated ICP was then obtained through the inverse relationship between compliance and ICP. Funding:
|
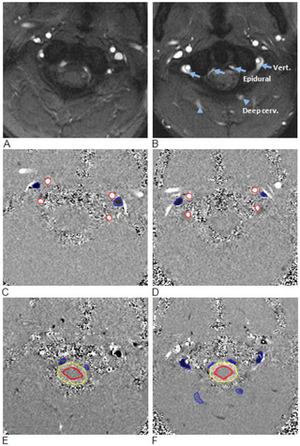 Examples of high and low velocity encoded phase contrast images from a control subject (left) and a subject with mTBI (right). A–B: Flow compensated magnitude images showing the bright signal from blood vessels. The augmented venous outflow through the epidural, vertebral veins (arrows) and the deep cervical veins (arrow heads) is well visualized. C–D: High-velocity encoding images used for measurements of arterial inflow and venous outflow through the jugular veins. E–F: Low-velocity encoding images used for measurements of the flow through the secondary channels (epidural, vertebral, and deep cervical veins) and the CSF flow. The lumen boundaries (red – arteries, blue- veins and yellow and red – CSF and cord) were identified using the PUBS automated segmentation method. |
A Robust Variational Approach for Simultaneous Smoothing and Estimation of DTI
|
Publication: Neuroimage. 2013 Feb 15;67:33-41. PMID: 23165324 | PDF Authors: Liu M, Vemuri BC, Deriche R. Institution: Siemens Corporate Research & Technology, Princeton, NJ, USA. Background/Purpose: Estimating diffusion tensors is an essential step in many applications - such as diffusion tensor image (DTI) registration, segmentation and fiber tractography. Most of the methods proposed in the literature for this task are not simultaneously statistically robust and feature preserving techniques. In this paper, we propose a novel and robust variational framework for simultaneous smoothing and estimation of diffusion tensors from diffusion MRI. Our variational principle makes use of a recently introduced total Kullback-Leibler (tKL) divergence for DTI regularization. tKL is a statistically robust dissimilarity measure for diffusion tensors, and regularization by using tKL ensures the symmetric positive definiteness of tensors automatically. Further, the regularization is weighted by a non-local factor adapted from the conventional non-local means filters. Finally, for the data fidelity, we use the nonlinear least-squares term derived from the Stejskal-Tanner model. We present experimental results depicting the positive performance of our method in comparison to competing methods on synthetic and real data examples. Funding:
|
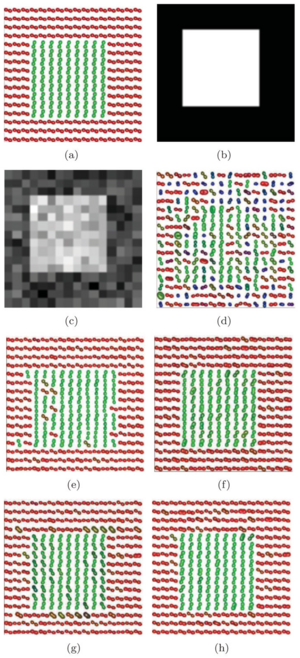 (a) Ground truth synthetic DTI field, (b) the original DWI corresponding to g1, (c) the Rician noise affected DWI, the DTI estimation using (d) MRE, (e) VF, (f) LMMSE, (g) NLM, and (h) the proposed technique. For LMMSE, we used the implementation in 3D Slicer 3.6. |
Augmented Reality Visualisation Using an Image Overlay System for MR-guided Interventions: Technical Performance of Spine Injection Procedures in Human Cadavers at 1.5 Tesla
|
Publication: Eur Radiol. 2013 Jan;23(1):235-45. PMID: 22797956 Authors: Fritz J, U-Thainual P, Ungi T, Flammang AJ, Fichtinger G, Iordachita II, Carrino JA. Institution: Russell H. Morgan Department of Radiology and Radiological Science, Johns Hopkins University School of Medicine, Baltimore, MD, USA. Background/Purpose: To prospectively assess the technical performance of an augmented reality system for MR-guided spinal injection procedures. The augmented reality system was used with a clinical 1.5-T MRI system. A total of 187 lumbosacral spinal injection procedures (epidural injection, spinal nerve root injection, facet joint injection, medial branch block, discography) were performed in 12 human cadavers. Needle paths were planned with the Perk Station module of 3D Slicer software on high-resolution MR images. Needles were placed under augmented reality MRI navigation. MRI was used to confirm needle locations. T1-weighted fat-suppressed MRI was used to visualise the injectant. Outcome variables assessed were needle adjustment rate, inadvertent puncture of non-targeted structures, successful injection rate and procedure time. Needle access was achieved in 176/187 (94.1 %) targets, whereas 11/187 (5.9 %) were inaccessible. Six of 11 (54.5 %) L5-S1 disks were inaccessible, because of an axial obliquity of 30˚ (27˚-34˚); 5/11 (45.5 %) facet joints were inaccessible because of osteoarthritis or fusion. All accessible targets (176/187, 94.1 %) were successfully injected, requiring 47/176 (26.7 %) needle adjustments. There were no inadvertent punctures of vulnerable structures. Median procedure time was 10.2 min (5-19 min). Image overlay navigated MR-guided spinal injections were technically accurate. Disks with an obliquity ≥27˚ may be inaccessible. Funding:
|
2012
Comparative Evaluation of Mitral Valve Strain by Deformation Tracking in 3D-Echocardiography
|
Publication: Cardiovascular Engineering and Technology 2012 Dec, 3(4):402-12. | PDF Authors: Zekry B, Lawry G, Little S, Zoghbi W, Freeman J, Jajoo a, Jain s, He J, Martynenko A, Azencott R. Institution: The Methodist Hospital Research Institute, Houston, TX. Background/Purpose: We present new algorithms to compute patient specific strain maps for mitral valve leaflets, by tracking and modeling deformations of the mitral valve apparatus in 3D echocardiography. We can then quantify comparisons of mitral leaflets strain maps between normal patients and cases of mitral valve prolapse or regurgitation. For patients with mitral valve regurgitation, we compare mitral leaflets strain maps between pre-surgery and post-surgery, to quantify the strain reduction due to mitral valve repair surgery. Funding:
|
Perk Tutor: An Open-source Training Platform for Ultrasound-guided Needle Insertions
|
Publication: IEEE Trans Biomed Eng. 2012 Dec;59(12):3475-81. PMID: 23008243 Authors: Ungi T, Sargent D, Moult E, Lasso A, Pinter C, McGraw RC, Fichtinger G. Institution: School of Computing, Queen's University, Kingston, ON, Canada. Background/Purpose: mage-guided needle placement, including ultrasound (US)-guided techniques, have become commonplace in modern medical diagnosis and therapy. To ensure that the next generations of physicians are competent using this technology, efficient and effective educational programs need to be developed. This paper presents the Perk Tutor: a configurable, open-source training platform for US-guided needle insertions. The Perk Tutor was successfully tested in three different configurations to demonstrate its adaptability to different procedures and learning objectives. 1) The Targeting Tutor, designed to develop US-guided needle targeting skills, 2) the Lumbar Tutor, designed for practicing US-guided lumbar spinal procedures, and (3) the Prostate Biopsy Tutor, configured for US-guided prostate biopsies. The Perk Tutor provides the trainee with quantitative feedback on progress toward the specific learning objectives of each configuration. Configurations were implemented through simple rearrangement of hardware and software components, attesting to the modularity and ease of configuration. The Perk Tutor is provided as a free resource to enable research and development of educational programs for US-guided intervention. |
Pituitary Adenoma Volumetry with 3D Slicer
|
Publication: PLoS One. 2012 Dec;7(12):e51788. PMID: 23240062 | PDF Authors: Egger J, Kapur T, Nimsky C, Kikinis R. Institution: Department of Radiology, Brigham and Women's Hospital, Harvard Medical School, Boston, MA, USA. Background/Purpose: In this study, we present pituitary adenoma volumetry using the free and open source medical image computing platform for biomedical research: 3D Slicer. Volumetric changes in cerebral pathologies like pituitary adenomas are a critical factor in treatment decisions by physicians and in general the volume is acquired manually. Therefore, manual slice-by-slice segmentations in magnetic resonance imaging (MRI) data, which have been obtained at regular intervals, are performed. In contrast to this manual time consuming slice-by-slice segmentation process, 3D Slicer is an alternative which can be significantly faster and less user intensive. In this contribution, we compare pure manual segmentations of ten pituitary adenomas with semi-automatic segmentations with 3D Slicer. Thus, physicians drew the boundaries completely manually on a slice-by-slice basis and performed a Slicer-enhanced segmentation using the competitive region-growing based module of 3D Slicer named GrowCut. Results showed that the time and user effort required for GrowCut-based segmentations were on average about thirty percent less than the pure manual segmentations. Furthermore, we calculated the Dice Similarity Coefficient (DSC) between the manual and the Slicer-based segmentations to proof that the two are comparable yielding an average DSC of 81.9763.39%. Funding:
|
 3D Slicer interface with the Slicer-Editor on the left side and a loaded pituitary adenoma data set on the right side: axial slice (upper left window), sagittal slice (lower left window), coronal slice (lower right window) and the three slices shown in a 3D visualization (upper right window). |
Differences in Simple Morphological Variables in Ruptured and Unruptured Middle Cerebral Artery Aneurysms
|
Publication: J Neurosurg. 2012 Nov;117(5):913-9. PMID: 22957531 | PDF Authors: Lin N, Ho A, Gross BA, Pieper S, Frerichs KU, Day AL, Du R. Institution: Department of Neurosurgery, and Surgical Planning Laboratory, Brigham and Women's Hospital, Harvard Medical School, Boston, MA, USA. Background/Purpose: Object Management of unruptured intracranial aneurysms remains controversial in neurosurgery. The contribution of morphological parameters has not been included in the treatment paradigm in a systematic manner or for any particular aneurysm location. The authors present a large sample of middle cerebral artery (MCA) aneurysms that were assessed using morphological variables to determine the parameters associated with aneurysm rupture. Methods: Preoperative CT angiography (CTA) studies were evaluated using 3D Slicer software to generate 3D models of the aneurysms and their surrounding vascular architecture. Morphological parameters examined in each model included 5 variables already defined in the literature (aneurysm size, aspect ratio, aneurysm angle, vessel angle, and size ratio) and 3 novel variables (flow angle, distance to the genu, and parent-daughter angle). Univariate and multivariate statistical analyses were performed to determine statistical significance. Results Between 2005 and 2008, 132 MCA aneurysms were treated at a single institution, and CTA studies of 79 aneurysms (40 ruptured and 39 unruptured) were analyzed. Fifty-three aneurysms were excluded because of reoperation (4), associated AVM (2), or lack of preoperative CTA studies (47). Ruptured aneurysms were associated with larger size, greater aspect ratio, larger aneurysm and flow angles, and smaller parent-daughter angle. Multivariate logistic regression revealed that aspect ratio, flow angle, and parent-daughter angle were the strongest factors associated with ruptured aneurysms. Aspect ratio, flow angle, and parent-daughter angle are more strongly associated with ruptured MCA aneurysms than size. The association of parameters independent of aneurysm morphology with ruptured aneurysms suggests that these parameters may be associated with an increased risk of aneurysm rupture. These factors are readily applied in clinical practice and should be considered in addition to aneurysm size when assessing the risk of aneurysm rupture specific to the MCA location. Funding:
|
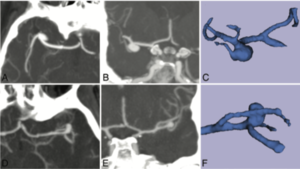 Computed tomography angiograms and 3D models of unruptured and ruptured aneurysms. A and B: Axial (A) and coronal (B) MIP images showing an unruptured right MCA aneurysm. D and E: Axial (D) and coronal (E) MIP images showing a ruptured left MCA aneurysm. C and F: Corresponding 3D reconstructed 3D Slicer images. |
3D Slicer as an Image Computing Platform for the Quantitative Imaging Network
|
Publication: Magn Reson Imaging. 2012 Nov;30(9):1323-41. PMID: 22770690 | PDF Authors: Fedorov A, Beichel R, Kalpathy-Cramer J, Finet J, Fillion-Robin JC, Pujol S, Bauer C, Jennings D, Fennessy F, Sonka M, Buatti J, Aylward S, Miller JV, Pieper S, Kikinis R. Institution: Brigham and Women's Hospital, Harvard Medical School, Boston, MA, USA. Background/Purpose: Quantitative analysis has tremendous but mostly unrealized potential in healthcare to support objective and accurate interpretation of the clinical imaging. In 2008, the National Cancer Institute began building the Quantitative Imaging Network (QIN) initiative with the goal of advancing quantitative imaging in the context of personalized therapy and evaluation of treatment response. Computerized analysis is an important component contributing to reproducibility and efficiency of the quantitative imaging techniques. The success of quantitative imaging is contingent on robust analysis methods and software tools to bring these methods from bench to bedside. 3D Slicer is a free open-source software application for medical image computing. As a clinical research tool, 3D Slicer is similar to a radiology workstation that supports versatile visualizations but also provides advanced functionality such as automated segmentation and registration for a variety of application domains. Unlike a typical radiology workstation, 3D Slicer is free and is not tied to specific hardware. As a programming platform, 3D Slicer facilitates translation and evaluation of the new quantitative methods by allowing the biomedical researcher to focus on the implementation of the algorithm and providing abstractions for the common tasks of data communication, visualization and user interface development. Compared to other tools that provide aspects of this functionality, 3D Slicer is fully open source and can be readily extended and redistributed. In addition, 3D Slicer is designed to facilitate the development of new functionality in the form of 3D Slicer extensions. In this paper, we present an overview of 3D Slicer as a platform for prototyping, development and evaluation of image analysis tools for clinical research applications. To illustrate the utility of the platform in the scope of QIN, we discuss several use cases of 3D Slicer by the existing QIN teams, and we elaborate on the future directions that can further facilitate development and validation of imaging biomarkers using 3D Slicer. Funding:
|
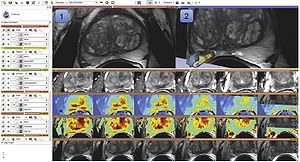 Visualization capabilities and 3D Slicer user interface are utilized for exploration of the multiparametric MRI of the prostate. The T2w MR scans (top left image and the bottom row of consecutive slices) provide anatomical detail and context for interpretation of the registered ADC map (first row of the image matrix) calculated from the DWI and various pharmacokinetic maps computed from DCE MRI, as shown in the 2D axial slice viewer (marked by “1”) and the Compare View layout below. Spatial context of the annotated tumor ROI is provided by composed view of the tumor ROI surface and the T2w image cross-section in the 3D viewer (marked by “2”). |
SlicerRT: Radiation Therapy Research oolkit for 3D Slicer
|
Publication: Med Phys. 2012 Oct;39(10):6332-8. PMID: 23039669 | PDF Authors: Pinter C, Lasso A, Wang A, Jaffray D, Fichtinger G. Institution: School of Computing, Queen's University, Kingston, ON, Canada. Background/Purpose: Interest in adaptive radiation therapy research is constantly growing, but software tools available for researchers are mostly either expensive, closed proprietary applications, or free open-source packages with limited scope, extensibility, reliability, or user support. To address these limitations, we propose SlicerRT, a customizable, free, and open-source radiation therapy research toolkit. SlicerRT aspires to be an open-source toolkit for RT research, providing fast computations, convenient workflows for researchers, and a general image-guided therapy infrastructure to assist clinical translation of experimental therapeutic approaches. It is a medium into which RT researchers can integrate their methods and algorithms, and conduct comparative testing. SlicerRT was implemented as an extension for the widely used 3D Slicer medical image visualization and analysis application platform. SlicerRT provides functionality specifically designed for radiation therapy research, in addition to the powerful tools that 3D Slicer offers for visualization, registration, segmentation, and data management. The feature set of SlicerRT was defined through consensus discussions with a large pool of RT researchers, including both radiation oncologists and medical physicists. The development processes used were similar to those of 3D Slicer to ensure software quality. Standardized mechanisms of 3D Slicer were applied for documentation, distribution, and user support. The testing and validation environment was configured to automatically launch a regression test upon each software change and to perform comparison with ground truth results provided by other RT applications. Modules have been created for importing and loading DICOM-RT data, computing and displaying dose volume histograms, creating accumulated dose volumes, comparing dose volumes, and visualizing isodose lines and surfaces. The effectiveness of using 3D Slicer with the proposed SlicerRT extension for radiation therapy research was demonstrated on multiple use cases. A new open-source software toolkit has been developed for radiation therapy research. SlicerRT can import treatment plans from various sources into 3D Slicer for visualization, analysis, comparison, and processing. The provided algorithms are extensively tested and they are accessible through a convenient graphical user interface as well as a flexible application programming interface. |
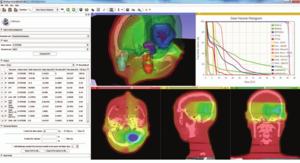 Dose volume histogram module in a standard 3D Slicer layout with basic visualization. The module toolbox can be seen on the left side, and the DVH chart is found in the upper right corner. |
Developmental Trajectories of Amygdala and Hippocampus from Infancy to Early Adulthood in Healthy Individuals
|
Publication: PLoS One. 2012 Oct;7(10):e46970. PMID: 23056545 | PDF Authors: Uematsu A, Matsui M, Tanaka C, Takahashi T, Noguchi K, Suzuki M, Nishijo H. Institution: Department of Psychology, Graduate School of Medicine and Pharmaceutical Sciences, University of Toyama, Toyama, Japan. Background/Purpose: Knowledge of amygdalar and hippocampal development as they pertain to sex differences and laterality would help to understand not only brain development but also the relationship between brain volume and brain functions. However, few studies investigated development of these two regions, especially during infancy. The purpose of this study was to examine typical volumetric trajectories of amygdala and hippocampus from infancy to early adulthood by predicting sexual dimorphism and laterality. We performed a cross-sectional morphometric MRI study of amygdalar and hippocampal growth from 1 month to 25 years old, using 109 healthy individuals. The findings indicated significant non-linear age-related volume changes, especially during the first few years of life, in both the amygdala and hippocampus regardless of sex. The peak ages of amygdalar and hippocampal volumes came at the timing of preadolescence (9-11 years old). The female amygdala reached its peak age about one year and a half earlier than the male amygdala did. In addition, its rate of growth change decreased earlier in the females. Furthermore, both females and males displayed rightward laterality in the hippocampus, but only the males in the amygdala. The robust growth of the amygdala and hippocampus during infancy highlight the importance of this period for neural and functional development. The sex differences and laterality during development of these two regions suggest that sex-related factors such as sex hormones and functional laterality might affect brain development. Funding:
|
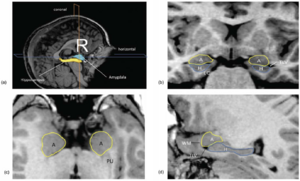 Orthogonal views for segmenting the amygdala and hippocampus on MRI sections. A three-dimensional reconstruction of images (a) in which lines indicate the position of the horizontal plane (b), sagittal plane (c), and coronal plane (d) is shown. A, Amygdala; EC, entorhinal cortex; H, hippocampus; PU, putamen; TLV, temporal horn of the lateral ventricle; WM, subamygdaloid white matter. For the amygdala and hippocampus volumes, the images were imported into the 3D Slicer software and manually defined. |
Extra-Hippocampal Subcortical Limbic Involvement Predicts Episodic Recall Performance in Multiple Sclerosis
|
Publication: PLoS One. 2012 Oct;7(10):e44942. PMID: 23056187 | PDF Authors: Dineen RA, Bradshaw CM, Constantinescu CS, Auer DP. Institution: Division of Radiological and Imaging Sciences, University of Nottingham, Nottingham, UK. Background/Purpose: Episodic memory impairment is a common but poorly-understood phenomenon in multiple sclerosis (MS). We aim to establish the relative contributions of reduced integrity of components of the extended hippocampal-diencephalic system to memory performance in MS patients using quantitative neuroimaging. 34 patients with relapsing-remitting MS and 24 healthy age-matched controls underwent 3 T MRI including diffusion tensor imaging and 3D T1-weighted volume acquisition. Manual fornix regions-of-interest were used to derive fornix fractional anisotropy (FA). Normalized hippocampal, mammillary body and thalamic volumes were derived by manual segmentation. MS subjects underwent visual recall, verbal recall, verbal recognition and verbal fluency assessment. Significant differences between MS patients and controls were found for fornix FA (0.38 vs. 0.46, means adjusted for age and fornix volume, P<.0005) and mammillary body volumes (age-adjusted means 0.114 ml vs. 0.126 ml, P<.023). Multivariate regression analysis identified fornix FA and mammillary bodies as predictor of visual recall (R(2) = .31, P = .003, P = .006), and thalamic volume as predictive of verbal recall (R(2) = .37, P<.0005). No limbic measures predicted verbal recognition or verbal fluency. These findings indicate that structural and ultrastructural alterations in subcortical limbic components beyond the hippocampus predict performance of episodic recall in MS patients with mild memory dysfunction. Funding:
|
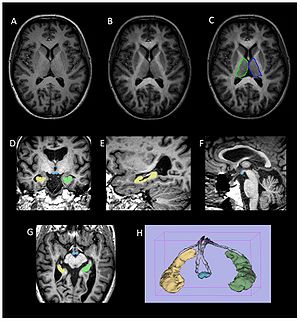 Volumetric segmentation of brain images. (a–c) Thalamic segmentation. Axial MPRAGE image from a control subject (a) before and (b) after the addition of FA weighting from the co-registered FA image. Note the increase in clarity of the lateral border of the thalamus that facilitates (c) manual segmentation of the thalamus. (d–g) axial, coronal and sagittal images from a participant with MS demonstrating ROIs drawn for the mammillary bodies (blue) and right (yellow) and left (green) hippocampi. (h) Surface rendered representation of the segmented hippocampi and mammillary bodies from a participant with MS. The manually defined fornix ROI used to derive fornix FA is also shown (grey). Volumes of the hippocampi, mammillary bodies and thalami were obtained manually from the MPRAGE images using 3D Slicer software |
Advanced Neuroimaging in Traumatic Brain Injury
|
Publication: Semin Neurol. 2012 Sep;32(4):374-400. PMID: 23361483 | PDF Authors: Edlow BL, Wu O. Institution: Department of Neurology, Massachusetts General Hospital, Boston, MA, USA. Background/Purpose: Advances in structural and functional neuroimaging have occurred at a rapid pace over the past two decades. Novel techniques for measuring cerebral blood flow, metabolism, white matter connectivity, and neural network activation have great potential to improve the accuracy of diagnosis and prognosis for patients with traumatic brain injury (TBI), while also providing biomarkers to guide the development of new therapies. Several of these advanced imaging modalities are currently being implemented into clinical practice, whereas others require further development and validation. Ultimately, for advanced neuroimaging techniques to reach their full potential and improve clinical care for the many civilians and military personnel affected by TBI, it is critical for clinicians to understand the applications and methodological limitations of each technique. In this review, we examine recent advances in structural and functional neuroimaging and the potential applications of these techniques to the clinical care of patients with TBI. We also discuss pitfalls and confounders that should be considered when interpreting data from each technique. Finally, given the vast amounts of advanced imaging data that will soon be available to clinicians, we discuss strategies for optimizing data integration, visualization, and interpretation. Funding:
|
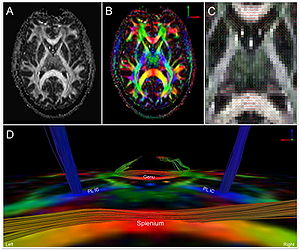 DTI and diffusion tensor tractography in a 32-year-old healthy man. Greyscale FA map (A), color-coded FA map (B), and color-coded principle eigenvector (i.e. tensor) map (C) are displayed in the axial plane at the level of the mid-thalami. A diffusion tensor tractography analysis is shown in (D) from a posterior perspective, superimposed on the axial color FA map shown in (B). In (A), the signal intensity of the FA map corresponds to the magnitude of the FA in each voxel, on a scale from 0 (black) to 1 (white). In (B, C, and D), color-coding is according to convention, with medial-lateral fibers coded red, anterior-posterior fibers coded green, and superior-inferior fibers coded blue. In (D), fiber tracts were reconstructed with TrackVis software using a deterministic, streamline tractography model. Tract termination criteria included FA < 0.2 and intervoxel angle curvature > 60 degrees. Fiber tracts in the splenium were generated using a single voxel region of interest (ROI) that was manually traced at the center of the splenium. Fiber tracts in the bilateral posterior limbs of the internal capsule (PL IC) were also generated using single voxel ROIs traced at the centers of the PL IC. Tracts in the genu were generated using a single voxel ROI traced in the forceps minor fasciculus of the right frontal lobe. |
Posterior Vaginal Prolapse Shape and Position Changes at Maximal Valsalva Seen in 3D MRI-based Models
|
Publication: Int Urogynecol J. 2012 Sep;23(9):1301-6. PMID: 22527556 | PDF Authors: Luo J, Larson KA, Fenner DE, Ashton-Miller JA, Delancey JO. Institution: Pelvic Floor Research Group, University of Michigan, Ann Arbor, MI, USA. Background/Purpose: Two-dimensional magnetic resonance imaging (MRI) of posterior vaginal prolapse has been studied. However, the three-dimensional (3D) mechanisms causing such prolapse remain poorly understood. This discovery project was undertaken to identify the different 3D characteristics of models of rectocele-type posterior vaginal prolapse (PVP(R)) in women. Ten women with (cases) and ten without (controls) PVP(R) were selected from an ongoing case-control study. Supine, multiplanar MR imaging was performed at rest and maximal Valsalva. Three-dimensional reconstructions of the posterior vaginal wall and pelvic bones were created using 3D Slicer v.3.4.1. In each slice the posterior vaginal wall and perineal skin were outlined to the anterior margin of the external anal sphincter to include the area of the perineal body. Women with predominant enteroceles or anterior vaginal prolapse were excluded. The case and control groups had similar demographics. In women with PVP(R) two characteristics were consistently visible (10/10): (1) the posterior vaginal wall displayed a folding phenomenon similar to a person beginning to kneel ("kneeling" shape) and (2) a downward displacement in the upper two thirds of the vagina. Also seen in some, but not all of the scans were: (3) forward protrusion of the distal vagina (6/10), (4) perineal descent (5/10), and (5) distal widening in the lower third of the vagina (3/10). Increased folding (kneeling) of the vagina and an overall downward displacement are consistently present in rectocele. Forward protrusion, perineal descent, and distal widening are sometimes seen as well. Funding:
|
Talairach Methodology in the Multimodal Imaging and Robotics Era
|
Publication: Book Chapter in: Jean-Marie Scarabin Ed. Stereotaxy and Epilepsy Surgery. John Libbey Eurotext LTD. 2012 Sep; p.245-72. ISBN-10: 2742007679. PDF Authors: Cardinale F, Miserocchi A, Moscato A, Cossu M, Castana L, Schiariti M P, Gozzo F, Pero G, Quilici L, Citterio A, Minella M, Torresin A, Lo Russo G. Institution: Centro Claudio Munari per la Chirurgica dell' Epilessia e del Parkinson, Ospedale Niguarda Ca' Grande, Milan, Italy. Background/Purpose: The original Talairach methodology was based on three main features. Neuroimaging techniques to collect patient-specific brain anatomical data, a probabilistic morpho-functional atlas and surgical tools developed to implant intracerebral electrodes in accurate and safe conditions. Brain anatomy was obtained indirectly by means of cerebral angiography and ventriculography. Both techniques were performed in stereotactic (coordinate system), telemetric (reduced magnification and distortion) and stereoscopic (pseudo-3D effect) conditions. The following step was to normalize patient’s specific data to the atlas space using the bicommissural coordinate system. The normalization to the atlas was fundamental in order to integrate the images with structural (gyri and sulci), cytoarchitectural (Brodmann areas) and functional (electrical stimulations) data. Then, in order to position the guiding screws along the pre-planned trajectory, a double grid was attached onto the frame, allowing drilling in the orthogonal direction. Nowadays modern technological tools facilitate the workflow, but the main concepts of this methodology are still valid. We use algorithms completely automated with software applications to expand the multimodal integration of data so that MRI, rotational angiography, fMRI and DTI-FT data can all be coregistered together. It is now possible to obtain real 3D viewing by multi-planar reconstructions (MPR), volume and surface rendering. The tool holder for the surgical implantation is now fixed onto the passive robotic arm of the stereotactic imageguided system Renishaw neuromate®, so that the number of possible trajectories is no more discrete (as using the double grid), but virtually infinite with any desired obliquity. The aim of this chapter is to describe our present workflow. We will underline the methodological continuity with basic Talairach and Bancaud principles, highlighting how modern tools can help in saving time and improve safety, accuracy and the amount of information. Moreover, we report our quantitative results regarding geometrical accuracy at the cortical entry point with this new methodology. |
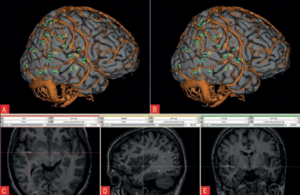 3D Slicer scene with MPR and 3D views (crossedviewing)During long-term Video-SEEGmonitoring, for several daysfollowing implantation, it isimportant to have intuitive andaccurate mapping tools for localizing the sources of the signal. In order to reach this aim, we integrate all the information in 3D Slicer, a package able to load all data. It is in fact possible to import all datasets and surface models computed by FreeSurfer (white and gray matter, with parcellations and labels). Moreover, it is possible to create other models such as the vascular tree and the electrodes leads. This is done very simply with the Gray Scale Model Maker tool. 3D Slicer is installed on all team members’ computers, so that epileptologists are able to look at these scenes when interpreting the SEEG traces. (A and B) constitute a pair of stereoscopic images with the reconstruction of pial surface, vessels and labeled electrodes. (C, D and E) are the MPR views, with the visualization fading 50% for MRI and 50% forpost-implant O-arm dataset. The crosshair indicates thesecond lead of an electrode exploring first temporal gyrus,temporal transverse gyri and insular long gyri. |
SARRP Dose Planning System
|
Company: Xstrahl Ltd., Camberley, UK. Background: The SARRP dose planning system (DPS) is a dedicated in vivo treatment planning system designed to calculate dose distributions in pre-clinical radiation studies. The SARRP DPS is specifically validated for use with in vivo—uniquely enabling the user to treat very precise areas of the animal by defining the area and visualizing the dose and as a result, enabling a more accurate experiment and final result. More... |
Three-dimensional Image Quantification as a New Morphometry Method for Microvascular Tissue Engineering
|
Publication: Tissue Eng Part C Methods. 2012 Jul;18(7):507-16. PMID: 22224751 | PDF Authors: Rytlewski JA, Geuss LR, Anyaeji CI, Lewis EW, Suggs L. Institution: University of Texas at Austin, Biomedical Engineering, Austin, TX, USA. Background/Purpose: Morphological analysis is an essential step in verifying the success of a tissue engineering strategy where researchers must determine the presence of a desired cellular phenotype. While morphometry has transitioned from observational grading to computational quantification, established quantitative methods eliminate information by relying on two-dimensional (2D) analysis to describe three-dimensional (3D) niches. In this study, we demonstrate the validity and utility of 3D morphological quantification using two common angiogenesis assays in our fibrin-based in vitro model: (1) the microcarrier bead assay with human mesenchymal stem cells and (2) the rat aortic ring outgrowth assay. The quantification method is based on collecting and segmenting fluorescent confocal z-stacks into 3D models with 3D Slicer, an open-source MRI/CT analysis program. Data from 3D models are then processed into biologically relevant metrics in MATLAB for statistical analysis. Metrics include descriptive parameters such as vascular network length, volume, number of network segments, and degree of network branching. Our results indicate that 2D measures are significantly different than their 3D counterparts unless the vascular network exhibits anisotropic growth along the plane of imaging. Additionally, the statistical outcomes of 3D morphological quantification agreed with our initial qualitative observations among different test groups. This novel quantification approach generates more spatially accurate and objective measures, representing an important step towards improving the reliability of morphological comparisons. |
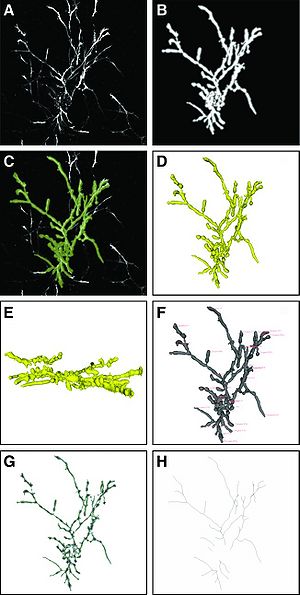 Image processing steps in three-dimensional 3D Slicer's Vascular Modeling Toolkit. Sample shown is from the 10 mg/mL PEGylated fibrin group. (A) Z-projection of the original confocal volume using standard deviation of pixel values; (B) Z-projection of the enhanced confocal volume after applying Frangi's vesselness; (C) image from (A) with overlay of segmented 3D model in green; (D, E) evolved model from (C) shown in the XY- and YZ-planes, respectively; (F) evolved model with source and target fiducial placement; (G) Voronoi diagram of evolved model; (H) centerlines skeleton extracted from (G). |
Prostate: Registration of Digital Histopathologic Images to in Vivo MR Images Acquired by Using Endorectal Receive Coil
|
Publication: Radiology. 2012 Jun;263(3):856-64. PMID: 22474671 | PDF Authors: Ward AD, Crukley C, McKenzie CA, Montreuil J, Gibson E, Romagnoli C, Gomez JA, Moussa M, Chin J, Bauman G, Fenster A. Institution: Imaging Research Laboratories, Robarts Research Institute, Schulich School of Medicine and Dentistry, University of Western Ontario, London, ON, Canada. Background/Purpose: To develop and evaluate a technique for the registration of in vivo prostate magnetic resonance (MR) images to digital histopathologic images by using image-guided specimen slicing based on strand-shaped fiducial markers relating specimen imaging to histopathologic examination.The study was approved by the institutional review board (University of Western Ontario Health Sciences Research Ethics Board, London, Ontario, Canada), and written informed consent was obtained from all patients. This work proposed and evaluated a technique utilizing developed fiducial markers and real-time three-dimensional visualization in support of image guidance for ex vivo prostate specimen slicing parallel to the MR imaging planes prior to digitization, simplifying the registration process. The registration was performed interactively by using 3D Slicer (Surgical Planning Laboratory, Harvard Medical School, Boston, MA). Means, standard deviations, root-mean-square errors, and 95% confidence intervals are reported for all evaluated measurements. The slicing error was within the 2.2 mm thickness of the diagnostic-quality MR imaging sections, with a tissue block thickness standard deviation of 0.2 mm. Rigid registration provided negligible postregistration overlap of the smallest clinically important tumors (0.2 cm3) at histologic examination and MR imaging, whereas the tested nonrigid registration method yielded a mean target registration error of 1.1 mm and provided useful coregistration of such tumors. This method for the registration of prostate digital histo-pathologic images to in vivo MR images acquired by using an endorectal receive coil was sufficiently accurate for coregistering the smallest clinically important lesions with 95% confidence. |
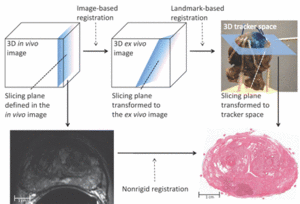 Image-guided specimen slicing process. The first step is to select a desired slicing plane orientation and location from the 3D in vivo image. By using image-based registration, this plane is transformed to the space of the ex vivo specimen image. Corresponding fiducial markers are localized on the ex vivo image (by using software) and on the physical specimen (by using a tracked stylus), and a landmark transform aligning these fiducial markers transforms the slicing plane into the space of the tracker. The tracked stylus is used to direct the insertion of three slicing plane–defining pins into the specimen, which align the specimen in a slotted forceps for slicing. This permits the establishment of a correspondence between stained histologic slices and in vivo imaging planes, which are registered by using a nonrigid registration. |
A Comparison of the Effect of Age on Levator Ani and Obturator Internus Muscle Cross-sectional Areas and Volumes in Nulliparous Women
|
Publication: Neurourol Urodyn. 2012 Apr;31(4):481-6. PMID: 22378544 | PDF Authors: Morris VC, Murray MP, Delancey JO, Ashton-Miller JA. Institution: University College London Hospital, London, UK. Background/Purpose: Functional tests have demonstrated minimal loss of vaginal closure force with age. So we tested the null hypotheses that age neither affects the maximum cross-sectional area (CSA) nor the volume of the levator muscle. Corresponding hypotheses were also tested in the adjacent obturator internus muscle, which served as a control for the effect of age on appendicular muscle in these women. Magnetic resonance images of 15 healthy younger (aged 21-25 years) and 12 healthy older nulliparous women (aged >63 years) were selected to avoid the confounding effect of childbirth. Models were created from tracing outlines of the levator ani muscle in the coronal plane, and obturator internus in the axial plane using 3D Slicer v.3.4. Muscle volumes were calculated using 3D Slicer, while CSA was measured using Imageware™ at nine locations. The hypotheses were tested using repeated measures analysis of variance with P < 0.05 being considered significant. The effect of age did not reach statistical significance for the decrease in levator ani muscle maximum CSA or the decrease in volume (4.3%, P = 0.62 and 10.9%, 0.12, respectively). However, age did significantly adversely decrease obturator internus muscle maximum CSA and volume (24.5% and 28.2%, P < 0.001, respectively). Significant local age-related changes were observed dorsally in both muscles. Unlike the adjacent appendicular muscle, obturator internus, the levator ani muscle in healthy nullipara does not show evidence of significant age-related atrophy. Funding:
|
|
Publication: IEEE Trans Med Imaging. 2012 Apr;31(4):963-76. PMID: 22113772 Authors: Mirota DJ, Wang H, Taylor RH, Ishii M, Gallia GL, Hager GD. Institution: Department of Computer Science, Johns Hopkins University, Baltimore, MD, USA. Background/Purpose: Surgeries of the skull base require accuracy to safely navigate the critical anatomy. This is particularly the case for endoscopic endonasal skull base surgery (ESBS) where the surgeons work within millimeters of neurovascular structures at the skull base. Today’s navigation systems provide approximately 2 mm accuracy. Accuracy is limited by the indirect relationship of the navigation system, the image and the patient. We propose a method to directly track the position of the endoscope using video data acquired from the endoscope camera. Our method first tracks image feature points in the video and reconstructs the image feature points to produce three-dimensional (3D) points, and then registers the reconstructed point cloud to a surface segmented from pre-operative computed tomography (CT) data. After the initial registration, the system tracks image features and maintains the two-dimensional (2D)-3D correspondence of imagefeatures and 3D locations. These data are then used to update the current camera pose. We present a method for validation of our system, which achieves sub-millimeter (0.70 mm mean) target registration error (TRE) results. Funding:
|
Levator Ani Subtended Volume: A Novel Parameter to Evaluate Levator Ani Muscle Laxity in Pelvic Organ Prolapse
|
Publication: Am J Obstet Gynecol. 2012 Mar;206(3):244.e1-9. PMID: 22075059 | PDF Authors: Rodrigues AA Jr, Bassaly R, McCullough M, Terwilliger HL, Hart S, Downes K, Hoyte L. Institution: Division of Female Pelvic Medicine and Reconstructive Surgery, Department of Obstetrics and Gynecology, University of South Florida College of Medicine, Tampa, FL. Background/Purpose: We describe a new parameter based on magnetic resonance 3-dimensional (3D) reconstructions proposed to evaluate levator ani muscle (LAM) laxity in women with pelvic organ prolapse (POP). This is an institutional review board-approved, retrospective chart review of 35 women with POP, stages I-IV. The 3D Slicer software package was used to perform 2-dimensional and 3D measurements and the levator ani subtended volume (LASV) was described. Basically, the LASV represents the volume contained by LAM between 2 planes, which coincides with pubococcygeal line and H line. Correlations among measurements, ordinal POP stages, POP Quantification (POPQ) individual measurements, and validated questionnaires were performed. The LASV differentiated major (III and IV) from minor (I and II) POPQ stages, which positively correlated to POP stages and POPQ individual measurements. The LASV is a promising parameter to evaluate the LAM laxity. |
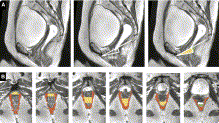 Two sequences showing segmentation processA, Midsagittal views of pelvic floor; representations of pubococcygeal line (PCL), H line, and M line (white); and anterior (yellow) and posterior (green) limits of levator hiatus volume. B, Levator ani muscle (LAM) and levator hiatus segmentation following caudal-cranial orientation. Levator hiatus was segmented based on previous limits obtained from midsagittal slice and inner boundaries of LAM, obturator internus muscle, and pubic bone.Rodrigues. A new parameter proposed to evaluate the levator ani laxity. |
Tractography Delineates Microstructural Changes in the Trigeminal Nerve After Focal Radiosurgery for Trigeminal Neuralgia
|
Publication: PLoS One. 2012 Mar;7(3):e32745. PMID:22412918 | PDF Authors: Hodaie M, Chen DQ, Quan J, Laperriere N. Institution: Division of Neurosurgery, Toronto Western Hospital and University of Toronto, Toronto, ON, Canada. Background/Purpose: Focal radiosurgery is a common treatment modality for trigeminal neuralgia (TN), a neuropathic facial pain condition. Assessment of treatment effectiveness is primarily clinical, given the paucity of investigational tools to assess trigeminal nerve changes. Since diffusion tensor imaging (DTI) provides information on white matter microstructure, we explored the feasibility of trigeminal nerve tractography and assessment of DTI parameters to study microstructural changes after treatment. We hypothesized that trigeminal tractography provides more information than 2D-MR imaging, allowing detection of unique, focal changes in the target area after radiosurgery. Changes in specific diffusivities may provide insight into the mechanism of action of radiosurgery on the trigeminal nerve. Funding: |
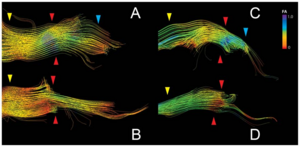 Tractography outlines detailed FA changes in the trigeminal nerve after GKRS treatment. Panels A-D depict the trigeminal nerve tracts pre and post-treatment for subjects S1(A,B) and S2 (C,D). The area between the yellow and blue arrows delineates the cisternal segment, with the yellow arrow being proximal to the brainstem and the blue arrow distal. The red arrow denotes the target area, which corresponds to the region where the greatest change in FA was observed. In S1, FA change affects primarily the outlying fibers of the nerve, while for S2, FA changes are seen in the inferior portion of the cisternal segment of the trigeminal nerve. Tractography were performed using the 3D Slicer software. |
Square-cut: A Segmentation Algorithm on the Basis of a Rectangle Shape
|
Publication: PLoS One. 2012 Feb;7(2):e31064. PMID: 22363547 | PDF Authors: Egger J, Kapur T, Dukatz T, Kolodziej M, Zukić D, Freisleben B, Nimsky C. Institution: Surgical Planning Laboratory, Department of Radiology, Brigham and Women's Hospital, Harvard Medical School, Boston, MA, USA. Background/Purpose: We present a rectangle-based segmentation algorithm that sets up a graph and performs a graph cut to separate an object from the background. However, graph-based algorithms distribute the graph's nodes uniformly and equidistantly on the image. Then, a smoothness term is added to force the cut to prefer a particular shape. This strategy does not allow the cut to prefer a certain structure, especially when areas of the object are indistinguishable from the background. We solve this problem by referring to a rectangle shape of the object when sampling the graph nodes, i.e., the nodes are distributed non-uniformly and non-equidistantly on the image. This strategy can be useful, when areas of the object are indistinguishable from the background. For evaluation, we focus on vertebrae images from Magnetic Resonance Imaging (MRI) datasets to support the time consuming manual slice-by-slice segmentation performed by physicians. The ground truth of the vertebrae boundaries were manually extracted by two clinical experts (neurological surgeons) with several years of experience in spine surgery and afterwards compared with the automatic segmentation results of the proposed scheme yielding an average Dice Similarity Coefficient (DSC) of 90.97±2.2%. Funding:
|
Anatomical and Functional Correlates of Human Hippocampal Volume Asymmetry
|
Publication: Psychiatry Res. 2012 Jan; 201(1): 48-53. PMID: 22285719 | PDF Authors: Woolard AA, Heckers S. Institution: Department of Osychiatry, Vaderbilt University, Nashville, TN, USA. Background/Purpose: Hemispheric asymmetry of the human hippocampus is well established, but poorly understood. We studied 110 healthy subjects with 3-Tesla MRI to explore the anatomical and functional correlates of the R>L volume asymmetry. We found that the asymmetry is limited to the anterior hippocampus (hemisphere×region interaction: F(1,109)=42.6, p<.001). Anterior hippocampal volume was correlated strongly with the volumes of all four cortical lobes. In contrast, posterior hippocampal volume was correlated strongly only with occipital lobe volume, moderately with the parietal and temporal lobe volumes and not with the frontal lobe volume. The degree of R>L anterior hippocampal volume asymmetry predicted performance on a measure of basic cognitive abilities. This provides evidence for regional specificity and functional implications of the well-known hemispheric asymmetry of hippocampal volume. We suggest that the developmental profile, genetic mechanisms and functional implications of R>L anterior hippocampal volume asymmetry in the human brain deserve further study. Funding:
|
Hippocampal Subregions are Differentially Affected in the Progression to Alzheimer's Disease
|
Publication: Anat Rec (Hoboken). 2012 Jan;295(1):132-40. PMID: 22095921 | PDF Authors: Greene SJ, Killiany RJ; Alzheimer's Disease Neuroimaging Initiative Institution: Department of Anatomy and Neurobiology, University of Vermont College of Medicine, Burlington, VT, USA. Background/Purpose: Atrophy within the hippocampus (HP) as measured by magnetic resonance imaging (MRI) is a promising biomarker for the progression to Alzheimer's disease (AD). Subregions of the HP along the longitudinal axis have been found to demonstrate unique function, as well as undergo differential changes in the progression to AD. Little is known of relationships between such HP subregions and other potential biomarkers, such as neuropsychological (NP), genetic, and cerebral spinal fluid (CSF) beta amyloid and tau measures. The purpose of this study was to subdivide the hippocampus to determine how the head, body, and tail were affected in normal control, mild cognitively impaired, and AD subjects, and investigate relationships with HP subregions and other potential biomarkers. MRI scans of 120 participants of the Alzheimer's Disease Neuroimaging Initiative were processed using FreeSurfer, and the HP was subdivided using 3D Slicer. Each subregion was compared among groups, and correlations were used to determine relationships with NP, genetic, and CSF measures. Results suggest that HP subregions are undergoing differential atrophy in AD, and demonstrate unique relationships with NP and CSF data. Discriminant function analyses revealed that these regions, when combined with NP and CSF measures, were able to classify by diagnostic group, and classify MCI subjects who would and would not progress to AD within 12 months. Funding:
|
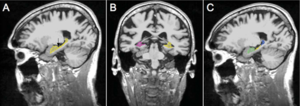 Methods for identifying boundaries for the head, body, and tail of the hippocampus. A: Arrow is pointing to the head/body boundary. B: View of body/tail boundary in left hemisphere where the fimbria of the fornix comes into view; body/tail boundary. C: Subregions after relabeling has been completed (green: head; yellow: body; blue: tail). |
Long-term Memory Search Across the Visual Brain
|
Publication: Neural Plast. 2012;2012:392695. PMID: 22900206 | PDF Authors: Fedurco M. Institution: Michelin Recherche Technique, Fribourg, Switzerland. Background/Purpose: Signal transmission from the human retina to visual cortex and connectivity of visual brain areas are relatively well understood. How specific visual perceptions transform into corresponding long-term memories remains unknown. Here, I will review recent Blood Oxygenation Level-Dependent functional Magnetic Resonance Imaging (BOLD fMRI) in humans together with molecular biology studies (animal models) aiming to understand how the retinal image gets transformed into so-called visual (retinotropic) maps. The broken object paradigm has been chosen in order to illustrate the complexity of multisensory perception of simple objects subject to visual - rather than semantic - type of memory encoding. The author explores how amygdala projections to the visual cortex affect the memory formation and proposes the choice of experimental techniques needed to explain our massive visual memory capacity. Maintenance of the visual long-term memories is suggested to require recycling of GluR2-containing α-amino-3-hydroxy-5-methyl-4-isoxazolepropionic acid receptors (AMPAR) and β(2)-adrenoreceptors at the postsynaptic membrane, which critically depends on the catalytic activity of the N-ethylmaleimide-sensitive factor (NSF) and protein kinase PKMζ. |
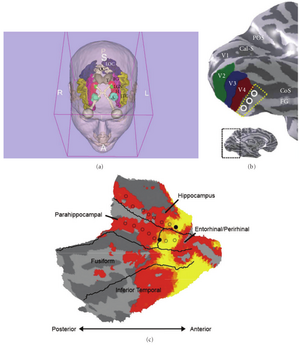 Parcellation of the human visual cortex and brain areas involved in visual object perception: (a) eye bulb—grey, optical tract/optical chiasm—white, lateral geniculate nucleus (LGN)—green, occipital visual cortex (OC)—white, lateral occipital gyrus (LOC)—navy blue, inferior temporal gyrus (ITC)—creamy yellow, fusiform gyrus (FG)—magenta, hippocampus (H)—red, amygdala (A)—cyan, thalamus (T)—grey (created using the 3D Slicer). (b) Ventral occipital visual field map models: Cal-S (V1)—calcarine sulcus, V2—green, V3—blue, V4 (brick red), FG—fusiform gyrus, CoS—collateral sulcus, POS—parietal occipital sulcus. The dotted yellow line and white circles denote the region of cortex in which the V4 and V8 models diverge (inset shows inflated model of the left human hemisphere). (c) Anterior part of the fusiform gyrus is located in the vicinity of the hippocampal formation. (b) reproduced, with permission, from [25] Macmillan Publishers Ltd. (c) (right) reproduced, with permission, from [39] the American Physiological Society. |
Temporal Course of Cerebrospinal Fluid Dynamics and Amyloid Accumulation in the Aging Rat Brain from Three to Thirty Months
|
Publication: Fluids Barriers CNS. 2012 Jan 23;9(1):3. PMID: 22269091 | PDF Authors: Chiu C, Miller MC, Caralopoulos IN, Worden MS, Brinker T, Gordon ZN, Johanson CE, Silverberg GD. Institution: Department of Neurosurgery, Warren Alpert Medical School, Brown University and Aldrich Neurosurgery Research Laboratories, Rhode Island Hospital, Providence, RI, USA. Background/Purpose: Amyloid accumulation in the brain parenchyma is a hallmark of Alzheimer's disease (AD) and is seen in normal aging. Alterations in cerebrospinal fluid (CSF) dynamics are also associated with normal aging and AD. This study analyzed CSF volume, production and turnover rate in relation to amyloid-beta peptide (Aβ) accumulation in the aging rat brain. Aging Fischer 344/Brown-Norway hybrid rats at 3, 12, 20, and 30 months were studied. CSF production was measured by ventriculo-cisternal perfusion with blue dextran in artificial CSF; CSF volume by MRI; and CSF turnover rate by dividing the CSF production rate by the volume of the CSF space. Aβ40 and Aβ42 concentrations in the cortex and hippocampus were measured by ELISA. There was a significant linear increase in total cranial CSF volume with age: 3-20 months (p < 0.01); 3-30 months (p < 0.001). CSF production rate increased from 3-12 months (p < 0.01) and decreased from 12-30 months (p < 0.05). CSF turnover showed an initial increase from 3 months (9.40 day-1) to 12 months (11.30 day-1) and then a decrease to 20 months (10.23 day-1) and 30 months (6.62 day-1). Aβ40 and Aβ42 concentrations in brain increased from 3-30 months (p < 0.001). Both Aβ42 and Aβ40 concentrations approached a steady state level by 30 months. In young rats there is no correlation between CSF turnover and Aβ brain concentrations. After 12 months, CSF turnover decreases as brain Aβ continues to accumulate. This decrease in CSF turnover rate may be one of several clearance pathway alterations that influence age-related accumulation of brain amyloid. Funding:
|
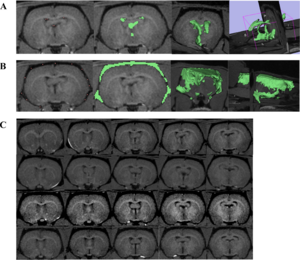 Total CSF volume. A) CSF in the ventricles was measured by placing fiducial points (pink dots) on black pixels within the region of interest. FastMarching Segmentation in 3D Slicer generates a rough sketch of the region of interest (green areas), as well as a 3D model. Volume is calculated from this model. B) Similar steps were taken to measure CSF in the subarachnoid space. All measurements were done by one reader for consistency. C) T1-weighted MR images. Each row represents five coronal slices from one rat brain (top row = 3 month, second row = 12 month, third row = 20 month, bottom row = 30 month). Images were magnified and brightened for printing purposes. |
Intact Relational Memory and Normal Hippocampal Structure in the Early Stage of Psychosis
|
Publication: Biol Psychiatry. 2012 Jan 15;71(2):105-13. PMID: 22055016 | PDF Authors: Williams LE, Avery SN, Woolard AA, Heckers S. Institution: Department of Psychiatry, Vanderbilt University, Nashville, TN, USA. Background/Purpose: Previous studies indicate that the transition to psychosis is associated with dynamic changes of hippocampal integrity. Here we explored hippocampal volume and neural activation during a relational memory task in patients who were in the early stage of a psychotic illness. Forty-one early psychosis patients and 34 healthy control subjects completed a transitive inference (TI) task used previously in chronic schizophrenia patients. Participants learned to select the "winner" of two sets of stimulus pairs drawn from an overlapping sequence (A > B > C > D > E) and a nonoverlapping set (a > b, c > d, e > f, g > h). During a functional magnetic resonance imaging scan, participants were tested on the trained pairs and made inferential judgments on novel pairings that could be solved based on training (e.g., B vs. D). Hippocampal volumes were manually segmented and compared between groups. Functional magnetic resonance imaging analyses included 27 early psychosis patients and 30 control subjects who met memory training criteria. Groups did not differ on inference performance or hippocampal volume and exhibited similar activation of medial temporal regions when judging nonoverlapping pairs. However, patients who failed to meet memory training criteria had smaller hippocampal volumes. Neural activity during TI was less widespread in early psychosis patients, but between-group differences were not significant. Hippocampal activity during TI was positively correlated with inference performance only in control subjects. Our results provide evidence that relational memory impairment and hippocampal abnormalities, well established in chronic schizophrenia, are not fully present in early psychosis patients. This provides a rationale for early intervention, targeting the possible delay, reduction, or prevention of these deficits. Funding:
|
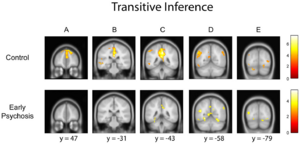 Significant clusters of activation during transitive inference, p < .05 corrected cluster threshold: bilateral medial and superior frontal gyri (A control), bilateral cingulate (B, C, D controls, C early psychosis), middle temporal gyrus (left B, C, D control, bilateral D, E early psychosis), left superior temporal gyrus (B control), left paracentral lobule (B control), bilateral angular gyrus (D control), bilateral precuneus (D early psychosis), bilateral middle/inferior occipital gyrus (E control), and bilateral cerebellum (D, E). A direct comparison between groups revealed no significant differences. |
TREK: An Integrated System Architecture for Intraoperative Cone-beam CT-guided Surgery
|
Publication: Int J Comput Assist Radiol Surg. 2012 Jan;7(1):159-73. PMID: 21744085 Authors: Uneri A, Schafer S, Mirota DJ, Nithiananthan S, Otake Y, Taylor RH, Siewerdsen JH. Institution: Department of Computer Science, Johns Hopkins University, Baltimore, MD, USA. Background/Purpose: A system architecture has been developed for integration of intraoperative 3D imaging [viz., mobile C-arm cone-beam CT (CBCT)] with surgical navigation (e.g., trackers, endoscopy, and preoperative image and planning data). The goal of this paper is to describe the architecture and its handling of a broad variety of data sources in modular tool development for streamlined use of CBCT guidance in application-specific surgical scenarios. Methods: The architecture builds on two proven open-source software packages, namely the cisst package (Johns Hopkins University, Baltimore, MD) and 3D Slicer (Brigham and Women's Hospital, Boston, MA), and combines data sources common to image-guided procedures with intraoperative 3D imaging. Integration at the software component level is achieved through language bindings to a scripting language (Python) and an object-oriented approach to abstract and simplify the use of devices with varying characteristics. The platform aims to minimize offline data processing and to expose quantitative tools that analyze and communicate factors of geometric precision online. Modular tools are defined to accomplish specific surgical tasks, demonstrated in three clinical scenarios (temporal bone, skull base, and spine surgery) that involve a progressively increased level of complexity in toolset requirements. The resulting architecture (referred to as "TREK") hosts a collection of modules developed according to application-specific surgical tasks, emphasizing streamlined integration with intraoperative CBCT. These include multi-modality image display; 3D-3D rigid and deformable registration to bring preoperative image and planning data to the most up-to-date CBCT; 3D-2D registration of planning and image data to real-time fluoroscopy; infrared, electromagnetic, and video-based trackers used individually or in hybrid arrangements; augmented overlay of image and planning data in endoscopic or in-room video; and real-time "virtual fluoroscopy" computed from GPU-accelerated digitally reconstructed radiographs (DRRs). Application in three preclinical scenarios (temporal bone, skull base, and spine surgery) demonstrates the utility of the modular, task-specific approach in progressively complex tasks. The design and development of a system architecture for image-guided surgery has been reported, demonstrating enhanced utilization of intraoperative CBCT in surgical applications with vastly different requirements. The system integrates C-arm CBCT with a broad variety of data sources in a modular fashion that streamlines the interface to application-specific tools, accommodates distinct workflow scenarios, and accelerates testing and translation of novel toolsets to clinical use. The modular architecture was shown to adapt to and satisfy the requirements of distinct surgical scenarios from a common code-base, leveraging software components arising from over a decade of effort within the imaging and computer-assisted interventions community. Funding:
|
Cholesterol Increases Ventricular Volume in a Rabbit Model of Alzheimer's Disease
|
Publication: J Alzheimers Dis. 2012;29(2):283-92. PMID: 22232012 | PDF Authors: Deci S, Lemieux SK, Smith-Bell CA, Sparks DL, Schreurs BG. Institution: Department of Physiology and Pharmacology and the Blanchette Rockefeller Neurosciences Institute, West Virginia University, Morgantown, WV, USA. Background/Purpose: One of the hallmarks of Alzheimer's disease is a significant increase in ventricular volume. To date we and others have shown that a cholesterol-fed rabbit model of Alzheimer's disease displays as many as fourteen different pathological markers of Alzheimer's disease including amyloid-β accumulation, thioflavin-S staining, blood brain barrier breach, microglia activation, cerebrovasculature changes, and alterations in learning and memory. Using structural magnetic resonance imaging at 3T, we now report that cholesterol-fed rabbits also show a significant increase in ventricular volume following 10 weeks on a diet of 2% cholesterol. The increase in volume is attributable in large part to increases in the size of the third ventricle. These changes are accompanied by significant increases in the number of amyloid-β immuno-positive cells in the cortex and hippocampus. Increases in the number of amyloid-β neurons in the cortex also occurred with the addition of 0.24 ppm copper to the drinking water. Together with a list of other pathological markers, the current results add further validity to the value of the cholesterol-fed rabbit as a non-transgenic animal model of Alzheimer's disease. Funding:
|
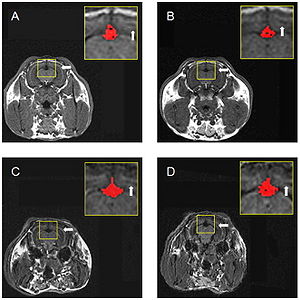 Panels show analysis of ventricular volume in a sample MRI axial scan for a rabbit that received chow and distilled water (A), chow and 0.24 ppm copper in distilled water (B), chow plus 2% cholesterol and distilled water (C), or chow with 2% cholesterol and 0.24 ppm copper in distilled water (D). The inset of each panel shows the third ventricle selected using the intensity-based threshold painting method. The white arrows indicate the barely detectable lateral ventricle. |
2011
Atlas-guided Segmentation of Vervet Monkey Brain MRI
|
Publication: Open Neuroimag J. 2011 Dec;5:186-97. PMID: 22253661 | PDF Authors: Fedorov A, Li X, Pohl KM, Bouix S, Styner M, Addicott M, Wyatt C, Daunais JB, Wells WM, Kikinis R. Institution: Surgical Planning Laboratory, Brigham and Women's Hospital, Harvard Medical School, Boston, MA, USA. Background/Purpose: User interaction is required for reliable segmentation of brain tumors in clinical practice and in clinical research. By incorporating current research tools, 3D Slicer provides a set of interactive, easy to use tools that can be efficiently used for this purpose. One of the modules of 3D Slicer is an interactive editor tool, which contains a variety of interactive segmentation effects. Use of these effects for fast and reproducible segmentation of a single glioblastoma from magnetic resonance imaging data is demonstrated. The innovation in this work lies not in the algorithm, but in the accessibility of the algorithm because of its integration into a software platform that is practical for research in a clinical setting. Funding:
|
Comparison of Acute and Chronic Traumatic Brain Injury Using Semi-automatic Multimodal Segmentation of MR Volumes
|
Publication: J Neurotrauma. 2011 Nov;28(11):2287-306. PMID: 21787171 | DF Authors: Irimia A, Chambers MC, Alger JR, Filippou M, Prastawa MW, Wang B, Hovda DA, Gerig G, Toga AW, Kikinis R, Vespa PM, Van Horn JD. Institution: Laboratory of Neuro Imaging, University of California, Los Angeles, CA, USA. Background/Purpose: Though neuroimaging is essential for prompt and proper management of TBI, there is regrettable and acute lack of robust methods for the visualization and assessment of TBI pathophysiology, especially for of the purpose of improving clinical outcome metrics. Until now, the application of automatic segmentation algorithms to TBI in a clinical setting has remained an elusive goal because existing methods have, for the most part, been insufficiently robust to faithfully capture TBI-related changes in brain anatomy. This article introduces and illustrates the combined use of multimodal TBI segmentation and time point comparison using 3D Slicer, a widely-used software environment whose TBI data processing solutions are openly available. For three representative TBI cases, semi-automatic tissue classification and 3D model generation are performed to perform intra-patient time point comparison of TBI using multimodal volumetrics and clinical atrophy measures. Identification and quantitative assessment of extra- and intra-cortical bleeding, lesions, edema and diffuse axonal injury are demonstrated. The proposed tools allow cross-correlation of multimodal metrics from structural imaging (structural volume, atrophy measurements, etc.) with clinical outcome variables and other potential factors predictive of recovery. In addition, the workflows described are suitable for TBI clinical practice and patient monitoring, particularly for assessing damage extent and for the measurement of neuroanatomical change over time. With knowledge of general location, extent, and degree of change, such metrics can be associated with clinical measures and subsequently used to suggest viable treatment options. Funding:
|
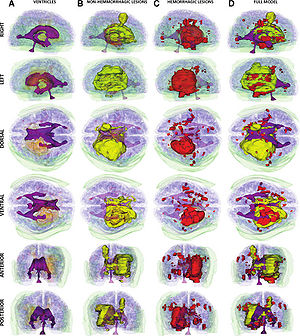 Three-dimensional models of TBI anatomy for Patient 1 (acute baseline time point), as generated in 3D Slicer. Each row displays one of six canonical views of the brain, whereas each column corresponds to a structure type (ventricles, non-hemorrhagic lesions, hemorrhagic lesions, and full model). In (A), ventricles are shown as opaque, whereas extracerebral injuries, gray matter (GM) and white matter (WM) volumes are shown as transparent to facilitate visualization of each structure in relationship to cortical landmarks. In (B–D), ventricles are also shown as transparent for similar reasons. Arrows indicate TBI-related pathology of interest (see text for elaboration). |
3D Slicer
|
Publication: PDF Video. 2011 November 18. Authors: Muschelli J, Zipunnikov V. Institution: Department of Biostatistics, Johns Hopkins Bloomberg School of Public Health, Baltimore, MD, USA. Background/Purpose: Quick tutorial of how to make 3D models in 3D Slicer. |
An Open Environment CT-US Fusion for Tissue Segmentation During Interventional Guidance
|
Publication: PLoS One. 2011 Novemeber;6(11):e27372. PMID: 22132098 | PDF Authors: Caskey CF, Hlawitschka M, Qin S, Mahakian LM, Cardiff RD, Boone JM, Ferrara KW. Institution: Department of Biomedical Engineering, University of California Davis, Davis, CA, USA. Background/Purpose: Therapeutic ultrasound (US) can be noninvasively focused to activate drugs, ablate tumors and deliver drugs beyond the blood brain barrier. However, well-controlled guidance of US therapy requires fusion with a navigational modality, such as magnetic resonance imaging (MRI) or X-ray computed tomography (CT). Here, we developed and validated tissue characterization using a fusion between US and CT. The performance of the CT/US fusion was quantified by the calibration error, target registration error and fiducial registration error. Met-1 tumors in the fat pads of 12 female FVB mice provided a model of developing breast cancer with which to evaluate CT-based tissue segmentation. Hounsfield units (HU) within the tumor and surrounding fat pad were quantified, validated with histology and segmented for parametric analysis (fat: −300 to 0 HU, protein-rich: 1 to 300 HU, and bone: HU>300). Our open source CT/US fusion system differentiated soft tissue, bone and fat with a spatial accuracy of ~1 mm. Region of interest (ROI) analysis of the tumor and surrounding fat pad using a 1 mm2 ROI resulted in mean HU of 68±44 within the tumor and −97±52 within the fat pad adjacent to the tumor (p<0.005). The tumor area measured by CT and histology was correlated (r2 = 0.92), while the area designated as fat decreased with increasing tumor size (r2 = 0.51). Analysis of CT and histology images of the tumor and surrounding fat pad revealed an average percentage of fat of 65.3% vs. 75.2%, 36.5% vs. 48.4%, and 31.6% vs. 38.5% for tumors <75 mm3, 75-150 mm3 and >150 mm3, respectively. Further, CT mapped bone-soft tissue interfaces near the acoustic beam during real-time imaging. Combined CT/US is a feasible method for guiding interventions by tracking the acoustic focus within a pre-acquired CT image volume and characterizing tissues proximal to and surrounding the acoustic focus. Funding:
|
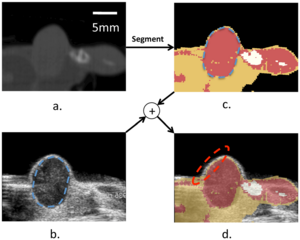 Combined CT/US characterizes tissue. (a) CT slice of a hindlimb tumor corresponding to the US slice in (b). The segmented CT slice is shown in (c) and overlaid on the US image in (d). The combined segmented CT/US image identifies fat proximal to and surrounding the tumor during ultrasonic imaging, with registration accuracy on the order of 1 mm. Nearby bone is obvious in the CT image (c) but not immediately visualized by US (b). |
|
Publication: Brain Behav. 2011 November; 1(2): 125-34. PMID: 22399092 | PDF Authors: Cherbuin N, Sachdev PS, Anstey KJ. Institution: Centre for Mental Health Research, Australian National University, Canberra, Australia. Background/Purpose: Handedness has been found to be associated with structural and functional cerebral differences. Left handedness and mixed handedness also appear to be associated with an elevated risk of some developmental and immunological disorders that may contribute to pathological processes developing in ageing. Inconsistent reports show that left handedness may be more prevalent in early-onset as well as late-onset Alzheimer's disease, but might also be associated with slower decline. Such inconsistencies may be due to handedness being usually modeled as a binary construct while substantial evidence suggests it to be a continuous trait. The aim of this study was to investigate the relationship between brain structures known to be implicated in pathological ageing and strength and direction of handedness. The association between handedness and hippocampal and amygdalar atrophy was investigated in 327 cognitively healthy older individuals. Handedness was measured with the Edinburgh Inventory. Two measures were computed from this index, one reflecting the direction (left = 0/right = 1) and the other the degree of handedness (ranging from 0 to 1). Hippocampal and amygdalar volumes were manually traced on scans acquired 4 years apart. Regression analyses were used to assess the relationship between strength and direction of handedness and incident hippocampal and amygdalar atrophy. Analyses showed that strength but not direction of handedness was a significant predictor of hippocampal (Left: beta = 0.118, P = 0.013; Right: beta = 0.116, P = 0.010) and amygdalar (Right: beta = 0.105, P = 0.040) atrophy. The present findings suggest that mixed but not left handedness is associated with greater hippocampal and amygdalar atrophy. This effect may be due to genetic, environmental, or behavioural differences that will need further investigation in future studies. Funding:
|
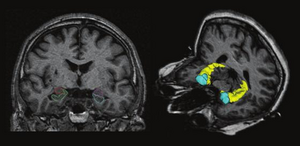 Left: Manual tracings from the analyze package of the left and right hippocampi (green and blue) and of the left and right amygdala (red and purple). Right: 3D model of the hippocampus (yellow) and of the amygdala (blue) rendered in 3D Slicer. |
Multiple Costal Cartilage Graft Reconstruction for the Treatment of a Full-length Laryngotracheal Stenosis after an Inhalation Burn
|
Publication: Interact Cardiovasc Thorac Surg. 2011 Oct;13(4):453-5. PMID: 21798888 | PDF Authors: Furák J, Szakács L, Nagy A, Rovó L. Institution: Department of Oto-Rhino-Laryngology, Head and Neck Surgery, University of Szeged, Szeged, Hungary. Background/Purpose: After suffering an inhalation burn, a 22-year-old male was intubated for seven days. Full-length massive scar formation in the upper airway necessitated tracheostomy five months later. After this, the stenosis became complete in the cricoid region, and a long cannula was needed to maintain the severely damaged middle-distal trachea. After unsuccessful laser dilatation, the more stenotic 3 cm distal tracheal segment was resected, but two months later the stenosis recurred. As resection was ineffective, tracheoplasty was performed via a right-sided thoracotomy; the re-stenotized trachea was incised in length and successfully extended with 5 cm long, oval-shaped rib cartilage. Three months later, the complete cricotracheal stenosis was fixed by combined laryngofissure and cricoid laminotomy with two 6 cm×2.5 cm cartilage pieces sutured into the incisions. The middle portion of the trachea was expanded with a similar graft inserted into the anterior wall below the tracheostomy. The fixing T-tube was removed three months later, and the patient had an adequate airway two years after the last procedure. We conclude that multiple cartilage graft reconstruction can be successful even after the development of an extremely long airway stenosis following inhalation burn injury. |
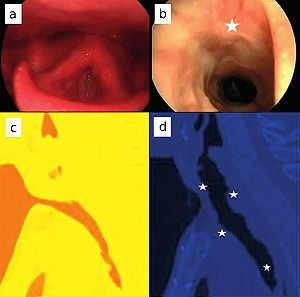 Pre- and postoperative (two years after tracheoplasty) images. (a, b) Endoscopic pictures. (c, d) Median sagittal computed tomography reconstruction (3D Slicer software, Brigham and Women’s Hospital, Harvard Medical School, Boston, MA, USA). Stars show the site of the grafts. |
A Supervised Patch-based Approach for Human Brain Labeling
|
Publication: IEEE Trans Med Imaging. 2011 Oct;30(10):1852-62. PMID: 21606021 | PDF Authors: Rousseau F, Habas PA, Studholme C. Institution: Laboratoire des Sciences de l’Image, de l’Informatique et de la Télédétection (LSIIT), University of Strasbourg, Illkirch, France. Background/Purpose: We propose in this work a patch-based image labeling method relying on a label propagation framework. Based on image intensity similarities between the input image and an anatomy textbook, an original strategy which does not require any nonrigid registration is presented. Following recent developments in nonlocal image denoising, the similarity between images is represented by a weighted graph computed from an intensity-based distance between patches. Experiments on simulated and in vivo magnetic resonance images show that the proposed method is very successful in providing automated human brain labeling. Funding:
|
The Chronic Bronchitic Phenotype of COPD: An Analysis of the COPDGene Study
|
Publication: Chest. 2011 Sep;140(3):626-33. PMID: 21474571 | PDF Authors: Kim V, Han MK, Vance GB, Make BJ, Newell JD, Hokanson JE, Hersh CP, Stinson D, Silverman EK, Criner GJ; COPDGene Investigators. Institution: Temple University School of Medicine, Philadelphia, PA, USA. Background/Purpose: Chronic bronchitis (CB) in patients with COPD is associated with an accelerated lung function decline and an increased risk of respiratory infections. Despite its clinical significance, the chronic bronchitic phenotype in COPD remains poorly defined. We analyzed data from subjects enrolled in the Genetic Epidemiology of COPD (COPDGene) Study. A total of 1,061 subjects with GOLD (Global Initiative for Chronic Obstructive Lung Disease) stage II to IV were divided into two groups: CB (CB+) if subjects noted chronic cough and phlegm production for ≥ 3 mo/y for 2 consecutive years, and no CB (CB-) if they did not. There were 290 and 771 subjects in the CB+ and CB- groups, respectively. Despite similar lung function, the CB+ group was younger (62.8 ± 8.4 vs 64.6 ± 8.4 years, P = .002), smoked more (57 ± 30 vs 52 ± 25 pack-years, P = .006), and had more current smokers (48% vs 27%, P < .0001). A greater percentage of the CB+ group reported nasal and ocular symptoms, wheezing, and nocturnal awakenings secondary to cough and dyspnea. History of exacerbations was higher in the CB+ group (1.21 ± 1.62 vs 0.63 ± 1.12 per patient, P < .027), and more patients in the CB+ group reported a history of severe exacerbations (26.6% vs 20.0%, P = .024). There was no difference in percent emphysema or percent gas trapping, but the CB+ group had a higher mean percent segmental airway wall area (63.2% ± 2.9% vs 62.6% ± 3.1%, P = .013). CB in patients with COPD is associated with worse respiratory symptoms and higher risk of exacerbations. This group may need more directed therapy targeting chronic mucus production and smoking cessation not only to improve symptoms but also to reduce risk, improve quality of life, and improve outcomes. Funding:
|
Airway Inspector: Phenotyping the Lung in COPD
|
Publication: Airway Inspector Contact Person: Raul San Jose Estepar Institution: Surgical Planning Laboratory, Brigham and Women's Hospital, Harvard Medical School, Boston, MA. Background/Purpose: Airway Inspector is a free open source tool for CT-based image quantitative analysis of the lung. It provides the tools that clinical scientist can used to explore airway morphology and desitometric characteristics. Airway Inspector is the gateway to phenotype airway diseases. Airway Inspector is maintained by the Applied Chest Imaging Laboratory (ACIL) and is based on the 3D Slicer. The 3D Slicer is a general purpose open source platform for medical image analysis maintained by the Surgical Planning Laboratory at Brigham and Women's Hospital, Boston, MA. Funding:
|
Distance Measurement in Middle Ear Surgery using a Telemanipulator
|
Publication: Med Image Comput Comput Assist Interv. 2011;14(Pt 1):41-8. PMID: 22003598 | PDF Authors: Maier T, Strauss G, Bauer F, Grasser A, Hata N, Lueth TC. Institution: Institute of Microtechnology and Medical Device Technology (MiMed), Technische Universität München, Munich, Germany. Background/Purpose: In this article, a new tool for the intraoperative measurement of distances within the middle ear by means of a micromanipulator is presented. The purpose of this work was to offer the surgeon a highly accurate tool for measuring the distances between two points in the 3D operational field. The tool can be useful in various operations; this article focuses, however, on measuring the distance between the stapes footplate and the long process of the incus of the middle ear. This distance is important for estimating the proper prosthesis length in stapedotomy for treating otosclerosis. We evaluated the system using a simplified mechanical model. Our results show that the system can measure distances with a maximum error of 0.04 mm. Funding:
|
3D Slicer as a Tool for Interactive Brain Tumor Segmentation
|
Publication: Conf Proc IEEE Eng Med Biol Soc. 2011 Aug;2011:6982-4. PMID: 22255945 | PDF Authors: Kikinis R, Pieper S. Institution: Surgical Planning Laboratory, Brigham and Women's Hospital, Harvard Medical School, Boston, MA, USA. Background/Purpose: User interaction is required for reliable segmentation of brain tumors in clinical practice and in clinical research. By incorporating current research tools, 3D Slicer provides a set of interactive, easy to use tools that can be efficiently used for this purpose. One of the modules of 3D Slicer is an interactive editor tool, which contains a variety of interactive segmentation effects. Use of these effects for fast and reproducible segmentation of a single glioblastoma from magnetic resonance imaging data is demonstrated. The innovation in this work lies not in the algorithm, but in the accessibility of the algorithm because of its integration into a software platform that is practical for research in a clinical setting. Funding:
|
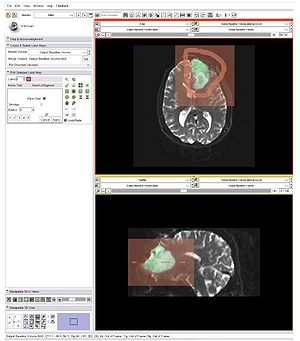 Partial screenshot of 3D Slicer, demonstrating the use of the “GrowCut” effect for segmentation of the solid and cystic components of a brain tumor. Axial and sagittal cross-sections are displayed. The algorithm was initialized on a single slice, but segmented the entire tumor. Initialization is seen in solid colors; segmentation results are displayed as a semi-transparent overlay on the T2 weighted image. Note that two shades of green were used for the solid and cystic components. |
The Effect of Augmented Reality Training on Percutaneous Needle Placement in Spinal Facet Joint Injections
|
Publication: IEEE Trans Biomed Eng. 2011 Jul;58(7):2031-7. PMID: 21435970 | PDF Authors: Yeo CT, Ungi T, U-Thainual P, Lasso A, McGraw RC, Fichtinger G. Institution: School of Medicine, Queen’s University, Kingston, ON, Canada. Background/Purpose: The purpose of this study was to determine if augmented reality image overlay and laser guidance systems can assist learn how to perform the procedure without the risk of errors medical trainees in learning the correct placement of a needle for causing harm to the patient [2]. Additionally, simulation allows percutaneous facet joint injection. The Perk Station training suite was used to conduct and record the needle insertion procedures. A total of 40 volunteers were randomized into two groups of 20. 1) The Overlay group received a training session that consisted of four insertions with image and laser guidance, followed by two insertions with laser overlay only. 2) The Control group received a training session of six classical freehand insertions. Both groups then conducted two freehand insertions. The movement of the needle was tracked during the series of insertions. The final insertion procedure was assessed to determine if there was a benefit to the overlay method compared to the freehand insertions. The Overlay group had a better success rate (83.3% versus 68.4%, p = 0.002), and potential for less tissue damage as measured by the amount of needle movement inside the phantom (3077.6 mm2 versus 5607.9 mm2, p = 0.01). These results suggest that an augmented reality overlay guidance system can assist medical trainees in acquiring technical competence in a percutaneous needle insertion procedure. Funding:
|
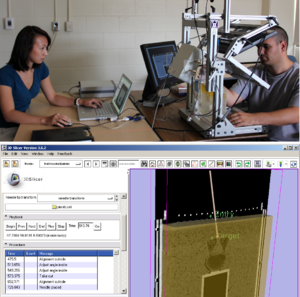 Image overlay simulator for the training of facet joint injections (upper image). 3D Slicer module for offline evaluation of the trainee performance from tracked needle trajectories (lower image). |
Optimal Transseptal Puncture Location for Robot-assisted Left Atrial Catheter Ablation
|
Publication: Int J Med Robot. 2011 Jun;7(2):193-201. PMID: 21538767 | PDF Authors: Jayender J, Patel RV, Michaud GF, Hata N. Institution: Surgical Planning Laboratory, Department of Radiology, Brigham and Women's Hospital, Harvard Medical School, Boston, MA, USA. Background/Purpose: The preferred method of treatment for atrial fibrillation (AF) is by catheter ablation, in which a catheter is guided into the left atrium through a transseptal puncture. However, the transseptal puncture constrains the catheter, thereby limiting its manoeuvrability and increasing the difficulty in reaching various locations in the left atrium. In this paper, we address the problem of choosing the optimal transseptal puncture location for performing cardiac ablation to obtain maximum manoeuvrability of the catheter. We have employed an optimization algorithm to maximize the global isotropy index (GII) to evaluate the optimal transseptal puncture location. As part of this algorithm, a novel kinematic model for the catheter has been developed, based on a continuum robot model. Pre-operative MR/CT images of the heart are segmented using the open source image-guided therapy software, 3D Slicer, to obtain models of the left atrium and septal wall. These models are input to the optimization algorithm to evaluate the optimal transseptal puncture location. Funding:
|
Using KinectTM and a Haptic Interface for Implementation of Real-Time Virtual Fixtures
|
Publication: Proceedings of the 2nd Workshop on RGB-D: Advanced Reasoning with Depth Cameras, June 2011. | PDF Authors: Ryden F, Chizeck HJ, Kosari SN, King H, Hannaford B. Institution: BioRobotics Laboratory, University of Washington, Seattle, WA, USA. Background/Purpose: The use of haptic virtual fixtures is a potential tool to improve the safety of robotic and telerobotic surgery. They can “push back” on the surgeon to prevent unintended surgical tool movements into protected zones. Previous work has suggested generating virtual fixtures from preoperative images like CT scans. However these are difficult to establish and register in dynamic environments. This paper demonstrates automatic generation of real-time haptic virtual fixtures using a low cost Xbox KinectTMdepth camera connected to a virtual environment. This allows generation of virtual fixtures and calculation of haptic forces, which are then passed on to a haptic device. This paper demonstrates that haptic forces can be successfully rendered from real-time environments containing both non-moving and moving objects. This approach has the potential to generate virtual fixtures from the patient in real-time during robotic surgery. Funding:
|
Multiple Indices of Diffusion Identifies White Matter Damage in Mild Cognitive Impairment and Alzheimer's Disease
|
Publication: PLoS One. 2011 Jun;6(6):e21745. PMID: 21738785 | PDF Authors: O'Dwyer L, Lamberton F, Bokde AL, Ewers M, Faluyi YO, Tanner C, Mazoyer B, O'Neill D, Bartley M, Collins DR, Coughlan T, Prvulovic D, Hampel H. Institution: Department of Psychiatry, Psychosomatic Medicine and Psychotherapy, Goethe University, Frankfurt, Germany. Background/Purpose: The study of multiple indices of diffusion, including axial (DA), radial (DR) and mean diffusion (MD), as well as fractional anisotropy (FA), enables WM damage in Alzheimer's disease (AD) to be assessed in detail. Here, tract-based spatial statistics (TBSS) were performed on scans of 40 healthy elders, 19 non-amnestic MCI (MCIna) subjects, 14 amnestic MCI (MCIa) subjects and 9 AD patients. Significantly higher DA was found in MCIna subjects compared to healthy elders in the right posterior cingulum/precuneus. Significantly higher DA was also found in MCIa subjects compared to healthy elders in the left prefrontal cortex, particularly in the forceps minor and uncinate fasciculus. In the MCIa versus MCIna comparison, significantly higher DA was found in large areas of the left prefrontal cortex. For AD patients, the overlap of FA and DR changes and the overlap of FA and MD changes were seen in temporal, parietal and frontal lobes, as well as the corpus callosum and fornix. Analysis of differences between the AD versus MCIna, and AD versus MCIa contrasts, highlighted regions that are increasingly compromised in more severe disease stages. Microstructural damage independent of gross tissue loss was widespread in later disease stages. Our findings suggest a scheme where WM damage begins in the core memory network of the temporal lobe, cingulum and prefrontal regions, and spreads beyond these regions in later stages. DA and MD indices were most sensitive at detecting early changes in MCIa. |
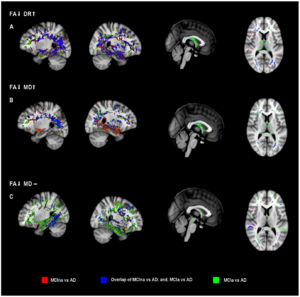 Analysis of disease progression with MCIna versus AD, and, MCIa versus AD. MCIna versus AD is shown in red, MCIa versus AD is shown in green, and areas where these contrasts overlap is shown in blue. (a) FA decreases together with DR increases. (b) FA decreases together with MD increases. (c) FA decreases where MD remains unchanged. See text main text for anatomical description and explanation of the three combinations of indices. Areas of significant difference were visualized using the 3D Slicer program. |
Assessment of Abdominal Adipose Tissue and Organ Fat Content by Magnetic Resonance Imaging
|
Publication: Obes Rev. 2011 May; 12(501):e504-15. PMID: 21348916 | PDF Authors: Hu HH, Nayak KS, Goran MI. Institution: Ming Hsieh Department of Electrical Engineering, Viterbi School of Engineering, University of Southern California, Los Angeles, CA, USA. Background/Purpose: As the prevalence of obesity continues to rise, rapid and accurate tools for assessing abdominal body and organ fat quantity and distribution are critically needed to assist researchers investigating therapeutic and preventive measures against obesity and its comorbidities. Magnetic resonance imaging (MRI) is the most promising modality to address such need. It is non-invasive, utilizes no ionizing radiation, provides unmatched 3D visualization, is repeatable, and is applicable to subject cohorts of all ages. This article is aimed to provide the reader with an overview of current and state-of-the-art techniques in MRI and associated image analysis methods for fat quantification. The principles underlying traditional approaches such as T(1) -weighted imaging and magnetic resonance spectroscopy as well as more modern chemical-shift imaging techniques are discussed and compared. The benefits of contiguous 3D acquisitions over 2D multislice approaches are highlighted. Typical post-processing procedures for extracting adipose tissue depot volumes and percent organ fat content from abdominal MRI data sets are explained. Furthermore, the advantages and disadvantages of each MRI approach with respect to imaging parameters, spatial resolution, subject motion, scan time and appropriate fat quantitative endpoints are also provided. Practical considerations in implementing these methods are also presented. Funding:
|
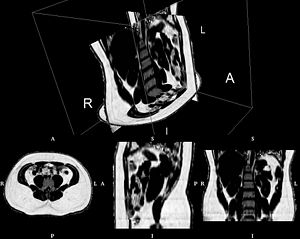 Abdominal fat fraction volume from IDEAL, illustrating the contiguous 3D nature of the data. The volume consists of more than 70 native axial slices and was obtained with five 15 second breath-holds (R: right, L: left, A: anterior, P: posterior, I: inferior, S: superior). Rendering created with 3D Slicer software. |
Subject-specific Musculoskeletal Modeling of the Lower Extremities in Persons with Unilateral Cerebral Palsy
|
Publication: Technical Report 2011 May; | PDF Author: Olesya Klets Institution: Department of Mechanics, Royal Institute of Technology, Stockholm, Sweden. Background/Purpose: The computational musculoskeletal models that are used to study muscle moment-generating capacities of persons with movement disorders and planning treatment options must be accurate, and take into account the inter-individual variability of musculoskeletal geometry. In Paper I the methods of creating the subject-specific musculoskeletal model of the lower extremities from magnetic resonance images (MRIs) were developed. The subject-specific model was used to analyze hip, knee and ankle muscle moment arms (MALs) and muscle-tendon lengths (MTLs) during gait in a subject with unilateral cerebral palsy (CP), and to evaluate the accuracy of widespread and commonly-used scaled generic model. It was found that the scaled generic model delivered accurate values for changes in MTLs in most muscles. However, the scaled generic and the subject-specific lower extremity musculoskeletal models showed substantial differences in MALs calculated during gait. In Paper II subject-specific musculoskeletal models of nine subjects with unilateral CP were created to study muscles volumes, MTLs and MALs; and to examine the accuracy of MALs calculated by the scaled generic models. It was shown that the scaled generic model significantly underestimated hip MALs discrepancies between the affected and the non-affected sides of the lower extremities. However, it significantly overestimated hip adduction/abduction of gluteus maximus, gluteus medius, gluteus minimus, tensor fascia latae and biceps femoris long head; and hip flexion of adductor longus and rectus femoris in the affected and the non-affected sides. It was also found that muscle volumes and hip abduction MALs in gluteus medius and gluteus minimus, hip flexion MALs in iliacus and hip rotation in gluteus maximus were smaller in the affected side of lower extremities. MTLs in the affected and the non-affected sides throughout the range of hip motion were similar. This thesis suggests the need for the subject-specific musculoskeletal models that can account for variability of muscle attachments and musculoskeletal geometry of persons with movement disorders. Based on inaccuracies of the scaled generic model reported here, the generic models that are used to guide treatment decisions must be tested, and interpreted with care. Funding:
|
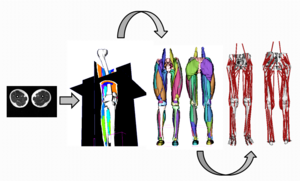 The workflow of building subject-specific musculoskeletal model of the lower extremities from MRIs. Bones and muscles contours were manually outlined by assigning label maps, where each voxel is a number indicating the type of tissue at that location in 3D Slicer, which is a free open- source software for visualization and image computing and can perform different medical image processing activities including surface reconstruction from MRI. |
|
Publication: Neurobiol Aging. 2011 May;32(5):916-32. PMID: 19570593 | PDF Authors: Walhovd KB, Westlye LT, Amlien I, Espeseth T, Reinvang I, Raz N, Agartz I, Salat DH, Greve DN, Fischl B, Dale AM, Fjell AM. Institution: Center for the Study of Human Cognition, Department of Psychology, University of Oslo, Norway. Background/Purpose: Magnetic resonance imaging (MRI) is the principal method for studying structural age-related brain changes in vivo. However, previous research has yielded inconsistent results, precluding understanding of structural changes of the ageing brain. This inconsistency is due to methodological differences and/or different aging patterns across samples. To overcome these problems, we tested age effects on 17 different neuroanatomical structures and total brain volume across five samples, of which one was split to further investigate consistency (883 participants). Widespread age-related volume differences were seen consistently across samples. In four of the five samples, all structures, except the brainstem, showed age-related volume differences. The strongest and most consistent effects were found for cerebral cortex, pallidum, putamen and accumbens volume. Total brain volume, cerebral white matter, caudate, hippocampus and the ventricles consistently showed non-linear age functions. Healthy aging appears associated with more widespread and consistent age-related neuroanatomical volume differences than previously believed. Funding:
|
Enhancement of a Master-Slave Robotic System for Natural Orifice Transluminal Endoscopic Surgery
|
Publication: Ann Acad Med Singapore. 2011 May;40(5):223-30. PMID: 21678013 | PDF Authors: Sun Z, Ang RY, Lim EW, Wang Z, Ho KY, Phee SJ. Institution: School of Mechanical & Aerospace Engineering, Nanyang Technological University, Singapore. Background/Purpose: A novel robotic platform for Natural Orifice Transluminal Endoscopic Surgery (NOTES) is presented in this paper. It aims to tackle two crucial technical barriers which hinder its smooth transition from animal studies to clinical trials: providing effective instrumentations to perform complex NOTES procedures and maintaining the spatial orientation for endoscopic navigation. Materials and Methods: The technical barriers are overcome by the design of the robotic system considering size, triangulation, dexterity, maneuverability and complexity. It is also shown that haptic feedback and interventional navigation system could solve the problem of off-axis manipulation of the camera angle and loss of spatial orientation upon entering the peritoneal cavity in transgastric NOTES procedure, respectively. Results: Successful ESD (endoscopic submucosal dissection) and wedge hepatic resection have been performed on live pigs with our Master And Slave Transluminal Endoscopic Robot (MASTER) system, showing its capability to perform advanced endoscopic surgical and NOTES procedures. It is found that the MASTER exhibited good grasping and cutting efficiency. And the lesion resection time could be significantly reduced with more practice between the endoscopist and the robot operator. Conclusion: This study evaluates the feasibility of MASTER system as a platform overcoming the barriers to NOTES. It is also demonstrated that the MASTER could effectively mitigate the technical constraints normally encountered in NOTES procedures. |
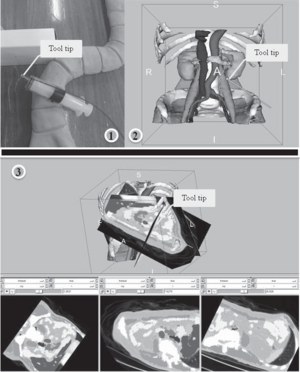 Real-time tracking system in the 3D Slicer interface. |
Brain Regional Lesion Burden and Impaired Mobility in the Elderly
|
Publication: Neurobiol Aging. 2011 Apr;32(4):646-54. PMID: 19428145 | PDF Authors: Moscufo N, Guttmann C, Meier D, Csapo I, Hildenbrand P, Healy B, Schmidt J, Wolfson L Institution: Center for Neurological Imaging, Department of Radiology, Brigham and Women's Hospital, Harvard Medical School, Boston, MA, USA. Background/Purpose: This study investigated the relationship of brain white matter (WM) lesions affecting specific neural networks with decreased mobility in ninety-nine healthy community-dwelling subjects ≥75 years old prospectively enrolled by age and mobility status. We assessed lesion burden in the genu, body and splenium of corpus callosum; anterior, superior and posterior corona radiata; anterior and posterior limbs of internal capsule; corticospinal tract; and superior longitudinal fasciculus. Burden in the splenium of corpus callosum (SCC) demonstrated the highest correlation particularly with walking speed (r=0.4, p<10-4), and in logistic regression it was the best regional predictor of low mobility performance. We also found that independent of mobility, corona radiata has the largest lesion burden with anterior (ACR) and posterior (PCR) aspects being the most frequently affected. The results suggest that compromised inter-hemispheric integration of visuospatial information through the SCC plays an important role in mobility impairment in the elderly. The relatively high lesion susceptibility of ACR and PCR in all subjects may obscure the importance of these lesions in mobility impairment. 3D Slicer application has been used in all the imaging analysis steps, which included intracranial cavity outline, one- and two-channel brain tissue segmentation, labelmap outputs expert review and manual correction, image comparison, volume determination, and three-dimensional modeling. Funding:
|
 White matter lesion distribution and frequency (color bar) in the study subjects at baseline: normal (A), intermediate (B), and impaired (C) mobility. Panel D shows a 3D model reconstruction of the most affected structure, the corona radiata (green), within the white matter (transparent gray), and with ventricles (blue) also shown. |
Three Dimensional in Vivo Modelling of Vestibular Schwannomas and Surrounding Cranial Nerves using Diffusion Imaging Tractography
|
Publication: Neurosurgery. 2011 Apr;68(4):1077-83. PMID: 21242825 Authors: Chen DQ, Quan J, Guha A, Tymianski M, Mikulis D, Hodaie M. Institution: Division of Neurosurgery, Toronto Western Hospital and University of Toronto, Toronto, Ontario, Canada. Background/Purpose: Preservation of cranial nerves (CN) is of paramount concern in the treatment of vestibular schwannomas (VS), particularly in large tumors with thinned and distorted CN fibers. However, imaging of the CN fibers surrounding VS has been limited using 2D imaging alone. We assessed whether tractography of the CN combined with anatomical MR imaging of the tumor can provide superior 3D visualization of tumor/CN complexes. 3T MR imaging including diffusion tensor imaging (DTI) and anatomical images were analyzed in three subjects with VS using 3D Slicer software. The DTI images were used to tract the courses of trigeminal, abducens, facial, and vestibulocochlear nerves. The anatomical images were used to model the 3D volume reconstruction of the tumor. The two sets of images were then superimposed using linear registration. Combined 3D tumor modelling and cranial nerve tractography can effectively and consistently reconstruct the 3D spatial relationship of CN/tumor complexes, and allows for superior visualization compared with 2D imaging. Lateral and superior distortion of the trigeminal nerve was observed in all cases. The position of the facial nerve was primarily anteriorly and inferiorly. The Gasserian ganglion and early postganglionic branches could also be visualized. Tractography and anatomical imaging were successfully combined to demonstrate the precise location of surrounding CN fibers. This technique can be useful in both neuronavigation and radiosurgical planning. Since knowledge of the course of these fibers is of important clinical interest, implementation of this technique may help decrease injury to cranial nerves during treatment of these lesions. |
|
Publication: Neurosurgery. 2011 Apr;68(4):1077-83. PMID: 21135719 | PDF
Institution: Surgical Planning Laboratory, Department of Radiology, Brigham and Women's Hospital, Harvard Medical School, Boston, MA, USA. Background/Purpose: Brain surgery faces important challenges when trying to achieve maximum tumor resection while avoiding post-operative neurological deficits. In order for surgeons to have optimal intraoperative information concerning white matter anatomy, we developed a platform that allows the intra-operative real-time querying of tractography datasets during frameless stereotactic neuronavigation. Structural magnetic resonance imaging (MRI), functional MRI, and diffusion tensor imaging (DTI) were performed on 5 patients before undergoing lesion resection using neuronavigation. During the procedure, the tracked surgical tool tip position was transferred from the navigation system to the 3D Slicer software package, which used this position to seed the white matter tracts around the tool tip location, rendering a geometric visualization of these tracts on the pre-operative images previously loaded onto the navigation system. The clinical feasibility of this approach was evaluated during five cases of lesion resection. In addition, system performance was evaluated by measuring the latency between surgical tool tracking and visualization of the seeded white matter tracts. Lesion resection was performed successfully in all five patients. The seeded white matter tracts close to the lesion and other critical structures, as defined by the functional and structural images, were interactively visualized during the intervention to determine their spatial relationships relative to the lesion and critical cortical areas. Latency between tracking and visualization of tracts was less than a second for fiducial radius size of 4-5mm. Interactive tractography can provide an intuitive way of inspecting critical white matter tracts in the vicinity of the surgical region, allowing the surgeon to have increased intra-operative white matter information to execute the planned surgical resection. Funding:
|
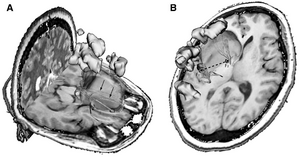 Images shown in the 3D Slicer using the intraoperative tractography navigation software module. The light green volume delineates the tumor location, the orange sphere represents the seed fiducial that is located at the tracked surgical tool tip location, the yellow regions indicate eloquent cortex as shown by language task-associated functional magnetic resonance imaging, and the tubular fibers represent the white matter tracts seeded by the fiducial location. White matter tracts are color coded according to their fractional anisotropy (color scale). A, white matter fibers being seeded by a fiducial representing tool tip position. Some infiltrating fibers can be seen within the segmented tumor volume (arrows). B, intraoperative querying of tractography data sets using the tool offset function. Fiducials F1 and F2 represent the surgical tool tip location and a fixed geometric offset respectively. The navigation module allows for geometric offsets from 280 to 80 mm from the tool tip position. The 2 fiducials can seed the tractography data set simultaneously. |
Three-dimensional Visualization of Subdural Electrodes for Presurgical Planning
|
Publication: Neurosurgery. 2011 Mar;68(1 Suppl Operative):152-60; discussion 160-1. PMID: 21206319 | PDF Authors: LaViolette PS, Rand SD, Raghavan M, Ellingson BM, Schmainda KM, Mueller W. Institution: Department of Biophysics, Medical College of Wisconsin, Milwaukee, WI, USA. Background/Purpose: Accurate localization and visualization of subdural electrodes implanted for intracranial electroencephalography in cases of medically refractory epilepsy remains a challenging clinical problem. |
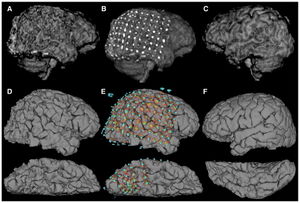 Comparison of 3D representations of the same cortex (patient S6). A, 3D volume rendering of the right hemisphere produced by skull stripping and 3D rendering with the Analyze software package, compared with D produced with Freesurfer software (ventral surface below). B and E show projections of electrodes onto the corresponding brain surfaces. Gyral and sulcal patterns are clearly visible in D and E, but are distorted in A and B by metallic electrode susceptibility artifacts. C and F show the corresponding cortical reconstructions of the unimplanted left hemisphere. Freesurfer-generated pial surfaces bearing electrode shadow were loaded into 3D Slicer for viewing. |
Segmentations of MRI Images of the Female Pelvic Floor: A Study of Inter- and Intra-reader Reliability
|
Publication: J Magn Reson Imaging. 2011 Mar;33(3):684-91. PMID: 21563253 | PDF Authors: Hoyte L, Ye W, Brubaker L, Fielding JR, Lockhart ME, Heilbrun ME, Brown MB, Warfield SK; Pelvic Floor Disorders Network Institution: Urogynecology Division, College of Medicine, University of South Florida, Tampa, FL, USA. Background/Purpose: To describe the inter- and intra-operator reliability of segmentations of female pelvic floor structures. Materials and Methods: Three segmentation specialists were asked to segment out the female pelvic structures in 20 MR datasets on three separate occasions using the 3D Slicer software. The STAPLE algorithm was used to compute inter- and intra-segmenter agreement of each organ in each dataset. STAPLE computed the sensitivity, specificity, and positive predictive values (PPV) for inter- and intra-segmenter repeatability. These parameters were analyzed using intra-class correlation analysis. Correlation of organ volume to PPV and sensitivity was also computed.
|
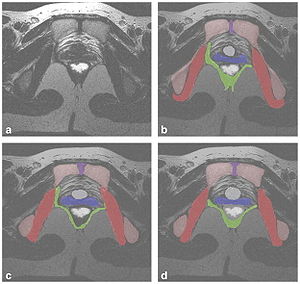 a–d: A sample T2-weighted axial MRI slice, taken at the level of the bladder neck is given in Figure 2a. Example individual segmentations of all organs from each of the three readers is given in Figure 2b–d. Legend: red, obturator internus; green, levator ani; blue, vagina; white, rectum; gray, bladder neck; violet, symphysis; pink, pelvic bones. |
3D Visualization of Subdural Electrode Shift as Measured at Craniotomy Reopening
|
Publication: Epilepsy Res. 2011 Mar;94(1-2):102-9. PMID: 21334178 | PDF Authors: LaViolette PS, Rand SD, Ellingson BM, Raghavan M, Lew SM, Schmainda KM, Mueller W. Institution: Department of Biophysics, Medical College of Wisconsin, Milwaukee, WI, USA. Background/Purpose: Subdural electrodes are implanted for recording intracranial EEG (iEEG) in cases of medically refractory epilepsy as a means to locate cortical regions of seizure onset amenable to surgical resection. Without the aid of imaging-derived 3D electrode models for surgical planning, surgeons have relied on electrodes remaining stationary from the time between placement and follow-up resection. This study quantifies electrode shift with respect to the cortical surface occurring between electrode placement and subsequent reopening. |
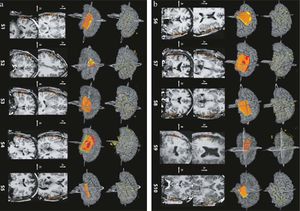 Patients S1—S5 grid placement and shift maps. Top row shows CT-derived electrode models overlaid on post-grid MRI-derived 3D brain surface models. Row 2 shows reconstructed grid sheet models overlaid on the 3D brain model. Sheets are limited to those electrodes whose positions were visible and available for measurement in the OR (at the discretion of the surgeon). Yellow sheet indicates CT-derived electrode positions, Red indicates Stealth OR coordinate-derived sheet, and Orange indicates overlap. Rows 3 and 4 show coronal and axial slices indicating location of red and yellow sheets above. Slices shown are included in the 3D rendering in Rows 1 and 2 (b) Patients S6—S10 grid placement and shift maps. Freesurfer-generated pial surfaces were loaded into 3D Slicer for viewing. |
Lung Volumes and Emphysema in Smokers with Interstitial Lung Abnormalities
|
Publication: N Engl J Med. 2011 Mar 10;364(10):897-906. PMID: 21388308 | [1] Authors: Washko GR, Hunninghake GM, Fernandez IE, Nishino M, Okajima Y, Yamashiro T, Ross JC, Estépar RS, Lynch DA, Brehm JM, Andriole KP, Diaz AA, Khorasani R, D'Aco K, Sciurba FC, Silverman EK, Hatabu H, Rosas IO. Institution: Pulmonary and Critical Care Division, Brigham and Women’s Hospital, Harvard Medical School, Boston, MA, USA. Background/Purpose: Cigarette smoking is associated with emphysema and radiographic interstitial lung abnormalities. The degree to which interstitial lung abnormalities are associated with reduced total lung capacity and the extent of emphysema is not known. We looked for interstitial lung abnormalities in 2416 (96%) of 2508 high-resolution computed tomographic (HRCT) scans of the lung obtained from a cohort of smokers. We used linear and logistic regression to evaluate the associations between interstitial lung abnormalities and HRCT measurements of total lung capacity and emphysema. Quantitative measures of total lung capacity and emphysema were performed with the Airway Inspector, the tool based on 3D Slicer for lung image analysis. Funding:
|
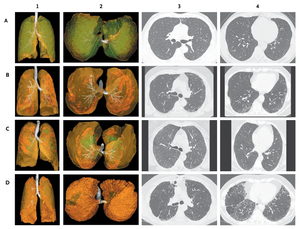 Four Major Radiographic Subtypes of Interstitial Lung Abnormalities. Each row of radiographs and reconstructions represents data from a single study participant. The images in Panel A are characteristic of centrilobular interstitial lung abnormalities; Panel B, subpleural interstitial lung abnormalities; Panel C, mixed centrilobular and subpleural interstitial lung abnormalities; and Panel D, radiographic interstitial lung disease. The images in the first two columns are three-dimensional reconstructions of an anterior-to-posterior view of the lungs (column 1) and a caudal-to-cephalad view (column 2). The translucent yellow-green represents the lung parenchyma; white, the tracheobronchial tree; opaque green, centrilobular opacities; and opaque orange, subpleural abnormalities. Columns 3 and 4 present axial high-resolution computed tomographic images of the chest, with images in column 3 approximately at the level of the carina and those in column 4 approximately at the level of the right inferior pulmonary vein. |
Integration of 3D Anatomical Data Obtained by CT Imaging and 3D Optical Scanning for Computer Aided Implant Surgery
|
Publication: BMC Medical Imaging 2011 Feb; 11:5. PMID: 21338504 | PDF Authors: Frisardi G, Chessa G, Barone S, Paoli A, Razionale A, Frisardi F. Institution: "Epochè" Orofacial Pain Center, Nettuno (Rome), Italy. Background/Purpose: A precise placement of dental implants is a crucial step to optimize both prosthetic aspects and functional constraints. In this context, the use of virtual guiding systems has been recognized as a fundamental tool to control the ideal implant position. In particular, complex periodontal surgeries can be performed using preoperative planning based on CT data. The critical point of the procedure relies on the lack of accuracy in transferring CT planning information to surgical field through custom-made stereo-lithographic surgical guides. Methods: In this work, a novel methodology is proposed for monitoring loss of accuracy in transferring CT dental information into periodontal surgical field. The methodology is based on integrating 3D data of anatomical (impression and cast) and preoperative (radiographic template) models, obtained by both CT and optical scanning processes. A clinical case, relative to a fully edentulous jaw patient, has been used as test case to assess the accuracy of the various steps concurring in manufacturing surgical guides. In particular, a surgical guide has been designed to place implants in the bone structure of the patient. The analysis of the results has allowed the clinician to monitor all the errors, which have been occurring step by step manufacturing the physical templates. The use of an optical scanner, which has a higher resolution and accuracy than CT scanning, has demonstrated to be a valid support to control the precision of the various physical models adopted and to point out possible error sources. A case study regarding a fully edentulous patient has confirmed the feasibility of the proposed methodology. |
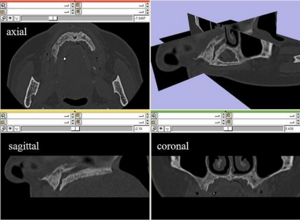 Maxilla CT data in the axial, sagittal and coronal planes and a full 3D view in 3D Slicer. |
Anisotropy of Transcallosal Motor Fibres Indicates Functional Impairment in Children with Periventricular Leukomalacia
|
Publication: Dev Med Child Neurol. 2011 Feb;53(2):179-86. PMID: 21121906 | PDF Authors: Koerte I, Pelavin P, Kirmess B, Fuchs T, Berweck S, Laubender RP, Borggraefe I, Schroeder S, Danek A, Rummeny C, Reiser M, Kubicki M, Shenton ME, Ertl-Wagner B, Heinen F. Institution: Institute of Clinical Radiology, Ludwig-Maximilians-University, Munich, Germany. Background/Purpose: In children with bilateral spastic cerebral palsy (CP), periventricular leukomalacia (PVL) is commonly identified on magnetic resonance imaging. We characterized this white matter condition by examining callosal microstructure, interhemispheric inhibitory competence (IIC), and mirror movements. Method: We examined seven children (age range 11y 9mo-17y 9mo, median age 15y 10mo, four females, three males) with bilateral spastic CP/PVL (Gross Motor Function Classification System level I or II, Manual Ability Classification System level I) and 12 age-matched controls (age range 11y 7mo-17y 1mo, median age 15y 6mo, seven females, five males). Fractional anisotropy of the transcallosal motor fibres (TCMF) and the corticospinal tract (CST) of both sides were calculated. The parameters of IIC (transcranial magnetic stimulation) and mirror movements were measured using a standardized clinical examination and a computer-based hand motor test. Results Fractional anisotropy was lower in children with bilateral spastic CP/PVL regarding the TCMF, but not the left or right CST. Resting motor threshold was elevated in children with bilateral spastic CP/PVL whereas measures of IIC tended to be lower. Mirror movements were markedly elevated in bilateral spastic CP/PVL. Interpretation This study provides new information on different aspects of motor function in children with bilateral spastic CP/PVL. Decreased fractional anisotropy of TCMF is consistent with impairment of hand motor function in children with bilateral spastic CP/PVL. The previously overlooked microstructure of the TCMF may serve as a potential indicator for hand motor function in patients with bilateral spastic CP/PVL. Funding:
|
Automatic Lung Segmentation in CT Images with Accurate Handling of the Hilar Region
|
Publication: J Digit Imaging. 2011 Feb;24(1):11-27. PMID: 19826872 | PDF Authors: De Nunzio G, Tommasi E, Agrusti A, Cataldo R, De Mitri I, Favetta M, Maglio S, Massafra A, Quarta M, Torsello M, Zecca I, Bellotti R, Tangaro S, Calvini P, Camarlinghi N, Falaschi F, Cerello P, Oliva P. Institution: Department of Materials Science, University of Salento, and INFN, Lecce, Italy. Background/Purpose: A fully automated and three-dimensional (3D) segmentation method for the identification of the pulmonary parenchyma in thorax X-ray computed tomography (CT) datasets is proposed. It is meant to be used as pre-processing step in the computer-assisted detection (CAD) system for malignant lung nodule detection that is being developed by the Medical Applications in a Grid Infrastructure Connection (MAGIC-5) Project. In this new approach the segmentation of the external airways (trachea and bronchi), is obtained by 3D region growing with wavefront simulation and suitable stop conditions, thus allowing an accurate handling of the hilar region, notoriously difficult to be segmented. Particular attention was also devoted to checking and solving the problem of the apparent 'fusion' between the lungs, caused by partial-volume effects, while 3D morphology operations ensure the accurate inclusion of all the nodules (internal, pleural, and vascular) in the segmented volume. The new algorithm was initially developed and tested on a dataset of 130 CT scans from the Italung-CT trial, and was then applied to the ANODE09-competition images (55 scans) and to the LIDC database (84 scans), giving very satisfactory results. In particular, the lung contour was adequately located in 96% of the CT scans, with incorrect segmentation of the external airways in the remaining cases. Segmentation metrics were calculated that quantitatively express the consistency between automatic and manual segmentations: the mean overlap degree of the segmentation masks is 0.96 ± 0.02, and the mean and the maximum distance between the mask borders (averaged on the whole dataset) are 0.74 ± 0.05 and 4.5 ± 1.5, respectively, which confirms that the automatic segmentations quite correctly reproduce the borders traced by the radiologist. Moreover, no tissue containing internal and pleural nodules was removed in the segmentation process, so that this method proved to be fit for the use in the framework of a CAD system. Finally, in the comparison with a two-dimensional segmentation procedure, inter-slice smoothness was calculated, showing that the masks created by the 3D algorithm are significantly smoother than those calculated by the 2D-only procedure. Funding:
|
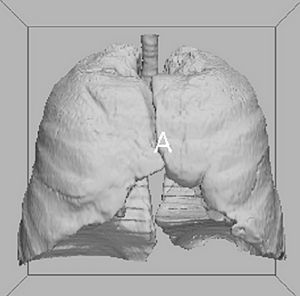 3D binary mask of the respiratory system (step B output). It contains both the external airways (trachea and bronchi) and the lungs. The picture (and the following 3D ones) were rendered by the 3D Slicer visualization and processing software package. |
Using 3D Slicer in Astronomy
|
Institution: The Initiative in Innovative Computing (IIC), Harvard University, Cambridge, MA, USA. Project: IIC AstroMed Project Background/Purpose: While astronomy and medical imaging seem very different, both fields search large amounts of image data looking for meaningful patterns. For example, a physician may inspect a patient's MRI scans looking for signs of disease, while an astronomer will analyze radio telescope image data to find evidence of a new star being born. The two sciences have separately developed many techniques to analyze, visualize, and catalog complex multi-dimensional imaging data, but seldom have experts from the two areas worked together. The 3D Slicer software package is AstroMed's core tool for astronomical 3D data visualization. Originally designed for medical image analysis, 3D Slicer has many capabilities that are uncommon in astronomy software. The AstroMed project brings together researchers from the Harvard Medical School and the Harvard-Smithsonian Center for Astrophysics, along with both national and international collaborators, to combine their knowledge and advance the state-of-the-art in both medical imaging and astronomy. Related article in the February 11, 2011 issue of Science Magazine. |
Brain Morphometry in Autism Spectrum Disorders: A Unified Approach for Structure-specific Statistical Analysis of Neuroimaging Data
|
Publication: Biomed Sci Instrum. 2011;47:135-41. PMID: 21525610 Authors: Vatta F, Di Salle F. Institution: Maastricht University, Maastricht, The Netherlands. Background/Purpose: Autism spectrum disorders (ASD) are a neurodevelopmental condition with multiple causes, comorbid conditions, and a wide range in the type and severity of symptoms expressed by different individuals. This makes the neuroanatomy of autism inherently difficult to describe. It has been assumed in the scientific literature that deviations in regional brain size in clinical samples are directly related to maldevelopment or pathogenesis. The performed clinical studies analyzed specific brain structures that are assumed to be correlated to autistic brain behaviors. Examples of performed analyses, based upon manual or semi-automated segmentation from magnetic resonance imaging (MRI) scans, include volumetric measures of specific brain structures, or small groups of structures, as caudate, corpus callosum, putamen, hippocampus, nucleus accumbens, evaluating differences between groups of subjects with autism and control subjects. Nonetheless, the brain regions analyzed that differ between patients and control subjects have not been always consistent over the performed studies. This inconsistency might be due to the fact that the specific single volume differences that have been reported in the literature for the different brain structures under investigation may, instead, be not independent during pathogenesis. Hence, this issue comes into play in logically framing a comprehensive assessment of putative abnormalities in regional brain volumes. To this aim, a whole brain investigation system for a semi-automated morphometric statistical analysis of brain anatomy is presented in this paper and validated on a selected group of patients diagnosed with ASD that completed a 1.5 T magnetic resonance image (MRI) of the brain. The proposed system, which is mainly built basing upon the FreeSurfer and the 3D Slicer software frameworks for the volumetric analysis of brain imaging data, lies its foundations on the higher statistical power of the region of interest (ROI) approach, but equally aims at a higher exploratory power as it doesn't restrict its focus to a small number of specific regions, thanks to a whole brain unified approach. |
Cognitive Profile and Brain Morphological Changes in Obstructive Sleep Apnea
|
Publication: Neuroimage. 2011 Jan 15;54(2):787-93. PMID: 20888921 | PDF Authors: Torelli F, Moscufo N, Garreffa G, Placidi F, Romigi A, Zannino S, Bozzali M, Fasano F, Giulietti G, Djonlagic I, Malhotra A, Marciani MG, Guttmann CR. Institution: Center for Neurological Imaging, Brigham and Women's Hospital, Harvard Medical School, Boston, MA, USA. Background/Purpose: Obstructive sleep apnea (OSA) is accompanied by neurocognitive impairment, likely mediated by injury to various brain regions. We evaluated brain morphological changes in patients with OSA and their relationship to neuropsychological and oximetric data. Sixteen patients affected by moderate-severe OSA (age: 55.8±6.7 years, 13 males) and fourteen control subjects (age: 57.6±5.1 years, 9 males) underwent 3.0 Tesla brain magnetic resonance imaging (MRI) and neuropsychological testing evaluating short- and long-term memory, executive functions, language, attention, praxia and non-verbal learning. Volumetric segmentation of cortical and subcortical structures and voxel-based morphometry (VBM) were performed. Patients and controls differed significantly in Rey Auditory-Verbal Learning test (immediate and delayed recall), Stroop test and Digit span backward scores. Volumes of cortical gray matter (GM), right hippocampus, right and left caudate were smaller in patients compared to controls, with also brain parenchymal fraction (a normalized measure of cerebral atrophy) approaching statistical significance. Differences remained significant after controlling for comorbidities (hypertension, diabetes, smoking, hypercholesterolemia). VBM analysis showed regions of decreased GM volume in right and left hippocampus and within more lateral temporal areas in patients with OSA. Our findings indicate that the significant cognitive impairment seen in patients with moderate-severe OSA is associated with brain tissue damage in regions involved in several cognitive tasks. We conclude that OSA can increase brain susceptibility to the effects of aging and other clinical and pathological occurrences. Funding:
|
 Series from 3D Slicer segmentation module. Figure shows a same-level slice from the MPRAGE (A), FLAIR (B) and T2 (C) series and the segmentation output of 3D Slicer module (D) which was obtained using MPRAGE and FLAIR as inputs. Colors in panel D: yellow (WM), pale blue (GM), pink (CSF), red (WMH) and white (putamen). The ICV is outlined in green (panel C) and includes cortical CSF. |
2010
Application of Vascular Model Toolkit (VMTK) for Coronary Arteries
|
Publication: Presented at 62nd Cardiological Society of India Conference, Kolkata, India, 2010 Dec; | PDF Authors: Christopher J, Mohan R, Duraikannu C, Kishore LT, Raju K. Institution: Care Hospitals, Hyderabad, India Background/Purpose: Functional evaluation of coronary arteries involves study of their 3D shapes and diameters. Segmentation of vascular structures from 3D-Computerized Tomographic Angiogram (CTA) images can be achieved by using VMTK. This gives: (1) a polygonal surface model of vascular structures having centerline based geometric quantities and (2) compute centerlines and Maximal Inscribed Sphere Radius (MISR) of branching tubular structures (Voronoi image). VMTK module integrated in 3D Slicer is used as it allows use of other 3D Slicer modules for processing of images. We use: VesselEnhancement, EasyLevelsetSegmentation and Centerlines modules for study. |
Ion-Abrasion Scanning Electron Microscopy Reveals Surface-Connected Tubular Conduits in HIV-Infected Macrophages
|
Publication: PLoS Pathog. 2010 Sep;5(9):e1000591. PMID: 19779568 | PDF Authors: Bennett AE, Narayan K, Shi D, Hartnell LM, Gousset K, He H, Lowekamp BC, Yoo TS, Bliss D, Freed EO, Subramaniam S. Institution: Laboratory of Cell Biology, Center for Cancer Research, NCI, NIH, Bethesda, MD, USA. Background/Purpose: HIV-1-containing internal compartments are readily detected in images of thin sections from infected cells using conventional transmission electron microscopy, but the origin, connectivity, and 3D distribution of these compartments has remained controversial. Here, we report the 3D distribution of viruses in HIV-1-infected primary human macrophages using cryo-electron tomography and ion-abrasion scanning electron microscopy (IA-SEM), a recently developed approach for nanoscale 3D imaging of whole cells. Using IA-SEM, we show the presence of an extensive network of HIV-1-containing tubular compartments in infected macrophages, with diameters of 150-200 nm, and lengths of up to 5 mm that extend to the cell surface from vesicular compartments that contain assembling HIV-1 virions. These types of surface-connected tubular compartments are not observed in T cells infected with the 29/31 KE Gag-matrix mutant where the virus is targeted to multi-vesicular bodies and released into the extracellular medium. IA-SEM imaging also allows visualization of large sheet-like structures that extend outward from the surfaces of macrophages, which may bend and fold back to allow continual creation of viral compartments and virion-lined channels. This potential mechanism for efficient virus trafficking between the cell surface and interior may represent a subversion of pre-existing vesicular machinery for antigen capture, processing, sequestration, and presentation. Funding:
|
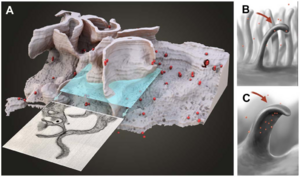 3D representation of the surface and interior of an HIV-infected macrophage (animation is presented in Video S10). (A) Sections that would appear to contain ‘‘filopodia’’ when imaged by transmission electron microscopy of individual sections can actually correspond to large wavelike membrane processes as in this example. The virions are shown in red. (B, C) Schematic side (B) and front (C) views of these surface protrusions shown to indicate how bending and folding back of the extensions onto the surface of the cell could trap the contents of the aqueous environment within the invaginated folds of the membrane, and allow creation of viral compartments. |
MRI-Guided Robotic Prostate Biopsy: A Clinical Accuracy Validation
|
Publication: Int Conf Med Image Comput Comput Assist Interv. 2010 Sep;13(Pt 3):383-391. PMID: 20879423 | PDF Authors: Xu H, Lasso A, Vikal S, Guion P, Krieger A, Kaushal A, Whitcomb LL, Fichtinger G. Institutions: Queen's University, Kingston, ON, Canada.
Funding:
|
A Method for Planning Safe Trajectories in Image-guided Keyhole Neurosurgery
|
Publication: Med Image Comput Comput Assist Interv. 2010 Sep;13(Pt 3):457-64. PMID: 20879432 | PDF Authors: Shamir RR, Tamir I, Dabool E, Joskowicz L, Shoshan Y. Institution: School of Engineering and Computer Science, Hebrew University, Jerusalem, Israel. Background/Purpose: We present a new preoperative planning method for reducing the risk associated with insertion of straight tools in image-guided keyhole neurosurgery. The method quantifies the risks of multiple candidate trajectories and presents them on the outer head surface to assist the neurosurgeon in selecting the safest path. The surgeon can then define and/or revise the trajectory, add a new one using interactive 3D visualization, and obtain a quantitative risk measures. The trajectory risk is evaluated based on the tool placement uncertainty, on the proximity of critical brain structures, and on a predefined table of quantitative geometric risk measures. Our results on five targets show a significant reduction in trajectory risk and a shortening of the preoperative planning time as compared to the current routine method. Funding:
|
JHU Workshop for Talented Youth
|
Publication: Workshop for Talented Youth, 2010 Sep; Author: Wyatt C. Institution: John Hopkins University, Baltimore, MD. Background/Purpose: This 2010 workshop for the JHU Center for Talented Youth was hosted at Virginia Tech and focused on neuroscience. The event included an interactive session titled "Brain Shape: Using images to predict the development of Alzheimer's Disease." The session included a short introduction to neuroimaging, followed by students, alone or in pairs, using t3D Slicer software to compare healthy and pathological images of the brain. 100 students ranging in age from 13 to 16 years old attended the event. |
Canine Hippocampal Formation Composited Into Three-dimensional Structure using MPRAGE
|
Publication: J Vet Med Sci. 2010 Jul;72(7):853-60. PMID: 20179383 | PDF Authors: Jung MA, Lee MS, Lee IH, Lee AR, Jang DP, Kim YB, Cho ZH, Nahm SS, Eom KD. Institution: Department of Veterinary Radiology and Diagnostic Imaging, College of Veterinary Medicine, Konkuk University. Background/Purpose: This study was performed to anatomically illustrate the living canine hippocampal formation in three-dimensions (3D), and to evaluate its relationship to surrounding brain structures. Three normal beagle dogs were scanned on a MR scanner with inversion recovery segmented three- dimensoinal gradient echo sequence (known as MP-RAGE: Magnetization Prepared Rapid Gradient Echo). The MRI data was manually segmented and reconstructed into a three-dimensional model using the 3D Slicer software tool. From the three-dimensional model, the spatial relationships between hippocampal formation and surrounding structures were evaluated. With the increased spatial resolution and contrast of the MPRAGE, the canine hippocampal formation was easily depicted. The reconstructed three-dimensional image allows easy understanding of the hippocampal contour and demonstrates the structural relationship of the hippocampal formation to surrounding structures in vivo. Funding:
|
|
Publication: J Am Coll Surg. 2010 Jun;210(6):927-33. PMID: 20510801 | PDF Authors: Tomikawa M, Hong J, Shiotani S, Tokunaga E, Konishi K, Ieiri S, Tanoue K, Akahoshi T, Maehara Y, Hashizume M. Institution: Department of Future Medicine and Innovative Medical Information, Graduate School of Medical Sciences, Kyushu University, Higashi-ku, Fukuoka, Japan. Background/Purpose: The aim of this study was to report on the early experiences using a real-time 3-dimensional (3D) virtual reality navigation system with open MRI for breast-conserving surgery. We developed a real-time 3D virtual reality navigation system with open MRI, and evaluated the mismatch between the navigation system and real distance using a 3D phantom. Two patients with nonpalpable MRI-detected breast tumors underwent breast-conserving surgery under the guidance of the navigation system. An initial MRI for the breast tumor using skin-affixed markers was performed immediately before excision. A percutaneous intramammary dye marker was applied to delineate an excision line, and the computer software 3D Slicer generated a real-time 3D virtual reality model of the tumor and the puncture needle in the breast. Excision of the tumor was performed in the usual manner along the excision line indicated with the dye. The resected specimens were carefully examined histopathologically. The mean mismatch between the navigation system and real distance was 2.01±0.32 mm when evaluated with the 3D phantom. Under guidance by the navigation system, a percutaneous intramammary dye marker was applied without any difficulty. Fiducial registration errors were 3.00 mm for patient no. 1, and 4.07 mm for patient no. 2. Histopathological examinations of the resected specimens of the 2 patients showed noninvasive ductal carcinoma in situ. The surgical margins were free of carcinoma cells. Real-time 3D virtual reality navigation system with open MRI is feasible for safe and accurate excision of nonpalpable MRI-detected breast tumors. Long-term outcomes of this technique should be evaluated further. |
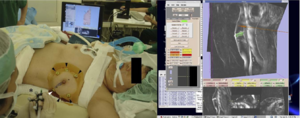 Left, percutaneous intramammary injection of dye in the syringe to make a dissection line of the tumor with the navigation of 3D Slicer. Arrowheads, skin markers; asterisk, a syringe attached with infrared markers; right, virtual MR images on the monitor of 3D Slicer reflecting the same slice as the puncture line. A breast tumor is indicated in green; a needle and a puncture line are indicated in red. |
Interfaces and Integration of Medical Image Analysis Frameworks: Challenges and Opportunities
|
Publication: Annu ORNL Biomed Sci Eng Cent Conf. 2010 May 25;2010:1-4. PMID: 21151892 | PDF Authors: Covington K, McCreedy ES, Chen M, Carass A, Aucoin N, Landman BA. Institution: Department of Electrical Engineering, Vanderbilt University, Nashville, TN, USA. Background/Purpose: Clinical research with medical imaging typically involves large-scale data analysis with interdependent software toolsets tied together in a processing workflow. Numerous, complementary platforms are available, but these are not readily compatible in terms of workflows or data formats. Both image scientists and clinical investigators could benefit from using the framework which is a most natural fit to the specific problem at hand, but pragmatic choices often dictate that a compromise platform is used for collaboration. Manual merging of platforms through carefully tuned scripts has been effective, but exceptionally time consuming and is not feasible for large-scale integration efforts. Hence, the benefits of innovation are constrained by platform dependence. Removing this constraint via integration of algorithms from one framework into another is the focus of this work. We propose and demonstrate a light-weight interface system to expose parameters across platforms and provide seamless integration. In this initial effort, we focus on four platforms Medical Image Analysis and Visualization (MIPAV), Java Image Science Toolkit (JIST), command line tools, and 3D Slicer. We explore three case studies: (1) providing a system for MIPAV to expose internal algorithms and utilize these algorithms within JIST, (2) exposing JIST modules through self-documenting command line interface for inclusion in scripting environments, and (3) detecting and using JIST modules in 3D Slicer. We review the challenges and opportunities for light-weight software integration both within development language (e.g., Java in MIPAV and JIST) and across languages (e.g., C/C++ in 3D Slicer and shell in command line tools). Funding:
|
Evaluation of Robotic Needle Steering in Ex Vivo Tissue
|
Publication: IEEE Int Conf Robot Autom. 2010 May 3;2010:2068-2073. PMID: 21339851 | PDF Authors: Majewicz A, Wedlick TR, Reed KB, Okamura AM. Institution: Department of Mechanical Engineering, Laboratory for Computational Sensing and Robotics, Johns Hopkins University, Baltimore, MD, USA. Background/Purpose: Insertion velocity, tip asymmetry, and shaft diameter may influence steerable needle insertion paths in soft tissue. In this paper we examine the effects of these variables on needle paths in ex vivo goat liver, and demonstrate practical applications of robotic needle steering for ablation, biopsy, and brachytherapy. All experiments were performed using a new portable needle steering robot that steers asymmetric-tip needles under fluoroscopic imaging. For bevel-tip needles, we found that larger diameter needles resulted in less curvature, i.e. less steerability, confirming previous experiments in artificial tissue. The needles steered with radii of curvature ranging from 3:4 cm (for the most steerable pre-bent needle) to 2:97m (for the least steerable bevel needle). Pre-bend angle significantly affected needle curvature, but bevel angle did not. We hypothesize that biological tissue characteristics such as inhomogeneity and viscoelasticity significantly increase path variability. These results underscore the need for closed-loop image guidance for needle steering in biological tissues with complex internal structure. Funding:
|
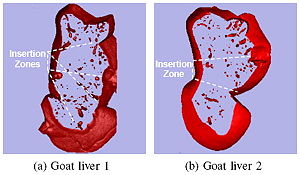 Slices of volume-rendered goat livers generated using fluoroscopic images and 3D Slicer software. |
An Open Source Implementation of Colon CAD in 3D Slicer
|
Publication: Proc. of SPIE 2010. Vol. 7624 762421-2 | PDF Authors: Xu H, Gage HD, Santago P. Institution: Department of Biomedical Engineering, Wake Forest University Health Sciences, Winston-Salem, NC, USA. Background/Purpose: Most colon CAD (computer aided detection) software products, especially commercial products, are designed for use by radiologists in a clinical environment. Therefore, those features that effectively assist radiologists in finding polyps are emphasized in those tools. However, colon CAD researchers, many of whom are engineers or computer scientists, are working with CT studies in which polyps have already been identified using CT Colonography (CTC) and/or optical colonoscopy (OC). Their goal is to utilize that data to design a computer system that will identify all true polyps with no false positive detections. Therefore, they are more concerned with how to reduce false positives and to understand the behavior of the system than how to find polyps. Thus, colon CAD researchers have different requirements for tools not found in current CAD software. We have implemented a module in 3D Slicer to assist these researchers. As with clinical colon CAD implementations, the ability to promptly locate a polyp candidate in a 2D slice image and on a 3D colon surface is essential for researchers. Our software provides this capability, and uniquely, for each polyp candidate, the prediction value from a classifier is shown next to the 3D view of the polyp candidate, as well as its CTC/OC finding. This capability makes it easier to study each false positive detection and identify its causes. We describe features in our colon CAD system that meets researchers’ specific requirements. Our system uses an open source implementation of a 3D Slicer module, and the software is available to the public for use and for extension (http://www2.wfubmc.edu/ctc/download/). Funding:
|
In Vivo Visualization of Cranial Nerve Pathways in Humans using Diffusion-Based Tractography
|
Publication: Neurosurgery. 2010 Apr;66(4):788-95; discussion 795-6. PMID: 20305498 | PDF Authors: Hodaie M, Quan J, Chen DQ. Institution: Division of Neurosurgery, University of Toronto and Toronto Western Hospital, Toronto, ON, Canada. Background/Purpose: Diffusion-based tractography has emerged as a powerful technique for 3-dimensional tract reconstruction and imaging of white matter fibers; however, tractography of the cranial nerves has not been well studied. In particular, the feasibility of tractography of the individual cranial nerves has not been previously assessed. Methods: 3-Tesla magnetic resonance imaging scans, including anatomic magnetic resonance images and diffusion tensor images, were used for this study. Tractography of the cranial nerves was performed using 3D Slicer software. The reconstructed 3-dimensional tracts were overlaid onto anatomic images for determination of location and course of intracranial fibers. Detailed tractography of the cranial nerves was obtained, although not all cranial nerves were imaged with similar anatomic fidelity. Some tracts were imaged in great detail (cranial nerves II, III, and V). Tractography of the optic apparatus allowed tracing from the optic nerve to the occipital lobe, including Meyer's loop. Trigeminal tractography allowed visualization of the gasserian ganglion as well as postganglionic fibers. Tractography of cranial nerve III shows the course of the fibers through the midbrain. Lower cranial nerves (cranial nerves IX, XI, and XII) could not be imaged well. Tractography of the cranial nerves is feasible, although technical improvements are necessary to improve the tract reconstruction of the lower cranial nerves. Detailed assessment of anatomy and the ability of overlaying the tracts onto anatomic magnetic resonance imaging scans is essential, particularly in the posterior fossa, to ensure that the tracts have been reconstructed with anatomic fidelity. |
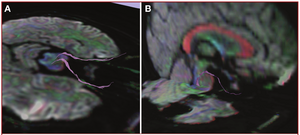 Intra- and extracranial course of cranial nerve III, depicted onto mixed anatomic/color-by-orientation MRI slices. Images are overlaid onto axial MRI slices (A) and sagittal MRI slices (B). The intracranial course takes a sharp angle, after which the fibers appear to enter the medial longitudinal fasciculus. The large commissural fibers of the corpus callosum (red) and fornix (blue) can be easily visualized on the sagittal slices. (Please see also Supplementary Digital Content 2, Figure 2, a 3-dimensional representation of the oculomotor nerves.) |
Brain Maturation in Adolescence and Young Adulthood: Regional Age-Related Changesi in Cortical Thickness and White Matter Volume and Microstructure
|
Publication: Cereb Cortex. 2010 Mar;20(3):534-48. PMID: 19520764 | PDF Authors: Tamnes CK, Ostby Y, Fjell AM, Westlye LT, Due-Tønnessen P, Walhovd KB. Institution: Center for the Study of Human Cognition, Department of Psychology, University of Oslo, Oslo, Norway. Background/Purpose: The development of cortical gray matter, white matter (WM) volume, and WM microstructure in adolescence is beginning to be fairly well characterized by structural magnetic resonance imaging (sMRI) and diffusion tensor imaging (DTI) studies. However, these aspects of brain development have rarely been investigated concurrently in the same sample and hence the relations between them are not understood. We delineated the age-related changes in cortical thickness, regional WM volume, and diffusion characteristics and investigated the relationships between these properties of brain development. One hundred and sixty-eight healthy participants aged 8-30 years underwent sMRI and DTI. The results showed regional age-related cortical thinning, WM volume increases, and changes in diffusion parameters. Cortical thickness was the most strongly age-related parameter. All classes of measures showed unique associations with age. The results indicate that cortical thinning in adolescence cannot be explained by WM maturation in underlying regions as measured by volumetry or DTI. Moderate associations between cortical thickness and both volume and diffusion parameters in underlying WM regions were also found, although the relationships were not strong. It is concluded that none of the measures are redundant and that the integration of the 3 will yield a more complete understanding of brain maturation. |
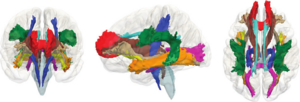 Three-dimensional renderings of the probabilistic tracts. The 11 atlas-based probabilistic tracts from the Mori atlas are shown as 3D renderings in anterior, left, and dorsal views, displayed on a semitransparent template brain from FreeSurfer (fsaverage). Color codes refer to: Dark brown: Anterior thalamic radiation (ATR), Blue: Cingulum- cingulate gyrus (CCG), Purple: Cingulum-hippocampus gyrus (CHG), Dark blue: Cortico-spinal tract (CST), Pink: Forceps major (FMa), Red: Forceps minor (FMi), Brown: Inferior fronto-occipital fasciculus (IFOF), Orange: Inferior longitudinal fasciculus (ILF), Dark green: Superior longitudinal fasciculus (SLF), Green: Superior longitudinal fasciculus temporal part (SLFTP), and Yellow: Uncinate fasciculus (UF). The figure was made by the use of 3D Slicer software. |
Coronary Artery Centerline Extraction in 3D Slicer using VMTK based Tools
|
Publication: Master's Thesis, University of Heidelberg 2010 Feb; | PDF Author: Daniel Hähn Institution: Medical Informatics, University of Heidelberg, Heidelberg, Germany. Background/Purpose: Atherosclerosis of the coronary arteries leads to Coronary Artery Disease (CAD) and is one of the main causes of death worldwide. Diagnosis and investigation of the severity of atherosclerosis is performed through medical imaging. In this context, the central lumen line of coronary arteries is of importance because it can be used for visualization and reconstruction based on reformatted images. We studied algorithms performing vessel enhancement filtering, level set segmentation and centerline computation based on Delaunay tessellation. By composing a pipeline of these, it is possible to extract the centerlines of coronary arteries in Computed Tomography Angiography (CTA) images. We implemented the pipeline as modules in 3D Slicer, an application providing a wide range of tools for medical image processing. This was accomplished by using methods of the Vascular Modeling Toolkit, an open source framework for image-based modeling of blood vessels. We evaluated the pipeline on eight CTA datasets by extracting the centerlines of the right and left coronary arteries. Using a large-scale parameter exploration study, we could achieve an average overlap over 72% of the clinically relevant part of the vessels combined with an average accuracy of 0.47 mm by finding individual parameters for each dataset. Through a leave-one-out cross validation approach, we recognized parameter sets targeting the different branches of the arteries suitable for all datasets. Nevertheless, the found pattern lowers the average overlap to 54% and the average accuracy to 0.66 mm. The software modules created during this project are available as open source software and suitable for end-users. Funding:
|
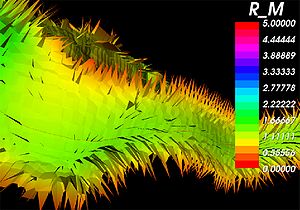 A close-up of the internal Voronoi diagram and the corresponding centerline of a blood vessel obtained using the created tools in 3D Slicer. The individual Voronoi regions are visible as ”tiles” where the color indicates the maximum inscribed sphere radius R_M ( x ) [vx]. Surface noise leads to the small perturbations visible as spikes near the vessel lumen wall. |
Assessment of Image Registration Accuracy in Three-dimensional Transrectal Ultrasound Guided Prostate Biopsy
|
Publication: Med Phys. 2010 Feb;37(2):802-13. PMID: 20229890 Authors: Karnik VV, Fenster A, Bax J, Cool DW, Gardi L, Gyacskov I, Romagnoli C, Ward AD. Institution: Biomedical Engineering Graduate Program, University of Western Ontario, London, ON, Canada. Background/Purpose: Prostate biopsy, performed using two-dimensional (2D) transrectal ultrasound (TRUS) guidance, is the clinical standard for a definitive diagnosis of prostate cancer. Histological analysis of the biopsies can reveal cancerous, noncancerous, or suspicious, possibly precancerous, tissue. During subsequent biopsy sessions, noncancerous regions should be avoided, and suspicious regions should be precisely rebiopsied, requiring accurate needle guidance. It is challenging to precisely guide a needle using 2D TRUS due to the limited anatomic information provided, and a three-dimensional (3D) record of biopsy locations for use in subsequent biopsy procedures cannot be collected. Our tracked, 3D TRUS-guided prostate biopsy system provides additional anatomic context and permits a 3D record of biopsies. However, targets determined based on a previous biopsy procedure must be transformed during the procedure to compensate for intraprocedure prostate shifting due to patient motion and prostate deformation due to transducer probe pressure. Thus, registration is a critically important step required to determine these transformations so that correspondence is maintained between the prebiopsied image and the real-time image. Registration must not only be performed accurately, but also quickly, since correction for prostate motion and deformation must be carried out during the biopsy procedure. The authors evaluated the accuracy, variability, and speed of several surface-based and image-based intrasession 3D-to-3D TRUS image registration techniques, for both rigid and nonrigid cases, to find the required transformations. Our surface-based rigid and nonrigid registrations of the prostate were performed using the iterative-closest-point algorithm and a thin-plate spline algorithm, respectively. For image-based rigid registration, the authors used a block matching approach, and for nonrigid registration, the authors define the moving image deformation using a regular, 3D grid of B-spline control points. The authors measured the target registration error (TRE) as the postregistration misalignment of 60 manually marked, corresponding intrinsic fiducials. The authors also measured the fiducial localization error (FLE), the effect of segmentation variability, and the effect of fiducial distance from the transducer probe tip. Lastly, the authors performed 3D principal component analysis (PCA) on the x, y, and z components of the TREs to examine the 95% confidence ellipsoids describing the errors for each registration method. Using surface-based registration, the authors found mean TREs of 2.13±0.80 and 2.09±0.77 mm for rigid and nonrigid techniques, respectively. Using image-based rigid and non-rigid registration, the authors found mean TREs of 1.74±0.84 and 1.50±0.83 mm, respectively. Our FLE was 0.21 mm and did not dominate the overall TRE. However, segmentation variability contributed substantially approximately 50%) to the TRE of the surface-based techniques. PCA showed that the 95% confidence ellipsoid encompassing fiducial distances between the source and target registration images was reduced from 3.05 to 0.14 cm3, and 0.05 cm3 for the surface-based and image-based techniques, respectively. The run times for both registration methods were comparable at less than 60 s. Our results compare favorably with a clinical need for a TRE of less than 2.5 mm, and suggest that image-based registration is superior to surface-based registration for 3D TRUS-guided prostate biopsies, since it does not require segmentation. |
Language Laterality in Autism Spectrum Disorder and Typical Controls: A Functional, Volumetric, and Diffusion Tensor MRI Study
|
Publication: Brain Lang. 2010 Feb;112(2):113-20. PMID: 20031197 | PDF Authors: Knaus TA, Silver AM, Kennedy M, Lindgren KA, Dominick KC, Siegel J, Tager-Flusberg H. Institution: Department of Anatomy and Neurobiology, Boston University School of Medicine, Boston, MA, USA. Background/Purpose: Language and communication deficits are among the core features of autism spectrum disorder (ASD). Reduced or reversed asymmetry of language has been found in a number of disorders, including ASD. Studies of healthy adults have found an association between language laterality and anatomical measures but this has not been systematically investigated in ASD. The goal of this study was to examine differences in gray matter volume of perisylvian language regions, connections between language regions, and language abilities in individuals with typical left lateralized language compared to those with atypical (bilateral or right) asymmetry of language functions. Fourteen adolescent boys with ASD and 20 typically developing adolescent boys participated, including equal numbers of left- and right-handed individuals in each group. Participants with typical left lateralized language activation had smaller frontal language region volume and higher fractional anisotropy of the arcuate fasciculus compared to the group with atypical language laterality, across both ASD and control participants. The group with typical language asymmetry included the most right-handed controls and fewest left-handers with ASD. Atypical language laterality was more prevalent in the ASD than control group. These findings support an association between laterality of language function and language region anatomy. They also suggest anatomical differences may be more associated with variation in language laterality than specifically with ASD. Language laterality therefore may provide a novel way of subdividing samples, resulting in more homogenous groups for research into genetic and neurocognitive foundations of developmental disorders. |
Perk Station-Percutaneous Surgery Training and Performance Measurement Platform
|
Publication: Comput Med Imaging Graph. 2010 Jan;34(1):19-32. PMID: 19539446 | PDF Authors: Vikal S, U-Thainual P, Carrino JA, Iordachita I, Fischer GS, Fichtinger G. Institution: Queen's University, Kingston, ON, Canada. Background/Purpose: Image-guided percutaneous (through the skin) needle-based surgery has become part of routine clinical practice in performing procedures such as biopsies, injections and therapeutic implants. A novice physician typically performs needle interventions under the supervision of a senior physician; a slow and inherently subjective training process that lacks objective, quantitative assessment of the surgical skill and performance. Shortening the learning curve and increasing procedural consistency are important factors in assuring high-quality medical care. This paper describes a laboratory validation system, called Perk Station, for standardized training and performance measurement under different assistance techniques for needle-based surgical guidance systems. The initial goal of the Perk Station is to assess and compare different techniques: 2D image overlay, biplane laser guide, laser protractor and conventional freehand. The main focus of this manuscript is the planning and guidance software system developed on the 3D Slicer platform, a free, open source software package designed for visualization and analysis of medical image data. The prototype Perk Station has been successfully developed, the associated needle insertion phantoms were built, and the graphical user interface was fully implemented. The system was inaugurated in undergraduate teaching and a wide array of outreach activities. Initial results, experiences, ongoing activities and future plans are reported. Funding:
|
2009
Three-dimensional Appearance of the Lips Muscles with Three-dimensional Isotropic MRI: In Vivo Study
|
Publication: Int J Comput Assist Radiol Surg. 2009 Jun;4(4):349-52. PMID: 20033581 | PDF Authors: Olszewski R, Liu Y, Duprez T, Xu TM, Reychler H. Institution: Department of Oral and Maxillofacial Surgery, Cliniques Universitaires Saint Luc, Université Catholique de Louvain, Brussels, Belgium. Background/Purpose: Our knowledge of facial muscles is based primarily on atlases and cadaveric studies. This study describes a non-invasive in vivo method (3D MRI) for segmenting and reconstructing facial muscles in a three-dimensional fashion. Three-dimensional (3D), T1-weighted, 3 Tesla, isotropic MRI was applied to a subject. One observer performed semi-automatic segmentation using the Editor module from the 3D Slicer software (Harvard Medical School, Boston, MA, USA), version 3.2. We were able to successfully outline and three-dimensionally reconstruct the following facial muscles: pars labialis orbicularis oris, m. levatro labii superioris alaeque nasi, m. levator labii superioris, m. zygomaticus major and minor, m. depressor anguli oris, m. depressor labii inferioris, m. mentalis, m. buccinator, and m. orbicularis oculi. 3D reconstruction of the lip muscles should be taken into consideration in order to improve the accuracy and individualization of existing 3D facial soft tissue models. More studies are needed to further develop efficient methods for segmentation in this field. |
Traces
|
Author: Caitlin Berrigan Assistance: Marianna Jakab, BWH Special Thanks: J. Levi Schmidt (MIT), Tom Lutz (MIT Media Lab), Neil Gershenfeld (MIT Center for Bits & Atoms), Clare Tempany (BWH) Institution: MIT Visual Arts Program, 2010 Jun; Background/Purpose: Traces is a renewable sculpture of the artist’s own disembodied kidney, cast in frozen spit. Every two hours a new frozen organ is put on display, only to melt and drip away. The artist - using 3D Slicer - carefully traced the topography of her internal organ from a 3D MRI, consisting of hundreds of sequential medical images, in order to materialize its form outside of her body. Traces is a poetic deterritorialization of medical biotechnologies, organs without bodies and fleshy displacements. It calls attention to the alienability of body parts and the vast global industry that sustains the promise of an infinitely repairable body. Funding:
|
CLIMB Study (Comprehensive Longitudinal Investigation of Multiple Sclerosis at Brigham and Women’s Hospital) Former NHS Study (The Harvard Multiple Sclerosis Natural History Study)
|
Institution: Multiple Sclerosis Center Background/Purpose: The CLIMB study is a longitudinal natural history study conducted at the Partners Multiple Sclerosis Center. All patients enrolled in the CLIMB undergo a detailed neurological examination at least annually, and have a brain MRI and a blood draw with associated immunological analysis on an annual basis. Within the CLIMB study, the following cohorts of patients are enrolled: relapsing-remitting MS (RRMS) and secondary progressive MS (SPMS), as well as patients with primary progressive MS (PPMS), CIS, and benign MS. Over 30 publications have been generated from CLIMB-related data since its inception. The MRI Analysis Center of the Partners MS Center manages routine MRI processing of all CLIMB study subject MRIs. Routine processing includes calculation of T2 lesion volume and brain parenchymal fraction and number of gadolinium enhancing lesions. Image Workflow system based on Standart Operationg Procedures/Modules in Database system to allow for query from data fields as well as in image space. Several advanced image visualization packages are used for visualization and analysis. These include 3D Slicer, OSIRIX and GDC (in house). 3D Slicer and OSIRIX are open source packages, for which CNI had developed plugins and scripts to streamline workflow. Following processing steps are performed using 3D Slicer software:
|
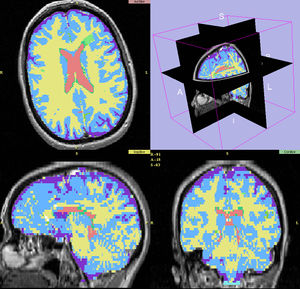 Last step of processing pipeline, segmented label map (green - MS lesions, yellow- WM, blue - GM, Red - ventrical CSF, purple - cortical CSF) displayed in 3D Slicer for expert review along with original grayscale 2D PD and T2 images (source of 2 channel TDS+ segmentation pipeline). Original axial images are reconstructed in 3D to display sagital and coronal view as well. |
Steroid Adjunctive Treatment at Initiation of Avonex Therapy for Patients with Mono-Symptomatic or Relapsing-Remitting Multiple Sclerosis
|
Principal Investigator: Rohit Bakshi Institution: Laboratory for Neuroimaging Research, Partners MS Center Background/Purpose: We used quantitative MRI parameters such as T2 lesion volume (T2LV) and brain parenchymal fraction (BPF) to assess treatment in patients with MS. T2 lesion volume and BPF were measured using template-driven segmentation (TDS+) algorithm by automated pipeline. Medical image data were visualized with 3D Slicer to provide QC for original data, segmented output and perform manual correction on required steps of processing pipeline. Funding:
|
Age-Related Changes of Cognition in Health and Diseases: Image Analysis Core
|
Principal Investigator: Marilyn S. Albert Institution: Johns Hopkins Alzheimer’s Disease Research Center Background/Purpose: The goal of this project was the utilization of magnetic resonance imaging for morphometric analysis and tissue characterization to distinguish the patterns of brain atrophy and gray or white matter changes and white matter signal abnormalities in normal aging or Alzheimer's disease. Image analysis comprised an automated tissue segmentation into the intracranial cavity (ICC) and subclasses of white matter (WM), gray matter (GM), cerebrospinal fluid (CSF), and WM signal abnormalities (WMSA). Brain parenchymal fraction (BPF) was defined as BPF=(1-CSF)/ICC. Medical image data were visualized by 3D Slicer to provide QC for original grayscale data, segmented output and perform manual correction of ICC. Funding:
|
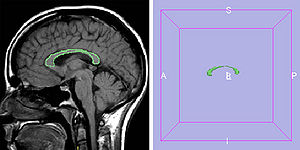 Corpus callosum (CC) measures were obtained from Mid-sagittal T1-weighted MRI scans by manually tracing the outer edge of the corpus callosum on the midsagittal slice using 3D Slicer software. |
Harvard Research Nursing Home Project (MOBILIZE study)
|
Principal Investigator: Lewis A. Lipsitz Institution: Institute for Aging Research (IFAR), Harvard Medica School, Boston, MA, USA. Background/Purpose: The project focuses on abnormal blood pressure regulation and its relationship to the development of falls and syncope in the elderly. 3D Slicer was used to provide visualization during QC step of original data (1.5T and 3T), segmented output and perform manual correction on required steps of processing pipeline as well as corpus callosum outline for parcellation. |
Daclizumab Use in Patients with Pediatric Multiple Sclerosis Failing Interferon
|
Principal Investigator: Tanuja Chitnis Institution: Partners Pediatric MS Center Background/Purpose: We used quantitative MRI parameters such as T2 lesion volume (T2LV) to assess treatment in patients with POMS. The T2-lesion volume of the brain was manually outlined using 3D Slicer. Funding:
|
MRI findings of pediatric-onset Multiple Sclerosis patients: a retrospective study
|
Principal Investigator: Tanuja Chitnis Institution: Partners Pediatric MS Center Background/Purpose: To assess differences in MRI-derived lesion volume and brain parenchymal fraction (BPF) between patients with pediatric- and adult-onset Multiple Sclerosis (MS). T2 lesion volume and BPF were measured using template-driven segmentation (TDS+) algorithm by automated pipeline of the Multiple Sclerosis Database Project. Medical image data were visualized by 3D Slicer to provide QC for original data, segmented output and perform manual correction on required steps of processing pipeline. Funding:
|
Pediatric MS MRI Pilot Project
|
Principal Investigator: Tanuja Chitnis Institution: Partners Pediatric MS Center Background/Purpose: The goal of this project is to assess the characteristics of the pediatric MS patient population and increase education and awareness of this disease subtype. 3D Slicer is used to QC MRI images coming to the multi-center MRI data repository at the Center for Neurological Imaging (CNI) at Brigham and Women’s Hospital. Funding:
|
The Multiple Sclerosis Database Project
|
Institution: Multiple Sclerosis Center Background/Purpose: Project is an initiative to design, develop and implement a database system integrating all aspects of clinical data with medical image data. This image-centric database will enable users to visualize clinical data, including laboratory results, immunologic data, and examination scores, simultaneously with that individual’s MRI images. By integrating the medical images and clinical patient data in a comprehensive system, the efficiency of patient care and data analysis is dramatically improved. This database is another small step towards our ultimate goal: Finding a cure for MS. Image Workflow system based on Standard Operation Procedures/Modules in Database system to allow the day-to-day management and query from data fields to ensure that trial was performed according to SOPs by managing the efforts of MRI research personnel, quality control of data, image analysis and image processing as a part of quantitative pipeline for trial. 3D Slicer advanced image visualization package is used for visualization and analysis MRI data to provide T2 lesion volume and BPF volumetric measurements. |
Effects of Strain Thresholds on Bone Formation in Response to Mechanical Loading
|
Publication: TBA Authors: Thiagarajan G, Johnson M, Dallas M, Lu Y. Institution: University of Missouri-Kansas City, KS, USA. Background/Purpose: It has been hypothesized that osteocytes are stimulated by local strain distribution within the bone subjected to mechanical loadings. In this research project, the mouse forearm model was built which was later used for extensive finite element study. The study will be the first in the field to include the radius in the numerical analysis to examine its effect on the load distribution between the ulna/radius. In order to preserve the geometrical details of the bones, the cavities were traced independently. Then a 3D volume subtraction was performed in another software to produce the exact CAD model of the bone structure. The results of the current research are expected to shed light on how bone perceives mechanical load and the pathway whereby the physical load is transduced into a biochemical event and eventually results in new bone formation. The study will help in developing new treatments for bone diseases such as osteoporosis. Funding:
|
Automated Ventricular Systems Segmentation in Brain CT Images by Combining Low-level Segmentation and High-level Template Matching
|
Publication: BMC Med Inform Decis Mak. 2009 Nov 3;9 Suppl 1:S4. PMID: 19891798 | PDF Authors: Chen W, Smith R, Ji SY, Ward KR, Najarian K. Institution: Department of Computer Science, Virginia Commonwealth University, Richmond, VA, USA. Background/Purpose: Accurate analysis of CT brain scans is vital for diagnosis and treatment of Traumatic Brain Injuries (TBI). Automatic processing of these CT brain scans could speed up the decision making process, lower the cost of healthcare, and reduce the chance of human error. In this paper, we focus on automatic processing of CT brain images to segment and identify the ventricular systems. The segmentation of ventricles provides quantitative measures on the changes of ventricles in the brain that form vital diagnosis information. |
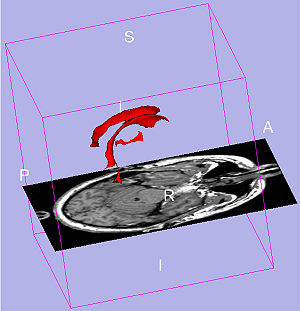 3D ventricle model from 3D Slicer sample visualization. The red parts are ventricular system model. Two symmetrical lateral ventricles on each side in normal case. The lower part in the middle is the third ventricle. The fourth ventricle is the lowest part which is not considered in our paper, but it can be included following the method in this paper. |
MRI-derived Measurements of Human Subcortical, Ventricular and Intracranial Brain Volumes: Reliability Effects of Scan Sessions, Acquisition Sequences, Data Analyses, Scanner Upgrade, Scanner Vendors and Field Strengths
|
Publication: Neuroimage. 2009 May 15;46(1):177-92. PMID: 19233293 | PDF Authors: Jovicich J, Czanner S, Han X, Salat D, van der Kouwe A, Quinn B, Pacheco J, Albert M, Killiany R, Blacker D, Maguire P, Rosas D, Makris N, Gollub R, Dale A, Dickerson BC, Fischl B. Institution: Center for Mind-Brain Sciences, Department of Cognitive and Education Sciences, University of Trento, Italy. Background/Purpose: Automated MRI-derived measurements of in-vivo human brain volumes provide novel insights into normal and abnormal neuroanatomy, but little is known about measurement reliability. Here we assess the impact of image acquisition variables (scan session, MRI sequence, scanner upgrade, vendor and field strengths), FreeSurfer segmentation pre-processing variables (image averaging, B1 field inhomogeneity correction) and segmentation analysis variables (probabilistic atlas) on resultant image segmentation volumes from older (n=15, mean age 69.5) and younger (both n=5, mean ages 34 and 36.5) healthy subjects. The variability between hippocampal, thalamic, caudate, putamen, lateral ventricular and total intracranial volume measures across sessions on the same scanner on different days is less than 4.3% for the older group and less than 2.3% for the younger group. Within-scanner measurements are remarkably reliable across scan sessions, being minimally affected by averaging of multiple acquisitions, B1 correction, acquisition sequence (MPRAGE vs. multi-echo-FLASH), major scanner upgrades (Sonata-Avanto, Trio-TrioTIM), and segmentation atlas (MPRAGE or multi-echo-FLASH). Volume measurements across platforms (Siemens Sonata vs. GE Signa) and field strengths (1.5 T vs. 3 T) result in a volume difference bias but with a comparable variance as that measured within-scanner, implying that multi-site studies may not necessarily require a much larger sample to detect a specific effect. These results suggest that volumes derived from automated segmentation of T1-weighted structural images are reliable measures within the same scanner platform, even after upgrades; however, combining data across platform and across field-strength introduces a bias that should be considered in the design of multi-site studies, such as clinical drug trials. The results derived from the young groups (scanner upgrade effects and B1 inhomogeneity correction effects) should be considered as preliminary and in need for further validation with a larger dataset. Funding:
|
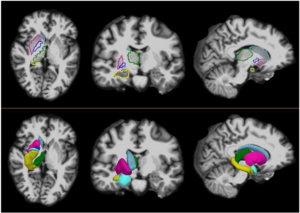 Sample color-coded subcortical segmentation results (right hemisphere only): hippocampus (yellow), thalamus (green), caudate (light blue), putamen (pink), pallidum (dark blue) and amygdala (turquoise). Top: Freesurfer derived subcortical labels, from a two-averaged MPRAGE in axial (left), coronal (center) and sagittal (right) views. Bottom: 3D surface models created with 3D Slicer derived from the Freesurfer subcortical segmentations. |
Integration of the Vascular Modeling Toolkit in 3D Slicer
|
Publication: Student Research Project 2009 Apr; | PDF Author: Daniel Hähn Institution: Medical Informatics, University of Heidelberg, Germany. Background/Purpose: The extraction of vessels in two- and three-dimensional images is part of many clinical analysis tasks. Surgical and radiology procedures often involve the visualization and quantification of vessels in order to perform surgical planning or diagnostics. There is no single segmentation method that can extract vessels from every medical image modality, but different approaches and robust algorithms exist. Various published key algorithms are available within an open-source framework for image-based modeling of blood vessels, referred to as the Vascular Modeling Toolkit (VMTK). The library of VMTK was made available in 3D Slicer, an application providing a wide range of tools for medical image processing. This was realized using a hidden loadable module approach in order to provide a flexible way of distributing and including the library. To evaluate and verify the integration, a software module offering VMTK level set segmentation methods within 3D Slicer was created. With the successful connection of the two above mentioned software solutions, processing pipelines between VMTK code and other algorithms can be established. Several techniques for three dimensional reconstruction, geometric analysis, mesh generation and surface data analysis for image-based modeling of blood vessels are now accessible to the 3D Slicer developer. The reference implementation for accessing VMTK, as well as the created library module are available as open-source software. Funding:
|
New EMSegment Module in Slicer3
|
Publication: Insight Journal, Sep 15, 2009. Authors: Rannou N, Jaume S, Pieper S, Kikinis R. Institution: ISEN Brest, France. Background/Purpose: Many neuroanatomy studies rely on brain tissue segmentation in Magnetic Resonance images (MRI). The Expectation-Maximization (EM) theory offers a popular framework for this task. We studied the EM algorithm developed at the Surgical Planning Laboratory (SPL) at Harvard Medical School and implemented in the 3D Slicer software. We observed that the segmentation lacks accuracy if the image exhibits some intensity inhomogeneity. Moreover the optimum parameters are challenging to estimate. This document aims at describing our solutions within the context of statistical modeling. Our contributions range from algorithm improvements to novel representations of the statistical distribution model. First we added a bias field correction module and exposed the most significant parameters. Second we proposed a new way to select the distribution of the tissues to be segmented. Finally we designed a set of interactive tools to make the segmentation process easier and more accurate. To validate the new segmentation pipeline, we performed our experiments on MRI data and a clinical expert evaluated our results. Funding:
|
 New EMSegment Module in Slicer3. We improved the usability of EMSegment in a clinical setting and studied the influence of MRI Bias Field Correction on the segmentation accuracy. |
|
Publication: The International Journal of Virtual Reality, 2009, 8(1):9-16. | PDF Authors: Tran HH, Matsumiya K, Masamune K, Sakuma I, Dohi T, Liao H. Institution: Graduate School of Information Science and Technology, University of Tokyo, Tokyo, Japan. Background/Purpose: In this paper, we mainly focus on a high-speed IV rendering method that allows interactions to be done in almost real-time, while maintaining the rendered result at an acceptable quality. We also built a navigation system based on the open source software, 3D Slicer, so that many tasks can be done in a single application. Funding:
|
Smaller Amygdala is Associated with Anxiety in Patients with Panic Disorder
|
Publication: Psychiatry and Clinical Neurosciences 2009; 63:266-76. PMID: 19566756 | PDF Authors: Hayano F, Nakamura M, Asami T, Uehara K, Yoshida T, Roppongi T, Otsuka T, Inoue T, Hirayasu Y. Institution: Department of Psychiatry, Yokohama City University, Yokohama, Kanagawa, Japan. Background/Purpose: Anxiety a core feature of panic disorder, is linked to function of the amygdala. Volume alterations in the brain of patients with panic disorder have previously been reported, but there has been no report of amygdala volume association with anxiety. Methods: Volumes of hippocampus and amygdala were manually measured using magnetic resonance imaging obtained from 27 patients with panic disorder and 30 healthy comparison subjects. In addition the amygdala was focused on, applying small volume correction to optimized voxel-based morphometry (VBM). State-Trait Anxiety Inventory and the NEO Personality Inventory Revised were also used to evaluate anxiety. Amygdala volumes in both hemispheres were significantly smaller in patients with panic disorder compared with control subjects (left: t = -2.248, d.f. = 55, P = 0.029; right: t = -2.892, d.f. = 55, P = 0.005). VBM showed that structural alteration in the panic disorder group occurred on the corticomedial nuclear group within the right amygdala (coordinates [x,y,z (mm)]: [26,-6,-16], Z score = 3.92, family-wise error-corrected P = 0.002). The state anxiety was negatively correlated with the left amygdala volume in patients with panic disorder (r = -0.545, P = 0.016). These findings suggested that the smaller volume of the amygdala may be associated with anxiety in panic disorder. Of note, the smaller subregion in the amygdala estimated on VBM could correspond to the corticomedial nuclear group including the central nucleus, which may play a crucial role in panic attack. Funding:
|
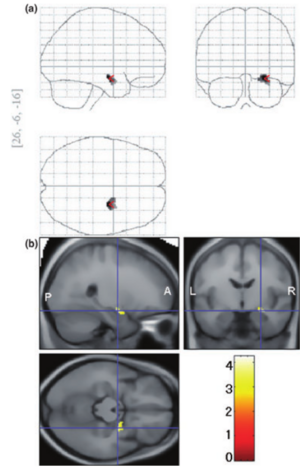 Voxels with a significant decrease in region of amygdala area among panic disorder (PD) patients compared with healthy control (HC) subjects. (a) statistical parametric map showing significantly smaller subregion within the amygdala. (b) The same statistical parametric map overlayed on a structural volume. |
Optimal Transseptal Puncture Location for Robot-assisted Left Atrial Catheter Ablation
|
Publication: Int Conf Med Image Comput Comput Assist Interv. 2009;12(Pt 1): 1-8. PMID: 20425964 | PDF Authors: Jayender J, Patel RV, Michaud GF, Hatal N. Institution: Brigham and Women’s Hospital, Harvard Medical School, Boston, MA, USA.
Funding:
|
 The result of the GII algorithm displayed as a color map on the septal wall. The color blue represents the GII with highest value, which correspond to the optimal port, while red represents a low value of GII. Discrete points on the septal wall which provide the maximum maneuverability of the catheter within the left atrium. |
Measurements from Image-based Three Dimensional Pelvic Floor Reconstruction: A Study of Inter- and Intraobserver Reliability
|
Publication: J Magn Reson Imaging. 2009 Aug;30(2):344-50. PMID: 19629987 | PDF Authors: Hoyte L, Brubaker L, Fielding JR, Lockhart ME, Heilbrun ME, Salomon CG, Ye W, Brown MB; Pelvic Floor Disorders Network. Institution: University of South Florida, College of Medicine, Division of Urogynecology and Pelvic Reconstructive Surgery, Tampa General Hospital, Urogynecology Division, Tampa, FL, USA. Background/Purpose: To describe inter- and intraobserver reliability of 3D measurements of female pelvic floor structures. Twenty reconstructed MR datasets of primiparas at 6-12 months postpartum were analyzed. Pelvic organ measurements were independently made twice by three radiologists blinded to dataset order. A "within-reader" analysis, a "between-reader" analysis, and the intraclass correlation (ICC), and standard deviation ratio (SDR) were computed for each parameter. Fifteen continuous variables and one categorical variable were measured. Eight continuous parameters showed excellent agreement (ICC >0.85 / SDR <0.40), five parameters showed relatively good agreement (ICC >0.70 / SDR >or=0.40, <0.60). Two parameters showed poor agreement (ICC <or=0.70 and/or SDR >or=0.60). The categorical variable showed poor agreement. Agreement was best where landmark edges were well defined, acceptable where more "reader judgment" was needed, and poor where levator defects made landmarks difficult to identify. Automated measurement algorithms are under study and may improve agreement in the future. Funding:
|
Three-dimensional Analysis of Rodent Paranasal Sinus Cavities from X-ray Computed Tomography (CT) Scans
|
Publication: Can J Vet Res. 2009 Jul;73(3):205-11. PMID: 19794893 | PDF Authors: Phillips JE, Ji L, Rivelli MA, Chapman RW, Corboz MR. Institution: Pulmonary and Peripheral Neurobiology, Schering-Plough Research Institute, Kenilworth, NJ, USA. Background/Purpose: Continuous isometric microfocal X-ray computed tomography (CT) scans were acquired from an AKR/J mouse, Brown-Norway rat, and Hartley guinea pig. The anatomy and volume of the paranasal sinus cavities were defined from 2-dimensional (2-D) and 3-dimensional (3-D) CT images. Realistic 3-D images were reconstructed and used to determine the anterior maxillary, posterior maxillary, and ethmoid sinus cavity airspace volumes (mouse: 0.6, 0.7, and 0.7 mm3, rat: 8.6, 7.7, and 7.0 mm3, guinea pig: 63.5, 46.6 mm3, and no ethmoid cavity, respectively). The mouse paranasal sinus cavities are similar to the corresponding rat cavities, with a reduction in size, while the corresponding maxillary sinus cavities in the guinea pig are different in size, location, and architecture. Also, the ethmoid sinus cavity is connected by a common drainage pathway to the posterior maxillary sinus in mouse and rat while a similar ethmoid sinus was not present in the guinea pig. We conclude that paranasal sinus cavity airspace opacity (2-D) or volume (3-D) determined by micro-CT scanning may be used to conduct longitudinal studies on the patency of the maxillary sinus cavities of rodents. This represents a potentially useful endpoint for developing and testing drugs in a small animal model of sinusitis. Funding:
|
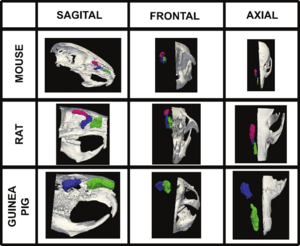 Volumetric surface renderings of paranasal sinus created from sequential computed tomography (CT) images. Three different orientations of the paranasal sinuses (anterior maxillary in green, posterior maxillary in blue, and anterior ethmoid in red) are shown with respect to location in skull according to species, all at different magnifications. |
Multimodal Imaging in Mild Cognitive Impairment: Metabolism, Morphometry and Diffusion of the Temporal–parietal Memory Network
|
Publication: Neuroimage. 2009 Mar 1;45(1):215-23. PMID: 19056499 | PDF Authors: Walhovd KB, Fjell AM, Amlien I, Grambaite R, Stenset V, Bjørnerud A, Reinvang I, Gjerstad L, Cappelen T, Due-Tønnessen P, Fladby T. Institution: Center for the Study of Human Cognition, Department of Psychology, University of Oslo, Norway. Background/Purpose: This study compared sensitivity of FDG-PET, MR morphometry, and diffusion tensor imaging (DTI) derived fractional anisotropy (FA) measures to diagnosis and memory function in mild cognitive impairment (MCI). Patients (n = 44) and normal controls (NC, n = 22) underwent FDG-PET and MRI scanning yielding measures of metabolism, morphometry and FA in nine temporal and parietal areas affected by Alzheimer's disease and involved in the episodic memory network. Patients also underwent memory testing (RAVLT). Logistic regression analysis yielded 100% diagnostic accuracy when all methods and ROIs were combined, but none of the variables then served as unique predictors. Within separate ROIs, diagnostic accuracy for the methods combined ranged from 65.6% (parahippocampal gyrus) to 73.4 (inferior parietal cortex). Morphometry predicted diagnostic group for most ROIs. PET and FA did not uniquely predict group, but a trend was seen for the precuneus metabolism. For the MCI group, stepwise regression analyses predicting memory scores were performed with the same methods and ROIs. Hippocampal volume and FA of the retrosplenial WM predicted learning, and hippocampal metabolism and parahippocampal cortical thickness predicted 5 minute recall. No variable predicted 30 minute recall independently of learning. In conclusion, higher diagnostic accuracy was achieved when multiple methods and ROIs were combined, but morphometry showed superior diagnostic sensitivity. Metabolism, morphometry and FA all uniquely explained memory performance, making a multi-modal approach superior. Memory variation in MCI is likely related to conversion risk, and the results indicate potential for improved predictive power by the use of multimodal imaging. Funding:
|
 Illustrations of the main steps in the multi-modal image analysis. (A and B) The brain surface is parcellated into 34 different regions in each hemisphere (B), and a newly developed algorithm assigns a label to each underlying WM voxel (A). (C) Five cortical ROI's and hippocampus, of much importance in the episodic memory network, were chosen for analyses in the present paper. EC — entorhinal cortex; PH — parahippocampal cortex; RC — retrosplenial cortex; PC — posterior cingulate; Pre — precuneus. (D) Every voxel in each brain volume is assigned a label based on the cortical parcellations (A), the WM parcellations (B), and the whole-brain segmentation. The distance between the red and the yellow line is the cerebral cortex. (E) The FA volume is registered to the anatomical volume, and mean FA is calculated from the voxels included in each WM ROI (A). (F) FDG-PET data are also registered to the anatomical volume, and the metabolism is divided by the metabolism in the brainstem. Mean metabolism in each cortical ROI and hippocampus is calculated. (G) The whole-brain segmentation yields hippocampal volume (hippocampus is marked in yellow, indicated by the red arrows). A three-dimensional rendering of hippocampus is shown to illustrate the result of the segmentation. |
The Relation between Connection Length and Degree of Connectivity in Young Adults: A DTI Analysis
|
Publication: Cereb Cortex. 2009 Mar;19(3):554-62. PMID: 18552356 | PDF Authors: Lewis JD, Theilmann RJ, Sereno MI, Townsend J. Institution: Department of Cognitive Science, University of California-San Diego, La Jolla, CA, USA. Background/Purpose: Using diffusion tensor imaging and tractography to detail the patterns of interhemispheric connectivity and to determine the length of the connections, and formulae based on histological results to estimate degree of connectivity, we show that connection length is negatively correlated with degree of connectivity in the normal adult brain. The degree of interhemispheric connectivity - the ratio of interhemispheric connections to total corticocortical projection neurons - was estimated for each of 5 subregions of the corpus callosum in 22 normal males between 20 and 45 years of age (mean 31.68; standard deviation 8.75), and the average length of the longest tracts passing through each point of each subregion was calculated. Regression analyses were used to assess the relation between connection length and the degree of connectivity. Connection length was negatively correlated with degree of connectivity in all 5 subregions, and the regression was significant in 4 of the 5, with an average r(2) of 0.255. This is contrasted with previous analyses of the relation between brain size and connectivity, and connection length is shown to be a superior predictor. The results support the hypothesis that cortical networks are optimized to reduce conduction delays and cellular costs. Funding:
|
The ROBOCAST Project: ROBOt and Sensors Integration for Computer Assisted Surgery and Therapy
|
Authors: Shamir RR, Joskowicz L, Ferrigno G. Institution: School of Engineering and Computer Science, The Hebrew University of Jerusalem, Israel. Background/Purpose: The goal of the European FP7 ROBOCAST project is to develop a system for keyhole neurosurgery. ROBOCAST integrates optical and electromagnetic localization devices with two modified commercial surgical robots: 1. PathFinder (Prosurgics Ltd, UK), which is used for gross positioning, and; 2. MARS (Mazor Surgical Technologies Ltd, Israel), which is used for fine positioning. A third snake-like robot, currently under development, will be attached to the MARS robot and is intended for curved paths. The system includes as well a haptic device, a tracked ultrasound probe and a micro Doppler ultrasound probe. This sensor and actuation redundancy is expected to yield higher accuracy and robustness, to significantly increase the patient safvety, and to allow new procedures. The ROBOCAST software is based on 3D Slicer 3.4 and uses many of its functions. Funding:
|
A Trajectory Planning Method for Reduced Patient Risk in Image-guided Neurosurgery: Preliminary Results
|
Authors: Shamir RR, Roth R, Joskowicz L, Antiga L, Foroni RI, Shoshan Y. Institution: School of Engineering and Computer Science, The Hebrew University of Jerusalem, Israel. Background/Purpose: We present a new preoperative planning method to better assess and reduce the risk caused by a misplacement of surgical tools in image-guided keyhole neurosurgery. The goal is to quantify the risk of a proposed straight trajectory and to find the trajectory with the lowest risk to hit nearby brain structures based on pre-operative CT/MRI images and their segmentation. First, distance maps are computed on the segmented data such that each voxel on the preoperative CT/MRI image is associated with a vector of distances to each of the segmented structures. A risk volume is then created from the distance maps such that a risk ratio is computed based on the vector of distances associated with each voxel. Next, the risk for each possible trajectory is computed such that the risk along a trajectory is assigned with the maximal risk ratio of intersected voxels. The trajectory that is associated with the lowest risk is presented using 3D Slicer v.3.2 to the neurosurgeon for further revision. The neurosurgeon can revise the suggested trajectory and can add new paths using interactive 3D visualization and quantitative risk assessment. The interactive 3D visualization shows the segmented structures to be avoided along with a geometric structure that envelopes the defined trajectory and represents the localization uncertainty. In addition, candidate entry points are represented by the outer head surface that is extracted automatically from the patient’s preoperative image and the neurosurgeon can select parts of the surface to restrict the optional entry points. A table, called ‘risk card’, of quantitative measures regarding the risk that is associated with the defined trajectory is presented. It shows the neurosurgeon meaningful geometrical information, including the path length and distance of segmented structures to the path. For the initial validation, we have compared the conventional approach for trajectory planning with our method on 8 targets selected at various locations on a clinical Magnetic Resonance Angiography (MRA) head image. For each target, the user selected two trajectories: one with the conventional method based on the axial, sagittal, and coronal 2D views of the original MRA image, and the second with our method. Our preliminary results show a significant reduction in trajectory risk and planning time when compared to the conventional method. Funding:
|
Contrast-maximizing Adaptive Region Growing for CT
|
Publication: Poster Presentation at the Second International Workshop on Pulmonary Image Analysis. | Poster, Paper. Oral Presentation at Advanced Concepts for Intelligent Vision Systems, ACIVS 2009. Authors: Mendoza CS, Acha B, Serrano C. Institution: Signal Processing Department, University of Sevilla, Spain. Background/Purpose: We have developed a general segmentation framework based on a contrast-based self-assessed region growing strategy. Thanks to a previous normalization stage, a wide variety of CT imaging conditions are supported, requiring limited user intervention. Although multiple seeds are accepted for performance boosting, only a single-seed selection stage is required for most of our application specific tissues. The detection of the optimal parameters is managed internally using a measure of the varying contrast of the growing region. Validation is provided for some synthetic images, and also for real CT images. Results have been obtained in the context of surgical planning (bone, muscle and fat segmentation) and pulmonary image analysis (airway segmentation). Funding:
|
Computer-aided 3D Visualization in Oto-rhino-laryngology
|
Publication: Poster Presentation at the 80th Conference of the German ENT Society. | PDF Authors: Nagy AL, Tanács A, Czesznak A, Smehák Gy, Tóth F, Rovó L, Jóri J, Kiss JG. Institution: Department of Oto-rhino-laryngology and Head, Neck Surgery, University of Szeged, Hungary. Background/Purpose: Most of the CT and MR data is stored nowadays on digital media. This opens up new possibilities for us to inspect these data. In our department we evaluated the use of the 3D Slicer software, a free, open source and is being actively developed. In oto-rhino-laryngology we often encounter situations where the exact localization and estimation of the size of a lesion, or tumor is of critical importance. Especially in the neck and the facial region an extended resection may easily cause damage to the function of the affected organ. The preservation of the swallowing function in case of the neck, and the preservation of sight in interventions around the orbita are two of these areas. By visualizing these space-occupying lesions we were able to plan and carry out the surgery more precisely. |
Clinical Application of Curvilinear Distraction Osteogenesis for Correction of Mandibular Deformities
|
Publication: J Oral Maxillofac Surg. 2009 May;67(5):996-1008. PMID: 19375009 | PDF Authors: Kaban LB, Seldin EB, Kikinis R, Yeshwant K, Padwa BL, Troulis MJ. Institution: Department of Oral and Maxillofacial Surgery, Massachusetts General Hospital, Harvard School of Dental Medicine, Boston, MA, USA. Background/Purpose: To report the use of a semiburied curvilinear distraction device, with a 3-dimensional (3D) computed tomography treatment planning system, for correction of mandibular deformities. This was a retrospective evaluation of 13 consecutive patients, with syndromic and nonsyndromic micrognathia, who underwent correction by curvilinear distraction osteogenesis. A 3D computed tomography scan was obtained for each patient and imported into a 3D treatment planning system (Slicer/Osteoplan). Surgical guides were constructed to localize the osteotomy and to drill holes to secure the distractor's proximal and distal footplates to the mandible. Postoperatively, patients were followed by clinical examination and plain radiographs to ensure the desired vector of movement. At end distraction, when possible, a 3D computed tomography scan was obtained to document the final mandibular position. Of the 13 patients, 8 were females and 5 were males, with a mean age of 11.9 years (range 15 months to 39 years). All 13 underwent bilateral mandibular curvilinear distraction. Of the 13 patients, 8 were 16 years old or younger and 5 were younger than 6 years of age. The diagnoses included Treacher Collins syndrome (n = 3), Nager syndrome (n = 3), craniofacial microsomia (n = 2), post-traumatic ankylosis (n = 1), and micrognathia (syndromic, n = 3; nonsyndromic, n = 1). The correct distractor placement, vector of movement, and final mandibular position were achieved in 10 of 13 patients. In the other 3 patients, the desired jaw position was achieved by "molding" the regenerate. The use of a semiburied curvilinear distraction device, with 3D treatment planning, is a potentially powerful tool to correct complex mandibular deformities. Funding:
|
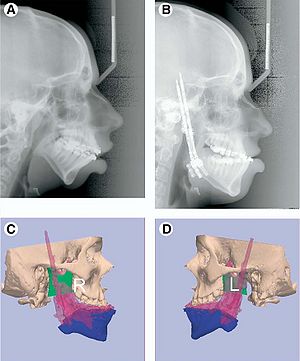 A, Preoperative and B, end-distraction lateral cephalograms. (Patient in Fig 4.) Posterior airway space increased from 5.03 to 18.96 mm and distance from hyoid to mandible decreased from 19.3 to 12.9 mm (normal values 11 mm and Ͻ15 mm, respectively). Overlay of predicted (blue) and end-fixation (pink) position of C, right and D, left sides of mandible demonstrating desired movement was achieved. |
In Vivo Hippocampal Measurement and Memory: A Comparison of Manual Tracing and Automated Segmentation in a Large Community-Based Sample
|
Publication: PLoS One. 2009 Apr; 4(4):e5265. PMID: 19370155 | PDF Authors: Cherbuin N, Anstey KJ, Réglade-Meslin C, Sachdev PS. Institution: Centre for Mental Health Research, Australian National University, Canberra, Australia. Background/Purpose: Each segmented volume was inspected by producing a 3D model using the 3D Slicer software package and its quality rated: a) no or minor defects (estimated to be smaller than ,0.5% of total volume) b) moderate defects (,0.5-5% of total volume), major defects (greater than 5% of total volume). Exemplars are given in Figure 1. Funding:
|
How Volumetric Analysis Quantifies Therapeutic Response of Slow-flow Vascular Malformations
|
Publication: ECR Today 2009 Mar 9. | PDF Authors: Dobrocky T, Kubiena H, Kikinis R, Kettenbach J. Institution: Medical University of Vienna, Austria. Background/Purpose: Slow-flow vascular malformations, such as venous and lymphatic lesions, are most often recognised in infancy and are thus characterised by a rapid expansion. The majority of these lesions are found in the head and neck region, where many options for treatment modalities (drug therapy, percutaneous sclerotherapy, surgical resection) have been reported in the literature. In many cases, excellent results have been achieved by ultrasound-guided or fluoroscopy-guided percutaneous sclerotherapy, sometimes combined with final surgical resection (see figure). Diagnostic MRI of vascular malformations allows non-invasive treatment planning and follow-up, with excellent soft-tissue contrast. |
A Minimally Invasive Registration Method using Surface Template-assisted Marker Positioning (STAMP) for Image-guided Otologic Surgery
|
Publication: Otolaryngol Head Neck Surg. 2009 Jan;140(1):96-102. PMID: 19130970 | PDF Authors: Matsumoto N, Hong J, Hashizume M, Komune S. Institution: Department of Otorhinolaryngology, Graduate School of Medical Sciences, Kyushu University, Fukuoka, Japan. Background/Purpose: A new, minimally invasive registration method was developed for image-guided otologic surgery. We utilized laser-sintered template of the patient's bone surface to transfer the virtual markers to the patient's bone intraoperatively and eliminated the necessity for preoperative marker positioning or additional CT scan. Simulation surgeries and clinical application. We measured registration errors in 10 trials using replicas and six ear surgeries (two cochlear implant insertions, four translabyrinthine acoustic tumor removals). The target registration errors varied among the surgical targets. Errors were less than 1 mm near the cochlear implant insertion target both in phantom study and in actual surgeries. Our newly developed method reduced the preoperative procedures for patients but did not reduce the accuracy in cochlear implant surgery. Our method would be a useful image-guided surgery method in the field of otology, where both accuracy and noninvasiveness are required. Funding:
|
 The IGS screen during surgery. (A) The navigation view of the surgery during cochleostomy. Red, facial nerve; light green, semicircular canals; orange, cochlea; green, drill. (B) The navigation view of the surgery during translabyrinthine approach to the internal auditory canal. The surgeon is now pointing to target “SA” of Table 2. Red, facial nerve; orange, semicircular canals; light green, internal auditory canal; pink, sigmoid sinus and jugular bulb; green, drill with 10-mm extension marks. |
Diffusion Tractography of the Fornix in Schizophrenia
|
Publication: Schizophr Res. 2009 Jan;107(1):39-46. PMID: 19046624 | PDF Authors: Fitzsimmons J, Kubicki M, Smith K, Bushell G, Estepar RS, Westin CF, Nestor PG, Niznikiewicz MA, Kikinis R, McCarley RW, Shenton ME. Institution: Psychiatry Neuroimaging Laboratory, Department of Psychiatry, Brigham and Women's Hospital, Harvard Medical School, Boston, MA, USA. Background/Purpose: White matter fiber tracts, especially those interconnecting the frontal and temporal lobes, are likely implicated in pathophysiology of schizophrenia. Very few studies, however, have focused on the fornix, a compact bundle of white matter fibers, projecting from the hippocampus to the septum, anterior nucleus of the thalamus and the mamillary bodies. Diffusion Tensor Imaging (DTI), and a new post-processing method, fiber tractography, provides a unique opportunity to visualize and to quantify entire trajectories of fiber bundles, such as the fornix, in vivo. We applied these techniques to quantify fornix diffusion anisotropy in schizophrenia. DTI images were used to evaluate the left and the right fornix in 36 male patients diagnosed with chronic schizophrenia and 35 male healthy individuals, group matched on age, parental socioeconomic status, and handedness. Regions of interest were drawn manually, blind to group membership, to guide tractography, and fractional anisotropy (FA), a measure of fiber integrity, was calculated and averaged over the entire tract for each subject. The Doors and People test (DPT) was used to evaluate visual and verbal memory, combined recall and combined recognition. Analysis of variance was performed and findings demonstrated a difference between patients with schizophrenia and controls for fornix FA (p=0.006). Protected post-hoc independent sample t-tests demonstrated a bilateral FA decrease in schizophrenia, compared with control subjects (left side: p=0.048; right side p=0.006). Higher fornix FA was statistically significantly correlated with DPT and measures of combined visual memory (r=0.554, p=0.026), combined verbal memory (r=0.647, p=0.007), combined recall (r=0.516, p=0.041), and combined recognition (r=0.710, p=0.002) for the control group. No such statistically significant correlations were found in the patient group. Our findings show the utility of applying DTI and tractography to study white matter fiber tracts in vivo in schizophrenia. Specifically, we observed a bilateral disruption in fornix integrity in schizophrenia, thus broadening our understanding of the pathophysiology of this disease. Funding:
|
Spiny Versus Stubby: 3D Reconstruction of Human Myenteric (type I) Neurons
|
Publication: Histochem Cell Biol. 2009 Jan;131(1):1-12. PMID: 18807064 | PDF Authors: Lindig TM, Kumar V, Kikinis R, Pieper S, Schrödl F, Neuhuber WL, Brehmer A. Institution: Department of Anatomy I, University of Erlangen-Nuremberg, Erlangen, Germany. Background/Purpose: We have compared the three-dimensional (3D) morphology of stubby and spiny neurons derived from the human small intestine. After immunohistochemical triple staining for leu-enkephalin (ENK), vasoactive intestinal peptide (VIP) and neurofilament (NF), neurons were selected and scanned based on their immunoreactivity, whether ENK (stubby) or VIP (spiny). For the 3D reconstruction, we focused on confocal data pre-processing with intensity drop correction, non-blind deconvolution, an additional compression procedure in z-direction, and optimizing segmentation reliability. 3D Slicer software enabled a semi-automated segmentation based on an objective threshold (interrater and intrarater reliability, both 0.99). We found that most dendrites of stubby neurons emerged only from the somal circumference, whereas in spiny neurons, they also emerged from the luminal somal surface. In most neurons, the nucleus was positioned abluminally in its soma. The volumes of spiny neurons were significantly larger than those of stubby neurons (total mean of stubbies 806±128 μm3, of spinies 2,316±545 μm3), and spiny neurons had more dendrites (26.3 vs. 11.3). The ratios of somal versus dendritic volumes were 1:1.2 in spiny and 1:0.3 in stubby neurons. In conclusion, 3D reconstruction revealed new differences between stubby and spiny neurons and allowed estimations of volumetric data of these neuron populations. Funding:
|
2008
|
Publication: Int J Med Robot. 2008 Dec;4(4):321-30. PMID: 18803337 | PDF Authors: Xia T, Baird C, Jallo G, Hayes K, Nakajima N, Hata N, Kazanzides P. Institution: Department of Computer Science, Johns Hopkins University, Baltimore, MD, USA. Background/Purpose: We developed an image-guided robot system to provide mechanical assistance for skull base drilling, which is performed to gain access for some neurosurgical interventions, such as tumour resection. The motivation for introducing this robot was to improve safety by preventing the surgeon from accidentally damaging critical neurovascular structures during the drilling procedure. We integrated a Stealthstation((R)) navigation system, a NeuroMate((R)) robotic arm with a six-degree-of-freedom force sensor, and the 3D Slicer visualization software to allow the robotic arm to be used in a navigated, cooperatively-controlled fashion by the surgeon. We employed virtual fixtures to constrain the motion of the robot-held cutting tool, so that it remained in the safe zone that was defined on a preoperative CT scan. We performed experiments on both foam skull and cadaver heads. The results for foam blocks cut using different registrations yielded an average placement error of 0.6 mm and an average dimensional error of 0.6 mm. We drilled the posterior porus acusticus in three cadaver heads and concluded that the robot-assisted procedure is clinically feasible and provides some ergonomic benefits, such as stabilizing the drill. We obtained postoperative CT scans of the cadaver heads to assess the accuracy and found that some bone outside the virtual fixture boundary was cut. The typical overcut was 1-2 mm, with a maximum overcut of about 3 mm. The image-guided cooperatively-controlled robot system can improve the safety and ergonomics of skull base drilling by stabilizing the drill and enforcing virtual fixtures to protect critical neurovascular structures. The next step is to improve the accuracy so that the overcut can be reduced to a more clinically acceptable value of about 1 mm. Funding:
|
The Relationship between Diffusion Tensor Imaging and Volumetry as Measures of White Matter Properties
|
Publication: Neuroimage. 2008 Oct 1;42(4):1654-68. PMID: 18620064 | PDF Authors: Fjell AM, Westlye LT, Greve DN, Fischl B, Benner T, van der Kouwe AJ, Salat D, Bjørnerud A, Due-Tønnessen P, Walhovd KB. Institution: Center for the Study of Human Cognition, Department of Psychology, University of Oslo, Norway. Background/Purpose: There is still limited knowledge about the relationship between different structural brain parameters, despite huge progress in analysis of neuroimaging data. The aim of the present study was to test the relationship between fractional anisotropy (FA) from diffusion tensor imaging (DTI) and regional white matter (WM) volume. As WM volume has been shown to develop until middle age, the focus was on changes in WM properties in the age range of 40 to 60 years. 100 participants were scanned with magnetic resonance imaging (MRI). Each hemisphere was parcellated into 35 WM regions, and volume, FA, axial, and radial diffusion in each region were calculated. The relationships between age and the regional measures of FA and WM volume were tested, and then FA and WM volume were correlated, corrected for intracranial volume, age, and sex. WM volume was weakly related to age, while FA correlated negatively with age in 26 of 70 regions, caused by a mix of reduced axial and increased radial diffusion with age. 23 relationships between FA and WM volume were found, with seven being positive and sixteen negative. The positive correlations were mainly caused by increased radial diffusion. It is concluded that FA is more sensitive than volume to changes in WM integrity during middle age, and that FA-age correlations probably are related to reduced amount of myelin with increasing age. Further, FA and WM volume are moderately to weakly related and to a large extent sensitive to different characteristics of WM integrity. Funding:
|
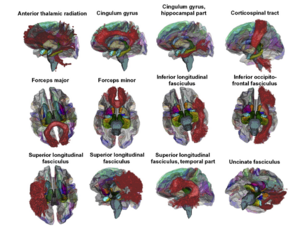 3D renderings of the probabilistic tracts overlaid on a transparent template brain with the FreeSurfer WM parcellations and whole-brain segmentation. The 11 atlas-based probabilistic tracts from the Mori atlas is shown as 3D renderings, displayed on a semi-transparent template brain from FreeSurfer (fsaverage). The subcortical structures are results from FreeSurfer's whole brain segmentation procedure. The colors on the cortical surface are the cortical parcellations on which the WM parcellations are based (see Figs. 1 and 2). The figure was made by use of 3D Slicer software. |
3D Modeling-based Surgical Planning in Transsphenoidal Pituitary Surgery - Preliminary Results
|
Publication: Acta Otolaryngol. 2008 Sep;128(9):1011-8. PMID: 19086197 Authors: Raappana A, Koivukangas J, Pirilä T. Institution: Department of Otorhinolaryngology, Head and Neck Surgery, Oulu University Hospital, Oulu, Finland. Background/Purpose: The preoperative three-dimensional (3D) modeling of the pituitary adenoma together with pituitary gland, optic nerves, carotid arteries, and the sphenoid sinuses was adopted for routine use in our institution for all pituitary surgery patients. It gave the surgeon a more profound orientation to the individual surgical field compared with the use of conventional 2D images only. To demonstrate the feasibility of 3D surgical planning for pituitary adenoma surgery using readily available resources. The computed tomography (CT) and magnetic resonance imaging (MRI) data of 40 consecutive patients with pituitary adenoma were used to construct 3D models to be used in preoperative planning and during the surgery. 3D Slicer, a free, open source program downloaded to a conventional personal computer (PC) was applied. The authors present a brief description of the 3D reconstruction-based surgical planning workflow. In addition to the preoperative planning the 3D model was used as a 'road map' during the operation. With the 3D model the surgeon was more confident when opening the sellar wall and when evacuating the tumor from areas in contact with vital structures than when using only conventional 2D images. |
A Generic Framework for Internet-based Interactive Applications of High-resolution 3-D Medical Image Data
|
Publication: IEEE Trans Inf Technol Biomed. 2008 Sep;12(5):618-26. PMID: 18779076 Authors: Liu D, Hua KA, Sugaya K. Institution: School of Electrical Engineering and Computer Science, University of Central Florida, Orlando, FL, USA. Background/Purpose: With the advances in medical imaging devices, large volumes of high-resolution 3-D medical image data have been produced. These high-resolution 3-D data are very large in size, and severely stress storage systems and networks. Most existing Internet-based 3-D medical image interactive applications therefore deal with only low- or medium-resolution image data. While it is possible to download the whole 3-D high-resolution image data from the server and perform the image visualization and analysis at the client site, such an alternative is infeasible when the high-resolution data are very large, and many users concurrently access the server. In this paper, we propose a novel framework for Internet-based interactive applications of high-resolution 3-D medical image data. Specifically, we first partition the whole 3-D data into buckets, remove the duplicate buckets, and then, compress each bucket separately. We also propose an index structure for these buckets to efficiently support typical queries such as 3D Slicer and region of interest, and only the relevant buckets are transmitted instead of the whole high-resolution 3D medical image data. Furthermore, in order to better support concurrent accesses and to improve the average response time, we also propose techniques for efficient query processing, incremental transmission, and client sharing. Our experimental study in simulated and realistic environments indicates that the proposed framework can significantly reduce storage and communication requirements, and can enable real-time interaction with remote high-resolution 3-D medical image data for many concurrent users. |
Anterior Cingulate Cortex Volume Reduction in Patients with Panic Disorder
|
Publication: Psychiatry Clin Neurosci. 2008 Jun;62(3):322-30. PMID: 18588593 | PDF Authors: Asami T, Hayano F, Nakamura M, Yamasue H, Uehara K, Otsuka T, Roppongi T, Nihashi N, Inoue T, Hirayasu Y. Institution: Department of Psychiatry, Yokohama City University School of Medicine, Yokohama, Japan. Background/Purpose: Recent neuroimaging studies have suggested that the anterior cingulate cortex (ACC) has an important role in the pathology of panic disorder. Despite numerous functional neuroimaging studies that have elucidated the strong relationship between functional abnormalities of the ACC and panic disorder and its symptoms and response to emotional tasks associated with panic disorder, there has been no study showing volumetric changes of the ACC or its subregions. To clarify the structural abnormalities of ACC and its subregions, the combination of region of interest (ROI) and optimized voxel-based morphometry (VBM) methods were performed on 26 patients with panic disorder, and 26 age and sex-matched healthy subjects. In the ROI study, ACC was divided into four subregions: dorsal, rostral, subcallosal and subgenual ACC. The results of the manually traced ROI volume comparison showed significant volume reduction in the right dorsal ACC. VBM also showed a volume reduction in the right dorsal as well as a part of the rostral ACC as a compound mass. Both manual ROI tracing and optimized VBM suggest a subregion-specific pattern of ACC volume deficit in panic disorder. In addition to functional abnormalities, these results suggest that structural abnormalities of the ACC contribute to the pathophysiology of panic disorder. Funding:
|
Future Trends in Robotic Neurosurgery
|
Publication: 14th Nordic-Baltic Conference on Biomedical Engineering and Medical Physics 2008;20:229-33.| PDF Authors: Haidegger T, Kovacs L, Fordos G, Benyo Z, Kazanzides P. Institution: Laboratory of Medical Informatics, Department of Control Engineering and Information Technology, Budapest University of Technology and Economics, Budapest, Hungary. Background/Purpose: Computer Integrated Surgery has only existed for two decades, however it has already spread out world wide, with well over 100.000 operations performed. In the near future, newly developed robotic systems may conquer even the most challenging fields—such as neurosurgery—to provide better patient care and medical outcome. This paper presents the major systems and different strategies applied in robotic neurosurgery. Besides appropriate design, adequate control strategies are required to ensure maximal safety. This makes automated neurosurgery a technologically challenging area for researchers. It is also important during the design phase to consider market aspects. We anticipate that the future trends of clinical applications are outlined by the current leading research directions. The conclusions of the past years of innovation will lead forward on the path of further improvement. |
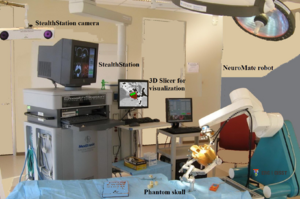 Robotic neurosurgery setup at the Johns Hopkins University with a modified NeuroMate robot, a StealthStation surgical navigation system and the 3D Slicer software. |
A Computer Modelling Tool for Comparing Novel ICD Electrode Orientations in Children and Adults
|
Publication: Heart Rhythm. 2008 Apr;5(4):565-72. PMID: 18362024 | PDF Authors: Jolley M, Stinstra J, Pieper S, Macleod R, Brooks DH, Cecchin F, Triedman JK. Institution: Department of Cardiology, Children’s Hospital Boston, Boston, MA, USA. Background/Purpose: Use of implantable cardiac defibrillators (ICDs) in children and patients with congenital heart disease is complicated by body size and anatomy. A variety of creative implantation techniques has been used empirically in these groups on an ad hoc basis. Objective: To rationalize ICD placement in special populations, we used subject-specific, image-based finite element models (FEMs) to compare electric fields and expected defibrillation thresholds (DFTs) using standard and novel electrode configurations. FEMs were created by segmenting normal torso computed tomography scans of subjects ages 2, 10, and 29 years and 1 adult with congenital heart disease into tissue compartments, meshing, and assigning tissue conductivities. The FEMs were modified by interactive placement of ICD electrode models in clinically relevant electrode configurations, and metrics of relative defibrillation safety and efficacy were calculated. Predicted DFTs for standard transvenous configurations were comparable with published results. Although transvenous systems generally predicted lower DFTs, a variety of extracardiac orientations were also predicted to be comparably effective in children and adults. Significant trend effects on DFTs were associated with body size and electrode length. In many situations, small alterations in electrode placement and patient anatomy resulted in significant variation of predicted DFT. We also show patient-specific use of this technique for optimization of electrode placement. Image-based FEMs allow predictive modeling of defibrillation scenarios and predict large changes in DFTs with clinically relevant variations of electrode placement. Extracardiac ICDs are predicted to be effective in both children and adults. This approach may aid both ICD development and patient-specific optimization of electrode placement. Further development and validation are needed for clinical or industrial utilization. Funding:
|
Using Magnetic Resonance Microscopy to Study the Growth Dynamics of a Glioma Spheroid in Collagen I: A Case Study
|
Publication: BMC Med Imaging. 2008 Jan 29;8:3. PMID: 18230155 | PDF Authors: Huang S, Vader D, Wang Z, Stemmer-Rachamimov A, Weitz DA, Dai G, Rosen BR, Deisboeck TS. Institution: Harvard-MIT (HST) Athinoula A, Martinos Center for Biomedical Imaging, Massachusetts General Hospital, Charlestown, MA, USA. Background/Purpose: Highly malignant gliomas are characterized by rapid growth, extensive local tissue infiltration and the resulting overall dismal clinical outcome. Gaining any additional insights into the complex interaction between this aggressive brain tumor and its microenvironment is therefore critical. Currently, the standard imaging modalities to investigate the crucial interface between tumor growth and invasion in vitro are light and confocal laser scanning microscopy. While immensely useful in cell culture, integrating these modalities with this cancer's clinical imaging method of choice, i.e. MRI, is a non-trivial endeavour. However, this integration is necessary, should advanced computational modeling be able to utilize these in vitro data to eventually predict growth behaviour in vivo. We therefore argue that employing the same imaging modality for both the experimental setting and the clinical situation it represents should have significant value from a data integration perspective. In this case study, we have investigated the feasibility of using a specific form of MRI, i.e. magnetic resonance microscopy or MRM, to study the expansion dynamics of a multicellular tumor spheroid in a collagen type I gel. |
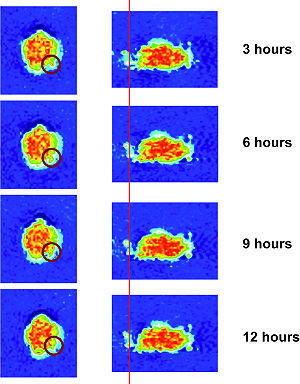 MRM images that show the MTS growth over time from different angles. The images to the left depict the axial view, whereas those to the right show an arbitrary angle. These 2D images confirm the surface heterogeneity that emerges already 12 hrs post placement of the MTS into the gel, and depict a small group of invasive cells (images on the right) that can also be seen in Figures 2(A) and 3. On the other hand, images on the left demonstrate that certain parts of the solid spheroid actually grew into the gel (red circle). |
Lowering the Barriers Inherent in Translating Advances in Neuroimage Analysis to Clinical Research Applications
|
Publication: Acad Radiol. 2008 Jan;15(1):114-8. PMID: 18078914 | PDF Authors: Pujol S, Kikinis R, Gollub R. Institution: Department of Radiology, Brigham and Women's Hospital, Harvard Medical School, Boston, MA, USA. Background/Purpose: This article presents an initiative for the translation of advances in neuroimage analysis techniques to clinical research scientists. Our objective is to bridge the gap between scientific advances made by the biomedical imaging community and their widespread use in the clinical research community. Through national collaborative effort supported by the National Institutes of Health Roadmap, the integration of the most sophisticated algorithms into usable working open-source systems enables clinical researchers to have access to a broad spectrum of cutting edge analysis techniques. A critical step to maximize the long-term positive impact of this collaborative effort is to translate these techniques into new skills of clinical researchers. To address this challenge, we developed a methodology based on three criteria: a multidisciplinary approach, a balance between theory and common practice, and an immersive collaborative environment. The article illustrates our initiative through the exemplar case of diffusion tensor imaging tractography, and reports on our experience over the past two years of designing and delivering training workshops to more than 300 clinicians and scientists using the developed methodology. Funding:
|
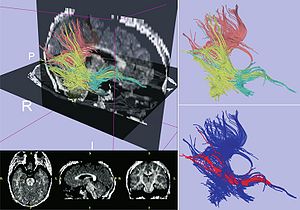 Exemplar case for Diffusion Tensor Imaging Tractography. Upper left panel displays fiber tractography combined with sagittal and axial slices from a fractional anisotropy map computed using 3D Slicer. Upper-right panel shows fiber tracts generated from regions of interest in the posterior-temporal lobe (yellow), splenium of the corpus callosum (pink), and temporal stem (green). Lower-right figure shows 3D visualization of the computed trajectory of the inferior occipito-frontal fasciculus bundle (red). |
2007
|
Publication: Comput Aided Surg. 2007 Nov;12(6):311-24. PMID: 18066947 | PDF Authors: Estepar RS, Stylopoulos N, Ellis R, Samset E, Westin C-F, Thompson C, Vosburgh K.G. Institution: Department of Radiology, Harvard Medical School and Brigham and Women's Hospital, Boston, MA, USA. Background/Purpose: Scarless surgery is an innovative and promising technique that may herald a new era in surgical procedures. We have created a navigation system, named IRGUS, for endoscopic and transgastric access interventions and have validated it in in vivo pilot studies. Our hypothesis is that endoscopic ultrasound procedures will be performed more easily and efficiently if the operator is provided with approximately registered 3D and 2D processed CT images in real time that correspond to the probe position and ultrasound image. The system provides augmented visual feedback and additional contextual information to assist the operator. It establishes correspondence between the real-time endoscopic ultrasound image and a preoperative CT volume registered using electromagnetic tracking of the endoscopic ultrasound probe position. Based on this positional information, the CT volume is reformatted in approximately the same coordinate frame as the ultrasound image and displayed to the operator. The system reduces the mental burden of probe navigation and enhances the operator's ability to interpret the ultrasound image. Using an initial rigid body registration, we measured the mis-registration error between the ultrasound image and the reformatted CT plane to be less than 5 mm, which is sufficient to enable the performance of novice users of endoscopic systems to approach that of expert users. Our analysis shows that real-time display of data using rigid registration is sufficiently accurate to assist surgeons in performing endoscopic abdominal procedures. By using preoperative data to provide context and support for image interpretation and real-time imaging for targeting, it appears probable that both preoperative and intraoperative data may be used to improve operator performance. Funding:
|
3D Visualization and Simulation of Frontoorbital Advancement in Metopic Synostosis
|
Publication: Childs Nerv Syst. 2007 Nov;23(11):1313-7. PMID: 17701413 | PDF Authors: Rodt T, Schlesinger A, Schramm A, Diensthuber M, Rittierodt M, Krauss JK. Institution: Department of Radiology, Hannover University Medical School, Hannover, Germany. Background/Purpose: Current multislice computed tomography (CT) technology can be used for diagnosis and surgical planning applying computer-assisted three-dimensional (3D) visualization and surgical simulation. The usefulness of a technique for surgical simulation of frontoorbital advancement is demonstrated here in a child with metopic synostosis. Postprocessing of multi-slice CT data was performed using the 3D Slicer software. 3D models were created for the purpose of surgical simulation. These allow planning the course of the osteotomies and individually placing the different bony fragments by an assigned matrix to simulate the surgical result. Photo documentation was obtained before and after surgery. Surgical simulation of the procedure allowed determination of the osteotomy course and assessment of the positioning of the individual bony fragments. Computer-assisted postprocessing and simulation is a useful tool for surgical planning in craniosynostosis surgery. The time-effort for segmentation currently limits the routine clinical use of this technique. |
Creating Physical 3D Stereolithograph Models of Brain and Skull
|
Publication: PLoS One. 2007 Oct; 2(10): e1119. PMID: 17971879 | PDF Authors: Kelley DJ, Farhoud M, Meyerand ME, Nelson DL, Ramirez LF, Dempsey RJ, Wolf AJ, Alexander AL, Davidson RJ. Institution: Waisman Laboratory for Brain Imaging and Behavior, Waisman Center, Madison, WI, USA. Background/Purpose: The human brain and skull are three dimensional (3D) anatomical structures with complex surfaces. However, medical images are often two dimensional (2D) and provide incomplete visualization of structural morphology. To overcome this loss in dimension, we developed and validated a freely available, semi-automated pathway to build 3D virtual reality (VR) and hand-held, stereolithograph models. To evaluate whether surface visualization in 3D was more informative than in 2D, undergraduate students (n = 50) used the Gillespie scale to rate 3D VR and physical models of both a living patient-volunteer's brain and the skull of Phineas Gage, a historically famous railroad worker whose misfortune with a projectile tamping iron provided the first evidence of a structure-function relationship in brain. Using our processing pathway, we successfully fabricated human brain and skull replicas and validated that the stereolithograph model preserved the scale of the VR model. Based on the Gillespie ratings, students indicated that the biological utility and quality of visual information at the surface of VR and stereolithograph models were greater than the 2D images from which they were derived. The method we developed is useful to create VR and stereolithograph 3D models from medical images and can be used to model hard or soft tissue in living or preserved specimens. Compared to 2D images, VR and stereolithograph models provide an extra dimension that enhances both the quality of visual information and utility of surface visualization in neuroscience and medicine. Funding:
|
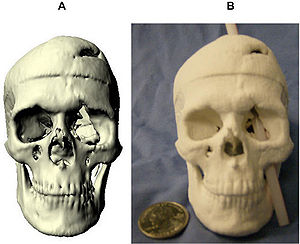 Stereolithograph of Phineas Gage's Skull. The processing pathway we developed can replicate preserved specimens. (a) Virtual model of Phineas Gage's skull. (b) With this physical 3D model of Phineas Gage's skull, we illustrate the approximate path of the tamping iron that produced Phineas Gage's famous injury. |
Morphology, Constraints, and Scaling of Frontal Sinuses in the Hartebeest, Alcelaphus Buselaphus (Mammalia: Artiodactlya, Bovidae)
|
Publication: Journal of Morphology 2007; 268:243-53. PMID: 17278134 | PDF See also 3D Slicer: The Tutorial Part V. Author: Farke AA. Institution: Department of Anatomical Sciences, Stony Brook University, New York, NY, USA. Background/Purpose: The frontal sinuses of bovid mammals display a great deal of diversity, which has been attributed to both phylogenetic and functional influences. In-depth study of the hartebeest (Alcelaphus buselaphus), a large African antelope, reveals a number of previously undescribed details of frontal sinus morphology. In A. buselaphus, the frontal sinuses conform closely to the shape of the frontal bone, filling nearly the entire element. However, the horncores are never extensively pneumatized, contrasting with the condition seen in many other bovids. This evidence is inconsistent with the hypothesis that sinuses are opportunistic pneumatizing agents, suggesting that phylogenetic factors also play a role in determining sinus size. Both cranial sutures and neurovasculature appear to constrain the growth of sinuses in part. In turn, the sinus also affects the growth of the parietal; apparently this element is not truly pneumatized by the sinus in most cases, but the bone’s shape changes under the influence of the sinus. Furthermore, the sinuses present relatively few struts when compared with the sinuses of some other bovids, such as Ovis. By adapting methods previously developed for measuring structural parameters of trabecular bone, it is possible to quantify certain aspects of sinus morphology. These include the number of bony struts within the sinus, the spacing of these struts, and the size of individual cavities within the sinus. Some differences in the number of struts are evident between subspecies. Similarly, significant differences occur in the relative number of struts between male and female A. buselaphus, which may be related to behavior. The volume of the sinus is strongly correlated with the size of the frontal, but less so with overall cranial size. This finding illustrates the importance of choosing variables carefully when comparing sinus sizes and growth between species. |
Image-guided Otologic Surgery Based on Patient Motion Compensation and Intraoperative Virtual CT
|
Publication: Proceedings of ACCAS2007, #P110064 Authors: Hong J, Matsumoto N, Ouchida R, Komune S, Hashizume M. Institution: Redox Navi Institute, Kyushu University, Japan. Background/Purpose: Image-guided surgery has been established particularly in ear, nose, throat (ENT) surgery that requires precise approach in small and complicated anatomy. During the surgery, the registration between the patient and the radiographic images must be maintained regardless of the patient movement. In this study, relative position and orientation of the surgical instrument is calculated referring to the moving patient position. Since the system does not directly handle the 3-D volume data, real-time update of 3-D navigational view is possible. The proposed method also keeps recording the surgical drill position while tracking it. With these digitized data, the temporal bone resection area is computed with several rule-based image processing. Finally, virtual CT images are constructed, and presented for the surgeon to understand and evaluate the current operation intraoperatively by observing their familiar CT images. The aim of this study is to develop and evaluate a novel otologic navigation system supporting patient motion compensation and intraoperative virtual CT construction. |
Non-rigid Registration of Pre-procedural MR Images with Intra- procedural Unenhanced CT Images for Improved Targeting of Tumors During Liver Radiofrequency Ablations
|
Publication: Int Conf Med Image Comput Comput Assist Interv. 2007;10(Pt 2):969-77. PMID: 18044662 | PDF Authors: Archip N, Tatli S, Morrison P, Jolesz F, Warfield SK, Silverman S. Institution: Department of Radiology, Brigham and Women's Hospital, Harvard Medical School, Boston, MA, USA. Background/Purpose: In the United States, unenhanced CT is currently the most common imaging modality used to guide percutaneous biopsy and tumor ablation. The majority of liver tumors such as hepatocellular carcinomas are visible on contrast-enhanced CT or MRI obtained prior to the procedure. Yet, these tumors may not be visible or may have poor margin conspicuity on unenhanced CT images acquired during the procedure. Non-rigid registration has been used to align images accurately, even in the presence of organ motion. However, to date, it has not been used clinically for radiofrequency ablation (RFA), since it requires significant computational infrastructure and often these methods are not sufficient robust. We have already introduced a novel finite element based method (FEM) that is demonstrated to achieve good accuracy and robustness for the problem of brain shift in neurosurgery. In this current study, we adapt it to fuse pre-procedural MRI with intra-procedural CT of liver. We also compare its performance with conventional rigid registration and two non-rigid registration Methods: b-spline and demons on 13 retrospective datasets from patients that underwent RFA at our institution. FEM non-rigid registration technique was significantly better than rigid (p<10-5), non-rigid b-spline (p<10- 4) and demons (p<10-4) registration techniques. The results of our study indicate that this novel technology may be used to optimize placement of RF applicator during CT-guided ablations. Funding:
|
 The position of RF applicator and tumor margin are illustrated on both axial images. Advanced 3D visualization using 3D Slicer enables accurate estimation of RFA electrode with respect to the tumor margins. |
A Detailed 3D Model of the Guinea Pig Cochlea
|
Publication: Brain Struct Funct. 2007 Sep;212(2):223-30. PMID: 17717692 Authors: Liu B, Gao XL, Yin HX, Luo SQ, Lu J. Institution: Department of Anatomy, Capital Medical University, Beijing, China. Background/Purpose: Several partial models of cochlear subparts are available. However, a complete 3D model of an intact cochlea based on actual histological sections has not been reported. Hence, the aim of this study was to develop a novel 3D model of the guinea pig cochlea and conduct post-processes on this reconstructed model. We used a combination of histochemical processing and the method of acquiring section data from the visible human project (VHP) to obtain a set of ideal raw images of cochlear sections. After semi-automatic registration and accurate manual segmentation with professional image processing software, one set of aligned data and six sets of segmented data were generated. Finally, the segmented structures were reconstructed by 3D Slicer (a professional imaging processing and analysis tool). Further, post-processes including 3D visualization and a virtual endoscope were completed to improve visualization and simulate the course of the cochlear implant through the scala tympani. The 3D cochlea model contains the main six structures: (1) the inner wall, (2) modiolus and spiral lamina, (3) cochlea nerve and spiral ganglion, (4) spiral ligament and inferior wall of cochlear duct, (5) Reissner's membrane and (6) tectorial membrane. Based on the results, we concluded that ideal raw images of cochlear sections can be acquired by combining the processes of conventional histochemistry and photographing while slicing. After several vital image processing and analysis steps, this could further generate a vivid 3D model of the intact cochlea complete with internal details. This novel 3D model has great potential in teaching, basic medical research and in several clinical applications. |
Dynamic 3-D Computer Modeling Tracks Brain Changes During Surgery
|
Publication: National Science Foundation (NSF) Discoveries - Brain Surgery: It Really Is Brain Surgery, August 31, 2007. Authors: Nikos Chrisochoides Institution: College of William and Mary, Williamsburg, VA, USA. Background/Purpose: In essence, the William and Mary team provides the surgical team with a dynamic computer model of the patient's brain. In clinical trials, Chrisochoides says his team can render a new model in six or seven minutes, but hopes to be able to do so in under two minutes. More... Funding:
|
Surface Rendering-based Virtual Intraventricular Endoscopy: Retrospective Feasibility Study and Comparison to Volume Rendering-based Approach
|
Publication: Neuroimage. 2007;37 Suppl 1:S89-99. PMID: 17513130 | PDF Authors: Nakajima N, Wada J, Miki T, Haraoka J, Hata N. Institution: Department of Radiology, Brigham and Women's Hospital, Boston, MA, USA. Background/Purpose: Virtual endoscopic simulations using volume rendering (VR) have been proposed as a tool for training and understanding intraventricular anatomy. It is not known whether surface rendering (SR), an alternative to VR, can visualize intraventricular and subependymal structures better and thus making the virtual endoscope more useful for simulating the intraventicular endoscopy. We sought to develop SR virtual endsocopy and compared the visibility of anatomical structures in SR and VR using retrospective cases. Fourteen patients who underwent endoscopic intraventricular surgery of third ventricle enrolled the study. SR virtual endoscopy module was developed in open-source software 3D Slicer and virtual endoscopic scenes from the retrospective cases were created. VR virtual endoscopy of the same cases was prepared in commercial software. Three neurosurgeons scored the visibility of substructures in lateral and third ventricle, arteries, cranial nerves, and other lesions. We found that VR and SR virtual endoscopy performed similarly in visualization of substructures in lateral and third ventricle (not significant statistically). However, the SR was statistically significantly better in visualizing subependymal arteries, cranial nerves, and other lesions (p<0.05, respectively). Funding:
|
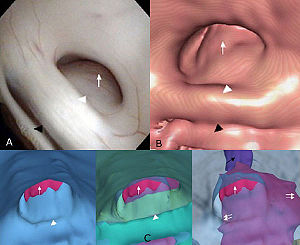 Visualization of the subependymal extension of the tumor in endoscopic surgical simulation using 3D Slicer. (A) The real intraoperative image (flexible videoscope) presents the cerebral aqueduct obstructed by the tectal tumor. (B) Volume rendering-based virtual endoscopy provides the similar image to the real intraoperative image. (C) Surface renderingbased virtual endoscopy reveals the subependymal extension of the tumor by changing the opacity and visibility of the other structures. Tumor (white arrow); posterior commissure (white arrowhead); habenular commissure (black arrowhead); cerebral aqueduct behind the tumor (black arrow). |
Interest of the Steady State Free Precession (SSFP) Sequence for 3D Modeling of the Whole Fetus
|
Publication: Proceedings of the 29th Annual International Conference of the IEEE EMBS, 2007. | PDF Authors: Anquez J, Angelini E, Bloch I, Merzoug V, Bellaiche-Millischer AE, Adamsbaum C. Institution: Signal and Image Processing Department, GET - Telecom Paris, France. Background/Purpose: Fetal magnetic resonance imaging (MRI) has been gaining interest over the last two decades. Current fast MRI sequences provide imaging data of the whole uterus in less than 20 seconds, avoiding fetal motion related artifacts without any maternal or fetal sedation. MRI has proved to be a useful adjunct to echographic screening for prenatal diagnosis. However, MRI volumetric data is still mainly interpreted on 2D slices and 3D applications remain limited. In this paper, we discuss the qualities of the SSFP MRI sequences to provide adequate data for 3D segmentation and modeling of the fetus. Potential exploitations of 3D segmentation and derived anatomical models cover several domains: biometric and morphologic clinical studies, quantitative longitudinal studies of normal and abnormal fetus developments, direct visualization of the overall fetus body and simulations in different fields (surgery, radiation dosimetry,...). |
Longitudinal in Vivo Reproducibility of Cartilage Volume and Surface in Osteoarthritis of the Knee
|
Publication: Skeletal Radiol. 2007 Apr;36(4):315-20. PMID: 17219231 | PDF Authors: Brem MH, Pauser J, Yoshioka H, Brenning A, Stratmann J, Hennig FF, Kikinis R, Duryea J, Winalski CS, Lang P. Institution: Musculoskeletal Division, Department of Radiology, Brigham and Women's Hospital, Harvard Medical School, Boston, MA, USA. Background/Purpose: The aim of this study was to evaluate the longitudinal reproducibility of cartilage volume and surface area measurements in moderate osteoarthritis (OA) of the knee. We analysed 5 MRI (GE 1.5T, sagittal 3D SPGR) data sets of patients with osteoarthritis (OA) of the knee (Kellgren Lawrence grade I-II). Two scans were performed: one baseline scan and one follow-up scan 3 months later (96±10 days). For segmentation, 3D Slicer v.2.5 software was used. Two segmentations were performed by two readers independently who were blinded to the scan dates. Tibial and femoral cartilage volume and surface were determined. Longitudinal and cross-sectional precision errors were calculated using the standard deviation (SD) and coefficient of variation (CV%=100x[SD/mean]) from the repeated measurements in each patient. The in vivo reproducibility was then calculated as the root mean square of these individual reproducibility errors. The cross-sectional root mean squared coefficient of variation (RMSE-CV) was 1.2, 2.2 and 2.4% for surface area measurements (femur, medial and lateral tibia respectively) and 1.4, 1.8 and 1.3% for the corresponding cartilage volumes. Longitudinal RMSE-CV was 3.3, 3.1 and 3.7% for the surface area measurements (femur, medial and lateral tibia respectively) and 2.3, 3.3 and 2.4% for femur, medial and lateral tibia cartilage volumes. The longitudinal in vivo reproducibility of cartilage surface and volume measurements in the knee using this segmentation method is excellent. To the best of our knowledge we measured, for the first time, the longitudinal reproducibility of cartilage volume and surface area in participants with mild to moderate OA. Funding:
|
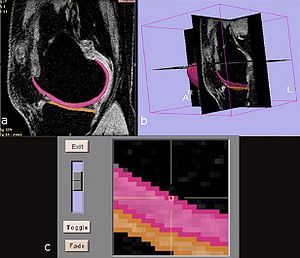 Screen shots of the segmentation software, the 3D Slicer. |
A Novel Manipulator for 3D Ultrasound Guided Percutaneous Needle Insertion
|
Publication: IEEE International Conference on Robotics and Automation. 2007 Apr 10-14; pp.617-22. Authors: Bassan H, Hayes T, Patel RV, Moallem M. Institution: Department of Electrical and Computer Engineering, Western Ontario University, London, ON, Canada. Background/Purpose: The prostate is a small exocrine gland in men responsible for production of the liquid component of the seminal fluid. In North America, prostate cancer accounts for over 300,000 new cases and 40,000 deaths each year and it is the second leading cause of cancer death in men. Low-dose Rate (LDR) brachytherapy is gaining interest as a viable treatment option for prostate cancer due to its low side effects and high benefits. The present manual approach for brachytherapy needle insertion and the inherent flexibility of the needles make it extremely difficult to achieve accurate and consistent dosimetry. In this paper, we present a new 5 degrees-of-freedom (DOF) manipulator capable of performing percutaneous needle insertion. The manipulator can perform orientation, insertion and rotation of the needle and linear motion of the plunger to drop radioactive seeds at targeted locations. The manipulator is an integral part of a system utilizing a mechanically rotated side-fire transducer to create 3D ultrasound images of the organ and utilizing 3D Slicer software to visualize those images. Experiments conducted in agar phantoms reveal an average RMS targeting error of 1.45mm at an average insertion depth of 75.78 mm proving the feasibility and efficacy of the proposed robotic system for percutaneous needle insertion. |
Origin and Insertion Points Involved in Levator Ani Muscle Defects
|
Publication: Am J Obstet Gynecol. 2007 Mar;196(3):251.e1-5. PMID: 17346542 | PDF Authors: Margulies RU, Huebner M, DeLancey JO. Institution: Pelvic Floor Research Group, University of Michigan, Ann Arbor, MI, USA. Background/Purpose: This project sought to identify and to describe the anatomical connections affected by levator ani defects involving the pubovisceral portion of the muscle. Fourteen magnetic resonance scans of women with unilateral levator defects were selected. The missing muscle mapping technique was used to characterize the absent muscle. Normal muscle was visualized and compared with the contralateral side. Using 3D Slicer, the outline of the intact muscle was traced; models of this muscle and surrounding structures were generated. The missing muscle originates from the posterior pubic bone and extends laterally over the obturator internus muscle; it inserts into the vaginal wall, perineal body, and the intersphincteric space. Architectural distortion, with an asymmetric lateral spilling of the vagina was present in 50% of women. The defect was right sided in 71% of patients. The origin and insertion points of the damaged portion of the levator ani muscle were identified. Funding:
|
A Prototype Biosensor-integrated Image-guided Surgery System
|
Publication: Int J Med Robot. 2007 Mar;3:82-8. PMID: 17441030 | PDF Authors: Reisner LA, King BW, Klein MD, Auner GW, Pandya AK. Institution: Department of Electrical and Computer Engineering, Wayne State University, Detroit, MI, USA. Background/Purpose: In this study we investigated the integration of a Raman spectroscopy-based biosensor with an image-guided surgery system. Such a system would provide a surgeon with both a diagnosis of the tissue being analysed (e.g. cancer) and localization information displayed within an imaging modality of choice. This type of mutual and registered information could lead to faster diagnoses and enable more accurate tissue resections. Methods: A test bed consisting of a portable Raman probe attached to a passively articulated mechanical arm was used to scan and classify objects within a phantom skull. The prototype system was successfully able to track the Raman probe, classify objects within the phantom skull, and display the classifications on medical imaging data within a virtual reality environment. We discuss the implementation of the integrated system, its accuracy and improvements to the system that will enhance its usefulness and further the field of sensor-based computer-assisted surgery. Funding:
|
|
Publication: Int J CARS (2007) 2:65-73. | PDF Authors: Diakov G, Freysinger W. Institution: 4D Visualization Laboratory, University Clinic of Oto-, Rhino-, Laryngology, Innsbruck Medical University, Innsbruck, Austria. Background/Purpose: An initialization-free approach for perioperative registration in functional endoscopic sinus surgery (FESS) is sought. The quality of surgical navigation relies on registration accuracy of preoperative images to the patient. Although landmark-based registration is fast, it is prone to human operator errors. This study evaluates the accuracy of two wellknown methods for segmentation of the occipital bone from CT-images for use in surgical 3D-navigation. Funding:
|
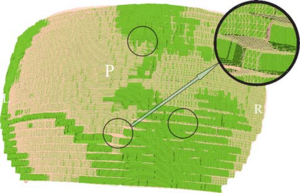 A zoom in the mesh, displayed in 3D Slicer. The oversampling is seen as three layers at each “step”. The difference between the TMCS mesh and the “ground truth” is seen in the colored spots (“ground truth” green, TMCS pink). The three circles mark zones with visibly discernible differences in the segmentation; the inset is a magnification of one of these zones |
Development of a Three-dimensional Multiscale Agent-based Tumor Model: Simulating Gene-protein Interaction Profiles, Cell Phenotypes and Multicellular Patterns in Brain Cancer
|
Publication: J Theor Biol. 2007 Jan 7;244(1):96-107. PMID: 16949103 | PDF Authors: Zhang L, Athale CA, Deisboeck TS. Institution: Complex Biosystems Modeling Laboratory, Massachusetts General Hospital, Harvard medical School, Boston, MA, USA. Background/Purpose: Related also to efforts within the Center for the Development of a Virtual Tumor, CViT, our research here focuses on developing multi-scale and multi-resolution (brain) cancer models. Using a hybrid 3D agent-based modeling platform we connect gene-protein interaction maps on the molecular and single cell level (Figure 1, left) up to the volumetric tumor scale of clinical MR-images. For the latter, we plan on using 3D Slicer for segmentation of tumor-affected areas and 3D reconstruction of tumor volume and surface. Figure 1, right depicts a first step towards this approach where the yellow points depict the 3D surface reconstruction of a T1+Gd MRI while the blue and red points represent virtual tumor cells in attempt to match the real data points. Amongst the more challenging steps is the translation of these 2D in vivo imaging data onto our in silico lattices. Funding:
|
Image Registered FAST (IRFAST) for Combat Casualty Triage
|
Authors: Pohl KM, Pieper S, Vosburgh K, Takacs B. Background/Purpose: Dr. Pohl's research involves developing an automatic segmentation approach identifying major anatomical compartments from torso CT scans. Using 3D Slicer, he developed a procedure for automatically segmenting the body, bone structures, lungs, and hart from CT images (see figure). The method iterates between the identification of anatomical structures and the registration of an “atlas” to the CT data set of the subject. The atlas is based on CT data set, which we call template, and a label map that already identifies the structures of interest in the template. In the first iteration, the template with the segmentation of the body is mapped onto the CT data set of the subject. This results in a very accurate segmentation of the subject’s body. The method then combines the segmentation of the body and the CT images of the subject to identify the lungs and bone structures. In the second iteration, the method maps the atlas specific label map of body, bones, and lungs to the corresponding label map of the subject. The segmented structures are then used as a "coordinate system" used for the identification of the remaining anatomical compartments. Funding:
|
A Preliminary Study on the Relationship between Nasal Cavity and Maxillary Sinus Volumes
|
Publication: Proceedings of the 76th Annual Meeting of the American Association of Physical Anthropologists Mar 2007. | PDF Authors: Butaric LN, Broadfield DC, McCarthy RC. Institution: Department of Anthropology, Texas A&M University, College Station, TX, USA. Background/Purpose: Previous research suggests that nasal cavity volume (NCV), thought to be related to climate, is inversely correlated with maxillary sinus volume (MSV). According to this hypothesis, changes in nasal cavity size and shape reflect physiological needs, such as warming and humidifying inspired air. Owing to volumetric constraints in the mid-face, relative increases in NCV are hypothesized to result in concomitant decreases in MSV, respectively. To test this hypothesis thirty-nine dried adult human crania from seven different climatic regions were examined using computerized tomography (CT) scans. Significant differences in MSV and NCV between populations were identified using Analysis of Variance (ANOVA). In addition, least-squares and reduced major axis (RMA) regression analyses were performed to test the scaling relationships between MSV, NCV and several cranial size variables. Contrary to previous studies, results indicate that MSV and NCV are not significantly correlated. RMA analyses indicate that NCV, but not MSV, scales isometrically with skull size. Finally, post hoc ANOVA results identify significant differences between human populations for MSV that do not follow climatic or environmental trends. These results suggest that (1) it is unlikely that NCV and MSV compete for space in the mid-face, (2) NCV is largely a byproduct of skull size, and (3) NCV and MSV may not be as closely tied to climate as previously thought. Additional genetic and epigenetic factors need to be considered regarding the structure and function of the human maxillary sinus. |
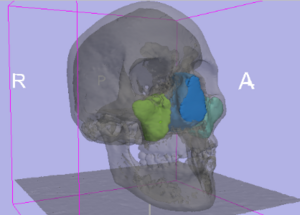 Color labels of segmented areas were then rendered using the “Model Module” in 3D Slicer to create 3D models. Using the “MeasVol Module,” absolute volumes of the nasal cavity and each maxillary sinus were quantified. |
Interobserver Variability in the Determination of Upper Lobe-predominant Emphysema
|
Publication: Chest. 2007 Feb;131(2):424-31. PMID: 17296643 | PDF Authors: Hersh CP, Washko GR, Jacobson FL, Gill R, Estepar RS, Reilly JJ, Silverman EK. Institution: Channing Laboratory, Brigham and Women's Hospital, Boston, MA, USA. Background/Purpose: Appropriateness for lung volume reduction surgery is often determined based on the results of high-resolution CT (HRCT) scanning of the chest. At many centers, radiologists and pulmonary physicians both review the images, but the agreement between readers from these specialties is not known. Two thoracic radiologists and three pulmonologists retrospectively reviewed the HRCT scans of 30 patients with emphysema involved in two clinical studies at our institution. Each reader assigned an emphysema severity score and assessed upper lobe predominance, using a methodology similar to that of the National Emphysema Treatment Trial. In addition, the percentage of emphysema at -910 Hounsfield units was objectively determined by density mask analysis. For the emphysema severity scores, (Spearman) correlation between readers ranged from 0.59 (p = 0.0005) to 0.87 (p < 0.0001), with generally stronger correlations among readers from the same medical specialty. Emphysema severity scores were significantly correlated with prebronchodilator and postbronchodilator spirometry findings, as well as with density mask analysis. In the assessment of upper lobe predominance, kappa statistics for agreement ranged from 0.20 (p = 0.4) to 0.60 (p = 0.0008). Examining all possible radiologist-pulmonologist pairs, the two readers agreed in their assessments of emphysema distribution in 75% of the comparisons. Readers agreed on upper lobe-predominant disease in 9 of the 10 patients in which regional density mask analysis clearly showed upper lobe predominance. In a group of patients with varying emphysema severity, interobserver agreement in the determination of upper lobe-predominant disease was poor. Agreement between readers tended to be better in cases with clear upper lobe predominance as determined by densitometry. Funding:
|
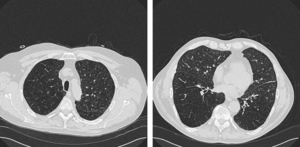 Example of disagreement among readers. Two of five observers interpreted this HRCT scan as showing upper lobe-predominant emphysema. Representative 1-mm sections from the level of (left, A) the top of the aortic arch and (right, B) the right inferior pulmonary vein are shown, using lung windows (width, –1,500 HU; level, 600 HU). |
Registered, Sensor-integrated Virtual Reality for Surgical Applications
|
Publication: Proceedings of the International Conference and Exhibition in Virtual Reality 2007; 277-8. | PDF Authors: King BW, Reisner LA, Klein MD, Auner GW, Pandya AK. Institution: Wayne State University, Detroit, MI, USA. Background/Purpose: The visualization for our image-guided surgery system is implemented using 3D Slicer, an open-source application for displaying medical data. 3D Slicer provides a virtual reality environment in which various imaging modalities (e.g. CT or MRI data) can be presented. The software includes the ability to display the locations of objects with respect to 3D models that are derived from segmentation of the medical imaging. We modified 3D Slicer in several ways to adapt it to our application. First, we developed a TCP/IP interface that receives the tracking data for the MicroScribe and displays its position in the VR environment relative to the medical imaging data. This allows us to track the Raman probe in real-time. Second, we developed a way to place colored markers that indicate tissue/material classification on the medical imaging data. The combination of these modifications enables us to denote the location and classification of tissue/material scanned with the probe in near-real-time. |
Modeling Cancer Biology
|
Publication: Biomedical Computation Review Spring 2007 pp. 16-24. | PDF Author: Kristin Cobb |
A Comparison of Upper Airway Structures in Male and Female Obstructive Sleep Apnoea (OSA) Patients
|
Publication: Poster Presentation at the 2007 American Thoracic Society International Conference. Authors: McEvoy RD, Ryan MK, Catcheside PG, Jakab M, Malhotra A, Sage MR, Valentine R, White DP. Institution: Adelaide Institute for Sleep Health, Repatriation General Hospital, Daw Park, South Australia. Background/Purpose: For the same BMI female OSA patients tend to have less severe sleep disordered breathing than male OSA patients. This study investigates features of upper airway anatomy that may contribute to this difference. Male (n=6) and female (n=9) patients matched for age [mean(SD); men 56.5(5.7), women 55.3(6.2) yrs] and BMI [35.2(3.4), 34.3 (3.0) kg/m²], who had previously been diagnosed with OSA (AHI>30/h), and adherent with CPAP for >3 months were studied. T1 weighted magnetic resonance imaging of the upper airway and surrounding tissues was performed and analyzed using 3D Slicer to determine airway, soft tissue and bony dimensions. The oropharyngeal bony vault volume was greater in males after normalizing for height (1.2(0.1) vs 0.97(0.1), mls/cm, p=0.001). Men had greater neck circumference (45.3(4.3) vs 39.5(4.5) cm, p=0.026) and longer pharyngeal airways (75.2(8.3) vs 64.6(9.5) mm, p=0.042) compared to women. Pharyngeal airway volume and minimum CSA were not different between the genders. In the mid sagittal plane, the tongue CSA was greater in men before and after (36.4(1.4) vs 32.6(3.5) mm²/mm, p=0.01) normalizing for bony vault dimensions. In data collected to date, AHI was not different between males and females (55(12) vs 62(21) events/h). These preliminary data suggest that male OSA patients have greater oropharyngeal bony vault volume than female patients; a larger tongue (normalized for bony vault dimensions) and a longer pharyngeal airway. These findings may have implications for the male predisposition for OSA. Funding:
|
2006
Shaving Diffusion Tensor Images in Discriminant Analysis: A Study into Schizophrenia
|
Publication: Med Image Anal. 2006 Dec;10(6):841-9. PMID: 16965928 | PDF Authors: Caan MW, Vermeer KA, van Vliet LJ, Majoie CB, Peters BD, den Heeten GJ, Vos FM. Institution: Quantitative Imaging Group, Delft University of Technology, Delft, The Netherlands. Background/Purpose: A technique called 'shaving' is introduced to automatically extract the combination of relevant image regions in a comparative study. No hypothesis is needed, as in conventional pre-defined or expert selected region of interest (ROI)-analysis. In contrast to traditional voxel based analysis (VBA), correlations within the data can be modeled using principal component analysis (PCA) and linear discriminant analysis (LDA). A study into schizophrenia using diffusion tensor imaging (DTI) serves as an application. Conventional VBA found a decreased fractional anisotropy (FA) in a part of the genu of the corpus callosum and an increased FA in larger parts of white matter. The proposed method reproduced the decrease in FA in the corpus callosum and found an increase in the posterior limb of the internal capsule and uncinate fasciculus. A correlation between the decrease in the corpus callosum and the increase in the uncinate fasciculus was demonstrated. Funding:
|
|
Publication: Med Bio Eng Comput. 2006 Dec; 44(12):1127-34. PMID: 17102954 Authors: Hong J, Nakashima H, Konishi K, Ieiri S, Tanoue K, Hashizume M. Institution: Redox Navi Institute, Kyushu University, Fukuoka, Japan. Background/Purpose: Surgical navigation systems can contribute to abdominal interventions such as radiofrequency ablation (RFA) or percutaneous ethanol injection therapy (PEIT) for liver tumours. Until now, typical abdominal interventions have been performed using the US guidance approach. Identification of the lesion by these methods has often been difficult, especially when tumours were small and US images were unclear. To improve the treatment with better lesion identification, 3D navigation based on MRI or CT is crucial. Particularly, MRI-based navigation systems have been preferred in respect of avoidance of ionizing radiation. To our knowledge, this is the first trial of abdominal needle insertion intervention under local anaesthesia using simultaneous MRI and US navigation. To accomplish this purpose, the semi-automatic fiducial registration is required. While scanning the abdominal area and using the optical tracking system, partial loss of the markers often occurs, leading to the prolongation of the limited intervention time. The proposed method combats this problem. In this paper, we elucidate whether the MRI and US integrated navigation assists in reliable needle insertion and reduce the time required to determine the needle insertion path in abdominal interventions. |
Diffusion Tensor Imaging Reveals White Matter Reorganization in Early Blind Humans
|
Publication: Cereb Cortex. 2006 Nov;16(11):1653-61. PMID: 16400157 | PDF Authors: Shimony JS, Burton H, Epstein AA, McLaren DG, Sun SW, Snyder AZ. Institution: Mallinckrodt Institute of Radiology, Washington University School of Medicine, St Louis, MO, USA. Background/Purpose: Multiple functional methods including functional magnetic resonance imaging, transcranial magnetic stimulation, and positron emission tomography have shown cortical reorganization in response to blindness. We investigated microanatomical correlates of this reorganization using diffusion tensor imaging and diffusion tensor tractography (DTT). Five early blind (EB) were compared with 7 normally sighted (NS) persons. DTT showed marked geniculocalcarine tract differences between EB and NS participants. All EB participants showed evidence of atrophy of the geniculocortical tracts. Connections between visual cortex and the orbital frontal and temporal cortices were relatively preserved in the EB group. Importantly, no additional tracts were found in any EB participant. Significant alterations of average diffusivity and relative anisotropy were found in the white matter (WM) of the occipital lobe in the EB group. These observations suggest that blindness leads to a reorganization of cerebral WM and plausibly support the hypothesis that visual cortex functionality in blindness is primarily mediated by corticocortical as opposed to thalamocortical connections. Funding:
|
Molar Crown Thickness, Volume, and Development in South African Middle Stone Age Humans
|
Publication: South African Journal of Science. 2006;102(11-12):513-517. | PDF Authors: Smith TM, Olejniczak AJ, Tafforeau P, Reid DJ, Grine FE, Hublin JJ. Institution: Department of Human Evolution, Max Planck Institute for Evolutionary Anthropology, Leipzig, Germany. Background/Purpose: One highly debated issue in palaeoanthropology is that of modern human origins, particularly the issue of when 'anatomically modern humans' (AMH) from the African Middle Stone Age became fully modern. While studies of cranial and external dental morphology suggest a modern transition occurred 150 000-200 000 years ago, little is known about dental development or enamel thickness in AMH. Studies of early members of the genus Homo suggest that the modern, prolonged condition of tooth growth arose late in human evolution, and that the enamel thickness of earlier hominins may not be homologous to the modern condition. This study represents the first integrated investigation of molar crown enamel thickness, volume, and development in fossil hominins, aimed at determining whether differences between AMH and living populations can be detected in these traits. Using high-resolution micro-computed tomography, we demonstrate similarities in enamel thickness and crown volumes between fossil and modern populations. Additionally, long-period growth line numbers and estimates of crown formation times for AMH molars fall within modern human ranges. These findings suggest that tooth structure and growth have remained constant for more than 60 000 years, despite the known geographical, technological, and ecological diversity that characterizes later stages of human evolution. |
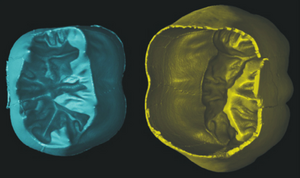 Virtually separated coronal dentine (left) and enamel cap (right) of the right lower first molar illustrated in Figs 1 and 3. A small amount of enamel is missing on the lingual cervix. The volume and surface area of each of these tissues was calculated, which was used to calculate the 3D average and relative enamel thickness (see text). |
A 3D Model Simulating Sediment Transport, Erosion and Deposition within a Network of Channel Belts and an Associated Floodplain
|
Publication: PowerPoint Presentation PDF Authors: Karssenberg D, Bridge J. Institution: Utrecht University, The Netherlands. |
Molecular Diffusion in MRI: Technical Application of Fiber Tracking
|
Publication: PowerPoint Presentation PPT Author: Martha Liliana Mora V. Institution: Rey Juan Carlos University, Madrid, Spain. |
Quantification of Levator Ani Cross-sectional Area Differences between Women with and Those without Prolapse
|
Publication: Obstet Gynecol. 2006 Oct;108(4):879-83. PMID: 17012449 | PDF Authors: Hsu Y, Chen L, Huebner M, Ashton-Miller JA, DeLancey JO. Institution: University of Michigan, Ann Arbor, MI, USA. Background/Purpose: Compare levator ani cross-sectional area as a function of prolapse and muscle defect status. Thirty women with prolapse and 30 women with normal pelvic support were selected from an ongoing case-control study of prolapse. For each of the two groups, 10 women were selected from three categories of levator defect severity: none, minor, and major identified on supine magnetic resonance scans. Using those scans, three-dimensional (3D) models of the levator ani muscles were made using 3D Slicer, a modeling program, and cross-sections of the pubic portion were calculated perpendicular to the muscle fiber direction using another program, I-DEAS. An analysis of variance was performed. The ventral component of the levator muscle of women with major defects had a 36% smaller cross-sectional area, and women with minor defects had a 29% smaller cross-sectional area compared with the women with no defects (P < .001). In the dorsal component, there were significant differences in cross-sectional area according to defect status (P = .03); women with major levator defects had the largest cross-sectional area compared with the other defect groups. For each defect severity category (none, minor, major), there were no significant differences in cross-sectional area between women with and those without prolapse. Women with visible levator ani defects on magnetic resonance imaging had significantly smaller cross-sectional areas in the ventral component of the pubic portion of the muscle compared with women with intact muscles. Women with major levator ani defects had larger cross-sectional areas in the dorsal component than women with minor or no defects. Funding:
|
 3D Slicer models. A. Three-fourths view of the levator ani muscle and pubic bone. B. Levator ani with pubic bones removed. C. Lateral view of muscle. |
Liver Metastases: 3D Shape-based Analysis of CT Scans for Detection of Local Recurrence After Radiofrequency Ablation
|
Publication: Radiology. 2006 Oct;241(1):243-50. PMID: 16928977 | PDF Authors: Bricault I, Kikinis R, Morrison PR, Vansonnenberg E, Tuncali K, Silverman SG. Institution: Department of Radiology, University Hospital Michallon, Grenoble, France. Background/Purpose: The purpose of this pilot study was to determine retrospectively the diagnostic performance of a computer-aided three-dimensional (3D) analytic tool for assessing local recurrences of liver metastases by quantifying shape changes in ablated tumors on computed tomographic (CT) scans for follow-up of radiofrequency (RF) ablation. Positron emission tomographic and long-term CT follow-up images were reference standards. Fifty-six follow-up CT scans of 12 liver metastases (mean size, 4.0 cm) in nine patients treated with RF ablation were retrospectively analyzed. After the 1st month following RF ablation, the 3D analytic tool helped quantify ablated tumor shape variations and revealed recurrences even in the absence of abnormal enhancement (sensitivity, seven of seven; specificity, three of five). The 3D tool would have revealed a recurrence before it was reported clinically in two patients. Although results are preliminary, a 3D analytic tool based on shape may be useful in assessing RF ablation results. Funding:
|
Atlas Guided Identification of Brain Structures by Combining 3D Segmentation and SVM Classification
|
Publication: Int Conf Med Image Comput Comput Assist Interv. 2006 Oct;9(Pt 2):209-16. PMID: 17354774 | PDF Authors: Akselrod-Ballin A, Galun M, Gomori MJ, Basri R, Brandt A. Institution: Department of Computer Science and Applied Math, Weizmann Institute of Science, Rehovot, Israel. Background/Purpose: This study presents a novel automatic approach for the identification of anatomical brain structures in magnetic resonance images (MRI). The method combines a fast multiscale multi-channel three dimensional (3D) segmentation algorithm providing a rich feature vocab ulary together with a support vector machine (SVM) based classifier. The segmentation produces a full hierarchy of segments, expressed by an irregular pyramid with only linear time complexity. The pyramid provides a rich, adaptive representation of the image, enabling detection of various anatomical structures at different scales. A key aspect of the approach is the thorough set of multiscale measures employed throughout the segmentation process which are also provided at its end for clinical analysis. These features include in particular the prior probability knowledge of anatomic structures due to the use of an MRI probabilistic atlas. An SVM classifier is trained based on this set of features to identify the brain structures. We validated the approach using a gold standard real brain MRI data set. Comparison of the results with existing algorithms displays the promise of our approach. Funding:
|
Development of a CAD (Computer Assisted Detection) System to Detect Lung Nodules in CT Scans
|
Publication: PDF Authors: Tommasi E, De Nunzio G. Institution: Departments of Physics and Material Science, University of Lecce, Italy. Background/Purpose: We implemented a piece of software to segment lung tissue in CT thoracic images. We gave particular attention to the study of the ilhus pulmonis (region of entrance of bronchi and vessels in the lung parenchima). It is a delicate region in segmentation. We used 3D Slicer to visualize the different steps of the algorithm, checking their correctness. Through a segmentation technique, known as “region growing”, we obtained the delineation of the respiratory apparatus domain in the CT scans. This algorithm is completely three-dimensional. Its output consists in the 3D mask of the respiratory apparatus. We used 3D Slicer to visualize it. Then through an alternative version of region growing, based on a wavefront simulation algorithm, we obtained the segmentation of the external bronchi. We also used the opacity proprieties to put in evidence the internal structures of lungs (such as vessels). |
Dynamic Simulation of Joints using Multi-Scale Modeling
|
Author: Trent M. Guess Institution: Mechanical Engineering, University of Missouri, Kansas City, MO, USA. Background/Purpose:
Funding:
|
Quasi-isometric Flattening of Curved Surfaces for Medical Imaging
|
Researchers: Zeevi YY, Saucan E, Appleboim E. Institution: Department of Electrical-Engineering, Technion-Israel Institute of Technology, Haifa, Israel. Description: CT/MRI-scans of human brain-cortex/colon are flattened in a quasi-isometric manner in order to keep angles/length/area as minimally distorted as possible. 3D-surfaces are created out of real data scans, using 3D Slicer. Funding:
|
A Translation Station for Imaging
|
Publication: RSNA 2006; Authors: Mongkolwat P, Lechner T, Kogan A, Talbot S, Johnson B, Channin DS. Institution: Imaging Informatics Section, Northwestern University, Chicago, IL, USA. Background/Purpose: While providing clinical feedback to the basic sciences. In imaging informatics, this means enabling collaborations between radiologists and computer scientists. Commercial workstations do not allow for experimentation nor do they evolve fast enough. Research imaging packages, while innovative, do not provide for clinical activities or regulatory compliance. We added IHE workflow functionality, hanging protocols and other clinical functions to the 3D Slicer research platform. We leveraged the functionality and methodology of the Insight and Visualization Toolkits, and the DCM4CHE tools. A research mode allows for the evaluation of experimental algorithms against a PACS while protecting patient confidentiality. This combined functionality allows researchers to develop algorithms against clinical cases while at the same allowing clinicians to explore and validate these developments. |
User-guided 3D Active Contour Segmentation of Anatomical Structures: Significantly Improved Efficiency and Reliability
|
Publication: Neuroimage. 2006 Jul 1;31(3):1116-28. PMID: 16545965 | PDF Authors: Yushkevich PA, Piven J, Hazlett HC, Smith RG, Ho S, Gee JC, Gerig G. Institution: Penn Image Computing and Science Laboratory, Department of Radiology, University of Pennsylvania, PA, USA. Background/Purpose: Active contour segmentation and its robust implementation using level set methods are well-established theoretical approaches that have been studied thoroughly in the image analysis literature. Despite the existence of these powerful segmentation methods, the needs of clinical research continue to be fulfilled, to a large extent, using slice-by-slice manual tracing. To bridge the gap between methodological advances and clinical routine, we developed an open source application called ITK-SNAP, which is intended to make level set segmentation easily accessible to a wide range of users, including those with little or no mathematical expertise. This paper describes the methods and software engineering philosophy behind this new tool and provides the results of validation experiments performed in the context of an ongoing child autism neuroimaging study. The validation establishes SNAP intrarater and interrater reliability and overlap error statistics for the caudate nucleus and finds that SNAP is a highly reliable and efficient alternative to manual tracing. Analogous results for lateral ventricle segmentation are provided. Funding:
|
 Two and three-dimensional views of the caudate nucleus. Coronal slice of the caudate: original T1-weighted MRI (left) and overlay of segmented structures (middle). Right and left caudate are shown shaded in green and red; left and right putamen are sketched in yellow, laterally exterior to the caudates. The nucleus accumbens is sketched in red outline. Note the lack of contrast at the boundary between the caudate and the nucleus accumbens, and the fine-scale cell bridges between the caudate and the putamen. At right is a 3D view of the caudate and putamen relative to the lateral ventricles. |
Habitual Use of the Primate Forelimb is Reflected in the Material Properties of Subchondral Bone in the Distal Radius
|
Publication: J Anat. 2006 Jun; 208(6):659-70. PMID: 16761969 | PDF Authors: Carlson KJ, Patel BA. Institution: Department of Anatomical Sciences, School of Medicine, Stony Brook University, NY, USA. Background/Purpose: Bone mineral density is directly proportional to compressive strength, which affords an opportunity to estimate in vivo joint load history from the subchondral cortical plate of articular surfaces in isolated skeletal elements. Subchondral bone experiencing greater compressive loads should be of relatively greater density than subchondral bone experiencing less compressive loading. Distribution of the densest areas, either concentrated or diffuse, also may be influenced by the extent of habitual compressive loading. We evaluated subchondral bone in the distal radius of several primates whose locomotion could be characterized in one of three general ways (quadrupedal, suspensory or bipedal), each exemplifying a different manner of habitual forelimb loading (i.e. compression, tension or non-weight-bearing, respectively). We employed computed tomography osteoabsorptiometry (CT-OAM) to acquire optical densities from whichfalse-colour maps were constructed. The false-colour maps were used to evaluate patterns in subchondral density (i.e. apparent density). Suspensory apes and bipedal humans had both smaller percentage areas and less well-defined concentrations of regions of high apparent density relative to quadrupedal primates. Quadrupedal primates exhibited a positive allometric effect of articular surface size on high-density area, whereas suspensory primates exhibited an isometric effect and bipedal humans exhibited no significant relationship between the two. A significant difference between groups characterized by predominantly compressive forelimb loading regimes vs. tensile or non-weight-bearing regimes indicates that subchondral apparent density in the distal radial articular surface distinguishes modes of habitually supporting of body mass. Funding:
|
Appearance of the Levator Ani Muscle Subdivisions in Magnetic Resonance Images
|
Publication: Obstet Gynecol. 2006 May;107(5):1064-9. PMID: 16648412 | PDF Authors: Margulies RU, Hsu Y, Kearney R, Stein T, Umek WH, DeLancey JO. Institution: University of Michigan, Ann Arbor, MI, USA. Background/Purpose: Identify and describe the separate appearance of 5 levator ani muscle subdivisions seen in axial, coronal, and sagittal magnetic resonance imaging (MRI) scan planes. Magnetic resonance scans of 80 nulliparous women with normal pelvic support were evaluated. Characteristic features of each Terminologia Anatomica-listed levator ani component were determined for each scan plane. Muscle component visibility was based on pre- established criteria in axial, coronal, and sagittal scan planes: 1) clear and consistently visible separation or 2) different origin or insertion. Visibility of each of the levator ani subdivisions in each scan plane was assessed in 25 nulliparous women. In the axial plane, the puborectal muscle can be seen lateral to the pubovisceral muscle and decussating dorsal to the rectum. The course of the puboperineal muscle near the perineal body is visualized in the axial plane. The coronal view is perpendicular to the fiber direction of the puborectal and pubovisceral muscles and shows them as “clusters” of muscle on either side of the vagina. The sagittal plane consistently demonstrates the puborectal muscle passing dorsal to the rectum to form a sling that can consistently be seen as a “bump.” This plane is also parallel to the pubovisceral muscle fiber direction and shows the puboperineal muscle. The subdivisions of the levator ani muscle are visible in MRI scans, each with distinct morphology and characteristic features. Funding:
|
Virtual Cystoscopy - A Surgical Planning and Guidance Tool
|
Publication: Arch Ital Urol Androl. 2006 Mar;78(1):23-4. PMID: 16752884 Authors: Braticevici B, Onu M, Bengus F. Institution: Clinical Hospital, Bucharest, Romania. Background/Purpose: Image guided-surgery systems facilitates surgical planning phases of endoscopic procedures. In this paper, we used a software package for 3D surface model generation and vizualization of the urinary bladder, based on magnetic resonance (MR) cross sectional images of the pelvis. The patients group consisted in 6 patients diagnosed with urinary bladder tumour. They were submitted to MRI exam. Twelve consecutive cross sectional images of the pelvis were aquired (TR (repetition time) = 600 msec, TE (echo time) = 19 msec, slice thickness = 6 divided by 7 mm, FOV (field of view) = 36 cm. All these images were transferred to a personal computer running the 3D Slicer software. We obtained, for each patient, a 3D model of the pelvis including the urinary bladder. In This way, the surgical enviroment was simulated and we are able to investigate the bladder by virtual cystoscopy. The virtual endoscopy may be used as a tool in the preoperative training and in surgical planning. |
Measurement of the Pubic Portion of the Levator Ani Muscle in Women with Unilateral Defects in 3D Models from MR Images
|
Publication: Int J Gynaecol Obstet. 2006 Mar;92(3):234-41. PMID: 16442111 | PDF Authors: Chen L, Hsu Y, Ashton-Miller JA, DeLancey JO. Institution: Department of Biomedical Engineering, University of Michigan, Ann Arbor, MI, USA. Background/Purpose: Develop a method to quantify the cross-sectional area of the pubic portion of the levator ani muscle, validate the method in women with unilateral muscle defects, and report preliminary findings in those women. Multi-planar proton density magnetic resonance images of 12 women with a unilateral defect in the pubic portion of their levator ani were selected from a larger study of levator ani muscle anatomy in women with and without genital prolapse. Three-dimensional bilateral models of the levator ani were reconstructed, using 3D Slicer v.2.1b1, and divided into iliococcygeal and pubic portions. Muscle cross-sectional areas were calculated at four equally spaced locations perpendicular to a line drawn from the pubic origin to the visceral insertion using the I-DEAS computer modeling software. The cross-sectional area of the muscle on the side with the defect was smaller than the normal side at all the four locations. The average bilateral difference was up to 81% at location 1 (nearest pubic origin). Almost all of the volume difference (13.7%, P=0.0004) was attributable to a reduction in the pubic portion (24.6%, P<0.0001), not the iliococcygeal portion (P=0.64), of the muscle. A method was developed to quantify cross-sectional area of the pubic portion of the levator ani perpendicular to the intact muscle direction. Significant bilateral cross-sectional area differences were found between intact and defective muscles in women with a unilateral defect. Funding:
|
Finite-element-method (FEM) Model Generation of Time-resolved 3D Echocardiographic Geometry Data for Mitral-valve Volumetry
|
Publication: Biomed Eng Online. 2006 Mar 3;5:17. PMID: 16512925 | PDF Authors: Verhey JF, Nathan NS, Rienhoff O, Kikinis R, Rakebrandt F, D'Ambra MN. Institution: MVIP ImagingProducts GmbH, Nörten-Hardenberg, Germany. Background/Purpose: Mitral Valve (MV) 3D structural data can be easily obtained using standard transesophageal echocardiography (TEE) devices but quantitative pre- and intraoperative volume analysis of the MV is presently not feasible in the cardiac operation room (OR). Finite element method (FEM) modelling is necessary to carry out precise and individual volume analysis and in the future will form the basis for simulation of cardiac interventions. Methods: With the present retrospective pilot study we describe a method to transfer MV geometric data into 3D Slicer 2 software, an open-source medical visualization and analysis software package. A newly developed software program (ROIExtract) allowed selection of a region-of-interest (ROI) from the TEE data and data transformation for use in 3D Slicer. FEM models for quantitative volumetric studies were generated. ROI selection permitted the visualization and calculations required to create a sequence of volume rendered models of the MV allowing time-based visualization of regional deformation. Quantitation of tissue volume, especially important in myxomatous degeneration can be carried out. Rendered volumes are shown in 3D as well as in time-resolved 4D animations. The visualization of the segmented MV may significantly enhance clinical interpretation. This method provides an infrastructure for the study of image guided assessment of clinical findings and surgical planning. For complete pre- and intraoperative 3D MV FEM analysis, three input elements are necessary: 1. time-gated, reality-based structural information, 2. continuous MV pressure and 3. instantaneous tissue elastance. The present process makes the first of these elements available. Volume defect analysis is essential to fully understand functional and geometrical dysfunction of but not limited to the valve. 3D Slicer was used for semi-automatic valve border detection and volume-rendering of clinical 3D echocardiographic data. FEM based models were also calculated. A Philips/HP Sonos 5500 ultrasound device stores volume data as time-resolved 4D volume data sets. Data sets for three subjects were used. Since 3D Slicer does not process time-resolved data sets, we employed a standard movie maker to animate the individual time-based models and visualizations. Calculation time and model size were minimized. Pressures were also easily available. We speculate that calculation of instantaneous elastance may be possible using instantaneous pressure values and tissue deformation data derived from the animated FEM. Funding:
|
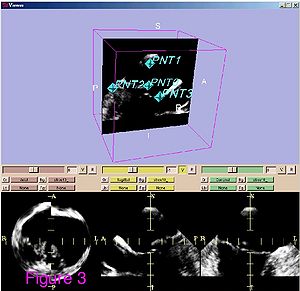 Ultrasound data of after preprocessing. The ultrasound data are shown from patient 1. Shown is a standard visualization of one time step during the heart cycle with 3D Slicer software. The three planes for each spatial direction are shown in the lower three frames. In the frame above one plane is shown together with the set of four fiducials. These four points are defined for all time steps. |
Range of Curvilinear Distraction Devices Required for Treatment of Mandibular Deformities
|
Publication: J Oral Maxillofac Surg. 2006 Feb;64(2):259-64. PMID: 16413898 | PDF Authors: Ritter L, Yeshwant K, Seldin EB, Kaban LB, Gateno J, Keeve E, Kikinis R, Troulis MJ. Institution: Department of Oral and Maxillofacial Surgery, Massachusetts General Hospital, Boston, MA, USA. Background/Purpose: The purpose of this study was to determine the range of fixed trajectory curvilinear distraction devices required to correct a variety of severe mandibular deformities. Preoperative computed tomography (CT) scans from 18 patients with mandibular deformities were imported into a CT-based software program (Osteoplan). Three-dimensional virtual models of the individual skulls were made with landmarks to track movements. An ideal treatment plan was created for each patient. Upper and lower boundaries for the dimensions of curvilinear distractors were established based on manufacturing and geometric constraints. Then, anatomically acceptable distractor attachment points were identified on the models using proximal and distal grids. Treatment plans were simulated for a series of distractors with varying radii of curvature, elongations (arc-length of device), and placements along the grids. The outcomes using these distractors were compared with the ideal treatment plans. Discrepancies were quantified in millimeters by comparing landmarks in the simulated versus ideal movements. Approximately 400,000 simulated 3-dimensional movements, based on the distractor parameters and variations in placement were computationally evaluated for the 18 cases. It was determined that, by varying distractor placement, a family of 5 distractors, with 3, 5, 7, and 10 cm radii of curvature and a straight-line device, could be used to treat all 18 cases to within 1.8 mm of error. The results of this study indicate that a family of 5 curvilinear distractors may suffice to treat a broad range of mandibular deformities. Funding:
|
Preliminary Study on Digitized Nasal and Temporal Bone Anatomy
|
Publication: Clin Anat. 2006 Jan;19(1):32-6. PMID: 16283638 | PDF Authors: Li XP, Han DM, Xia Y, Zhou GH. Institution: ENT Department, Beijing Tongren Hospital Affiliated with Capital University of Medical Sciences, Beijing, China. Background/Purpose: The purpose of this study was to explore a feasible method for the reconstruction of the nasal and temporal bone structures of the Chinese virtual human project and provide a more accurate and facilitated way view them three-dimensionally (3D). The 3D Slicer software was used to reconstruct the anatomic structures of the human nose and temporal bone. Segmentation and extraction of the contours of the ROI (region of interest) in each single slice were conducted and the processed volume data was transferred into the 3D Slicer. After resegmentation, a set of labeled maps of the ROI were produced. Based on these maps, the 3D surface models of the tissues of interest were constructed. Four groups of paranasal sinuses, nasal septa, middle and inferior turbinates, temporal bones, tympanic cavities, mastoid air cells, sigmoid sinuses, and internal carotid arteries were reconstructed successfully. These models show spatial relationships and orientation between them. The results show that the 3D Slicer may be used for the 3D visualization of parts of anatomic structures in the nose and temporal bone based on the first Chinese virtual human data, and thus, can facilitate the observation and understanding of the anatomic structures in this area. Funding:
|
Developmental Response to Cold Stress in Cranial Morphology of Rattus: Implications for the Interpretation of Climatic Adaptation in Fossil Hominins
|
Publication: Proceedings of the Royal Society B: Biological Sciences 2006; 273:2605-10. | PDF Authors: Rae TC, Viðarsdottir US, Jeffery N, Steegmann AT Jr. Institution: Evolutionary Anthropology Research Group, Department of Anthropology, University of Durham, UK. Background/Purpose: Adaptation to climate occupies a central position in biological anthropology. The demonstrable relationship between temperature and morphology in extant primates (including humans) forms the basis of the interpretation of the Pleistocene hominin Homo neanderthalensis as a cold-adapted species. There are contradictory signals, however, in the pattern of primate craniofacial changes associated with climatic conditions. To determine the direction and extent of craniofacial change associated with temperature, and to understand the proximate mechanisms underlying cold adaptations in vertebrates in general, dry crania rom previous experiments on cold- and warm-reared rats were investigated using computed tomography scanning and three-dimensional digitization of cranial landmarks. Aspects of internal and external cranial morphology were compared using standard statistical and geometric morphometric techniques. The results suggest that the developmental response to cold stress produces subtle but significant changes in facial shape, and a relative decrease in the volume of the maxillary sinuses (and nasal cavity), both of which are independent of the size of the skull or postcranium. These changes are consistent with comparative studies of temperate climate primates, but contradict previous interpretations of cranial morphology of Pleistocene Hominini. |
A Ceratopsid Dinosaur Parietal from New Mexico and Its Implications for Ceratopsid Biogeography and Systematics
|
Publication: Journal of Vertebrate Paleontology 2006; 26:1018-20. | PDF Authors: Farke AA, Williamson TE. Institution: Department of Anatomical Sciences, Stony Brook University, NY, USA. Background/Purpose: Ceratopsid (horned dinosaur) cranial material is relatively common in the Upper Cretaceous Naashoibito Member of the Kirtland Formation, San Juan Basin, New Mexico. However, the specimens are fragmentary, making identification problematic. Previously, it has been suggested that the Naashoibito specimens represent Torosaurus utahensis, a chasmosaurine taxon originally known from the North Horn Formation of Utah. This identification has been used to support a Lancian age for the Naashoibito Member and the Alamo Wash local fauna of the Kirtland Formation (e.g., Lehman, 1981; Lucas et al., 1987). Others (e.g., Lehman, 1990) have synonomized T. utahensis with Torosaurus latus, a taxon otherwise known only from the late Maastrichtian Lance and Hell Creek formations. Recent work has upheld the validity of T. utahensis (Sullivan et al., 2005). However, Sullivan and colleagues (2005) have also argued that no previously described ceratopsid specimens from the Naashoibito Member are identifiable beyond the level of Chasmosaurinae indeterminate and therefore are not useful for assessing biostratigraphic correlations and ceratopsid biogeography. Here we describe a partial chasmosaurine ceratopsid parietal from the Naashoibito Member of the Kirtland Formation. Although other fragmentary parietals have been recovered from this unit (e.g., Lehman, 1981; Lucas et al., 1987), the new specimen exhibits unusual morphology: an epoccipital element positioned along the midline. This feature has previously been reported only in Triceratops, a taxon not known from south of the Denver Basin. The occurrence of such a feature in a ceratopsid from New Mexico has implications for ceratopsian systematics and biogeography. Funding:
|
2005
Magnetic Resonance Imaging and 3-Dimensional Analysis of External Anal Sphincter Anatomy
|
Publication: Obstet Gynecol. 2005 Dec;106(6):1259-65. PMID: 16319250 | PDF Authors: Hsu Y, Fenner DE, Weadock WJ, DeLancey JO. Institution: Pelvic Floor Research Group, Division of Gynecology, Department of Obstetrics and Gynecology, University of Michigan, Ann Arbor, MI, USA. Background/Purpose: To use magnetic resonance images of living women and 3-dimensional modeling software to identify the component parts and characteristic features of the external anal sphincter (EAS) that have visible separation or varying origins and insertions. Methods: Detailed structural analysis of anal sphincter anatomy was performed on 3 pelvic magnetic resonance imaging (MRI) data sets selected for image clarity from ongoing studies involving nulliparous women. The relationships of anal sphincter structures seen in axial, sagittal, and coronal planes were examined using the 3D Slicer 2.1b1 software package. The following were requirements for sphincter elements to be considered separate: 1) a clear and consistently visible separation or 2) a different origin or insertion. The characteristic features identified in this way were then evaluated in images from an additional 50 nulliparas for the frequency of feature visibility. There were 3 components of the EAS that met criteria as being "separate" structures. The main body (EAS-M) is separated from the subcutaneous external anal sphincter (SQ-EAS) by a clear division that could be observed in all (100%) of the MRI scans reviewed. The wing-shaped end (EAS-W) has fibers that do not cross the midline ventrally, but have lateral origins near the ischiopubic ramus. This EAS-W component was visible in 76% of the nulliparas reviewed. Three distinct external anal sphincter components can be identified by MRI in the majority of nulliparous women. Funding:
|
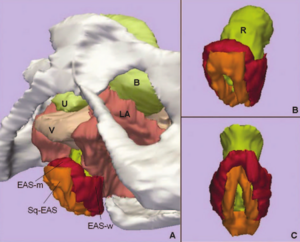 A. Inferior, left three-quarter view of model showing relationship of external anal sphincter complex to the bones and pelvic organs. B. Inferior, left three-quarter view of the external anal sphincter complex. External anal sphincter is in red; note the lateral wing portion of the external anal sphincter. Subcutaneous external anal sphincter is in orange. C. Posterior view of the external anal sphincter complex showing the circumferential nature of both the external anal sphincter and the subcutaneous external anal sphincter. U, urethra; B, bladder; V, vagina; LA, levator ani muscle; R, Rectum; EAS-M, main body of external anal sphincter; EAS-W, lateral wing portion of the external anal sphincter; SQ-EAS, subcutaneous external anal sphincter. |
Group-Slicer: A Collaborative Extension of 3D Slicer
|
Publication: J Biomed Inform. 2005 Dec;38(6):431-42. PMID: 16337568 | PDF Authors: Simmross-Wattenberg F, Carranza-Herrezuelo N, Palacios-Camarero C, Casaseca-de-la-Higuera P, Martín-Fernández MA, Aja-Fernández S, Ruiz-Alzola J, Westin C-F, Alberola-López C. Institution: Laboratorio de Procesado de Imagen, ETSI Telecomunicacion, Universidad de Valladolid, Valladolid, Spain. Background/Purpose: In this paper, we describe a first step towards a collaborative extension of the well-known 3D Slicer; this platform is nowadays used as a standalone tool for both surgical planning and medical intervention. We show how this tool can be easily modified to make it collaborative so that it may constitute an integrated environment for expertise exchange as well as a useful tool for academic purposes. Funding:
|
2D Rigid Registration of MR Scans using the 1D Binary Projections
|
Publication: Enformatika Transactions on Engineering, Computing and Technology, November 2005; 9:157-61. | PDF Author: Panos D. Kotsas Institution: Department of Automated Control and System Engineering, University of Sheffield, UK. Background/Purpose: This research deals with the application of a signal intensity independent registration criterion for 2D rigid body registration of medical images using 1D binary projections. The criterion is defined as the weighted ratio of two projections. The ratio is computed on a pixel per pixel basis and weighting is performed by setting the ratios between one and zero pixels to a standard high value. The mean squared value of the weighted ratio is computed over the union of the one areas of the two projections and it is minimized using the Chebyshev polynomial approximation using n=5 points. The sum of x and y parallel projections is used for translational adjustment and a range of parallel projections between 40-50 deg (depending on the orientation of the image) for rotational adjustment. MR-MR registration experiments were performed and gave mean errors well below 1deg and 1 pixel (0.12 deg and 0.47 pixels for the example given in Enformatika Publication). The method is to be extended for surface matching. |
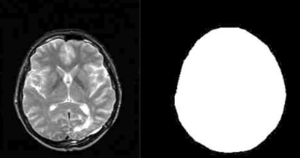 T2 MR scan (contrast enhanced) and mask created with 3D Slicer software |
Preoperative Hepatic 3D Models: Virtual Liver Resection using Three-dimensional Imaging Technique
|
Publication: Eur J Radiol. 2005 Nov;56(2):179-84. PMID: 15890482 Authors: Numminen K, Sipilä O, Mäkisalo H. Institution: Helsinki Medical Imaging Center, Department of Radiology, Helsinki University Central Hospital, Helsinki, Finland. Background/Purpose: Emerging new techniques for liver resections set new requirements for the preoperative imaging and planning. Open surgery is a three-dimensional procedure and planning of the resection line may be difficult when basing on conventional two-dimensional CTs or MRIs, although all the information is there. With multidetector-row CT (MDCT), thin slices can be obtained with excellent temporal resolution, and precise three-dimensional (3D) models can be created. We regard 3D imaging technique useful in most liver resections. It improves the surgeon's knowledge of liver anatomy and makes even more complicated liver resections safe. Better knowledge of three-dimensional appearances of liver structures may further improve the results of curative liver surgery. However, before becoming a routine clinical procedure, research and development are still needed. Also, careful testing and evaluation of the methods have to be performed. In the future, 3D models will probably play an important role in the preoperative planning of liver resections. |
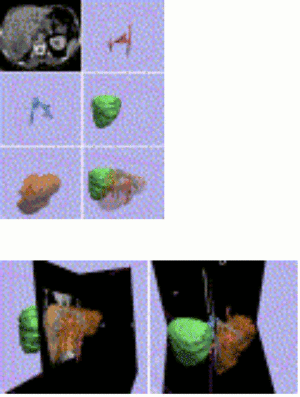 A 76-year-old man with hepatocellular carcinoma. MDCT image shows large tumor in liver segments 5-8 (a). Semi-automatic segmentation based on thresholding, morphological operations and connected component labelling is utilized to create a triangulated surface model. Segmented structures can be visualized with different colors and opacities. 3D model from portal veins (b), from hepatic veins (c), liver tumor (d) and liver parenchyma (e). The model can be studied freely from any direction on the computer screen (f). Resection line is configured immediately right to the middle hepatic vein (g). Vessels crossing the resection line can be visualized and easily found when performing right-sided lobectomy (h). |
Three-dimensional Reconstruction and Volumetry of Intracranial Haemorrhage and its Mass Effect
|
Publication: Neuroradiology. 2005 Jun;47(6):417-24. PMID: 15856213 | PDF Authors: Strik HM, Borchert H, Fels C, Knauth M, Rienhoff O, Bähr M, Verhey JF. Institution: Department of Neurology, Medical School, University of Göttingen, Germany. Background/Purpose: Intracerebral haemorrhage still causes considerable disability and mortality. The studies on conservative and operative management are inconclusive, probably due to inexact volumetry of the haemorrhage. We investigated whether three-dimensional (3D), voxel-based volumetry of the haemorrhage and its mass effect is feasible with routine computed tomography (CT) scans. The volumes of the haemorrhage, ventricles, midline shift, the intracranial volume and ventricular compression in CT scans of 12 patients with basal ganglia haemorrhage were determined with the 3D Slicer software. Indices of haemorrhage and intracranial or ventricular volume were calculated and correlated with the clinical data. The intended measures could be determined with an acceptable intra-individual variability. The 3D volumetric data tended to correlate better with the clinical course than the conventionally assessed distance of midline shift and volume of haemorrhage. 3D volumetry of intracranial haemorrhage and its mass effect is feasible with routine CT examination. Prospective studies should assess its value for clinical studies on intracranial space-occupying diseases. |
Vaginal Thickness, Cross-Sectional Area, and Perimeter in Women with and Those without Prolapse
|
Publication: Obstet Gynecol. 2005 May;105(5 Pt1):1012-7. PMID: 15863538 | PDF Authors: Hsu Y, Chen L, Delancey JO, Ashton-Miller JA. Institution: Division of Gynecology, Department of Obstetrics and Gynecology, University of Michigan Medical School, Ann Arbor, MI, USA. Background/Purpose: Use axial magnetic resonance imaging to test the null hypothesis that no difference exists in apparent vaginal thickness between women with and those without prolapse. Magnetic resonance imaging studies of 24 patients with prolapse at least 2 cm beyond the introitus were selected from an ongoing study comparing women with prolapse with normal control subjects. The magnetic resonance scans of 24 women with prolapse (cases) and 24 women without prolapse (controls) were selected from those of women of similar age, race, and parity. The magnetic resonance files were imported into an experimental modeling program, and 3-dimensional models of each vagina were created. The minimum transverse plane cross-sectional area, mid-sagittal plane diameter, and transverse plane perimeter of each vaginal model were calculated. Neither the mean age (cases 58.6 years ± standard deviation [SD] 14.4 versus controls 59.4 years ± SD 13.2) nor the mean body mass index (cases 24.1 kg/m2± SD 3.3, controls 25.7 kg/m2± SD 3.7) differed significantly between groups. Minimum mid-sagittal vaginal diameters did not differ between groups. Patients with prolapse had larger minimum vaginal cross-sectional areas than controls (5.71 cm2± standard error of the mean [SEM] 0.25 versus 4.76 cm2± SEM 0.20, respectively; P = .005). The perimeter of the vagina was also larger in the prolapse group (11.10 cm ± SEM 0.24) compared with controls (9.96 cm ± SEM 0.22) P = .001. Subgroup analysis of patients with endogenous or exogenous estrogen showed prolapse patients had larger vaginal cross-sectional area (P = .030); in patients without estrogen group differences were not significant (P = .099). Vaginal thickness is similar in women with and those without pelvic organ prolapse. The vaginal perimeter and cross-sectional areas are 11% and 20% larger in prolapse patients, respectively. Estrogen status did not affect differences found between groups. Funding:
|
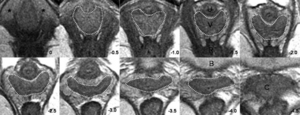 Axial slices at 5-mm intervals arranged caudal to cephalad starting from the image in the upper left (image 0). Vaginal tracings were made from above the level of the vestibular bulbs (VB), represented by asterisks (*), caudally (image 0) to below where the cervix (C) could be seen (image -4.0). U, urethra; V, vagina; R, rectum; B, bladder. |
Registration and Fusion of CT and MRI of the Temporal Bone
|
Publication: J Comput Assist Tomogr. 2005 May-Jun;29(3):305-10. PMID: 15891495 | PDF Authors: Bartling S, Peldschus K, Rodt T, Kral F, Matthies H, Kikinis R, Becker H. Institution: Department of Neuroradiology, Hannover Medical School, Hannover, Germany. Background/Purpose: CT and MRI of the skull base and the Temporal provides complimentary information. A registration and fusion of CT and MRI may improve diagnosis, because features only seen in one modality can be assessed with respect to the information gathered from the other modality. A manual, rigid registration method - basically overlaying two volumes in one space - as implemented in 3D Slicer was used. Threshold based fusion methods resulted in MRI overlaying co-registered CT. Landmarks have been used to assess target registration error - registration accuracy was within the range of the voxel size of either modality. A range of different pathological conditions was used to demonstrate the potential benefits of this methods. |
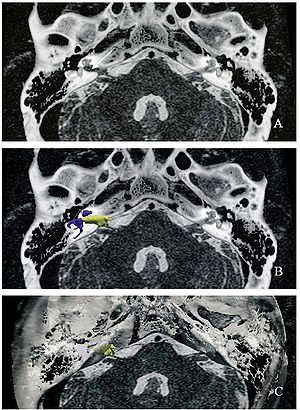 Acoustic schwannoma in the right internal auditory canal (arrow) in registered and fused CT and MRI of the temporal bone. For surgical planning, the MRI-given tumor (yellow) and critical CT-given surgical landmarks such as the labyrinth (blue) and the facial nerve canal (gray) as well as the bony skull base (white) can be displayed together. |
Open-configuration MR-guided Microwave Thermocoagulation Therapy for Metastatic Liver Tumors from Breast Cancer]
|
Publication: Breast Cancer. 2005;12(1):26-31. PMID: 15657520 | PDF Authors: Abe H, Kurumi Y, Naka S, Shiomi H, Umeda T, Naitoh H, Endo Y, Hanasawa K, Morikawa S, Tani T. Institution: Division of General Surgery, Department of Surgery, Shiga University of Medical Science, Seta-Tsukinowa, Otsu, Shiga, Japan. Background/Purpose: Liver metastases from breast cancer are associated with a poor prognosis, however, local control with microwave thermocoagulation therapy has been used in certain subgroups of these patients in the past decade. In this study, open-configuration magnetic resonance (MR) -guided microwave thermocoagulation therapy was used for metastatic liver tumors from breast cancer, and the efficacy of this treatment was assessed. Methods: Between June 2000 and April 2004, we used MR-guided microwave thermocoagulation therapy on 11 nodules in 8 patients with metastatic liver tumors from breast cancer. The procedure was carried out under general anesthesia. A 0.5 T open-configuration MR system and a microwave coagulator were used. Near-real-time MR images and real-time temperature images were collected and displayed on the monitor. The MR-compatible thoracoscope was used and combined with MR imaging guidance. Navigation software, a 3D Slicer, was installed and customized. The customized navigation software displayed near-real-time MR images. The percutaneous puncture into the tumors was successful in all cases. No mortality or major complications occurred as a result of the procedures. Five of the 8 patients are alive with new metastatic foci with a mean observation period of 25.9 months. We developed several devices to allow safe, easy, and accurate MR-guided microwave thermocoagulation therapy of liver tumors. Open-configuration MR-guided microwave thermocoagulation therapy appears to be a feasible method for tumor ablation of metastatic liver tumors from breast cancer. |
Quantification of Airway Diameters and 3D Airway Tree Rendering from Dynamic Hyperpolarized 3He Magnetic Resonance Imaging
|
Publication: Magn Reson Med. 2005 Feb;53(2):474-8. PMID: 15678546 | PDF Authors: Lewis TA, Tzeng YS, McKinstry EL, Tooker AC, Hong K, Sun Y, Mansour J, Handler Z, Albert MS. Institution: Brigham and Womem's Hospital, Harvard Medical School, Boston, MA, USA. Background/Purpose: As another step toward extracting quantitative information from hyperpolarized 3He MRI, airway diameters in humans were measured from projection images and multislice images of the lungs. Values obtained were in good agreement with the Weibel lung morphometry model. The measurement of airway caliber can now be achieved without the use of ionizing radiation. Furthermore, it was demonstrated that 3D airway tree renderings could be constructed from the multislice data. Both the measurement of airway diameters and the rendering of 3D airway information hold promise for the clinical assessment of bronchoconstrictive diseases such as asthma and the associated evaluation of treatment effectiveness. Work is being done to address the uncertainties of the manually intensive methods we have developed. Funding:
|
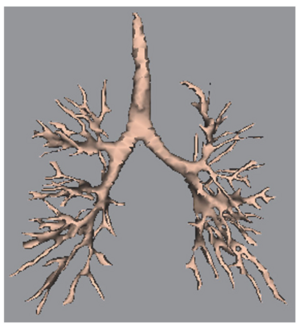 Airway tree constructed from stacking dynamic multislice data sets in 3D Slicer. |
A Finite Element Method Model to Simulate Laser Interstitial Thermo Therapy in Anatomical Inhomogeneous Regions
|
Publication: Biomed Eng Online. 2005 Jan 4;4(1):2. PMID: 15631630 | PDF Authors: Mohammed Y, Verhey JF. Institution: Department of Medical Informatics, University of Goettingen, Goettingen, Germany. Background/Purpose: Laser Interstitial ThermoTherapy (LITT) is a well established surgical method. The use of LITT is so far limited to homogeneous tissues, e.g. the liver. One of the reasons is the limited capability of existing treatment planning models to calculate accurately the damage zone. The treatment planning in inhomogeneous tissues, especially of regions near main vessels, poses still a challenge. In order to extend the application of LITT to a wider range of anatomical regions new simulation methods are needed. The model described with this article enables efficient simulation for predicting damaged tissue as a basis for a future laser-surgical planning system. Previously we described the dependency of the model on geometry. With the presented paper including two video files we focus on the methodological, physical and mathematical background of the model. |
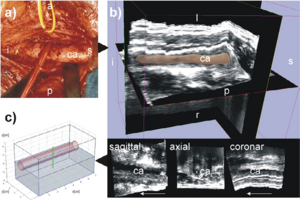 The geometry used. The left carotid artery is shown in this figure labelled with ca. The following letters indicate the orientation: s for superior, i for inferior, p for posterior, a for anterior, l for left, r for right. (a) is a photo of the human anatomy in the neck area. The carotid artery is shown here after moving the vein to the cranial direction. (b) shows the corresponding freehand 3D ultrasound dataset of the human neck region acquired axially. The 3D image in the top of (b) shows the 3D ultrasound volume together with the carotid artery segmented with 3D Slicer software [17]. The 3D model is displayed with 40% transparency. (c) displays the model used in the simulation approximated according to the geometry of the human neck shown in (a) and (b). The segmentation of the 3D ultrasound dataset in (b), is available as a video stream, too, showing the geometry of the carotid artery. |
The Application of DTI to Investigate White Matter Abnormalities in Schizophrenia
|
Publication: Ann. N.Y. Acad. Sci. 2005; 1064:134-48. PMID: 16394153 | PDF Authors: Kubicki M, Westin C-F, McCarley RW, Shenton ME. Institution: Clinical Neuroscience Division, Laboratory of Neuroscience, Boston VA Healthcare System–Brockton Division, Department of Psychiatry, Harvard Medical School, Brockton, MA, USA. Background/Purpose: Schizophrenia is a serious and disabling mental disorder that affects approximately 1% of the general population, with often devastating effects on the psychological and financial resources of the patient, family, and larger community. The etiology of schizophrenia is not known, although it likely involves several interacting biological and environmental factors that predispose an individual to schizophrenia. However, although the underlying pathology remains unknown, it has been believed that brain abnormalities would ultimately be linked to the etiology of schizophrenia. This theory was rekindled in the 1970s, when the first computer-assisted tomography (CT) study showed enlarged lateral ventricles in schizophrenia. Since that time, there have been many improvements in MR acquisition and image processing, including the introduction of positron emission tomography (PET), followed by functional MR (fMRI), and diffusion tensor imaging (DTI). These advances have led to an appreciation of the critical role that brain abnormalities play in schizophrenia. While structural MRI has proven to be useful in investigating and detecting gray matter abnormalities in schizophrenia, the investigation of white matter has proven to be more challenging as white matter appears homogeneous on conventional MRI and the fibers connecting different brain regions cannot be appreciated. With the development of DTI, we are now able to investigate white matter abnormalities in schizophrenia. Funding:
|
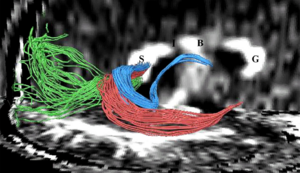 Fibers traveling through the splenium of the corpus callosum are shown, where fibers connecting the left and right occipital lobe are displayed in green, fibers interconnecting lateral temporal regions are displayed in red, and fibers connecting medial temporal regions are displayed in blue. Additionally, the genu of the corpus callosum is labeled as “G”, the body as “B”, the isthmus as “I”, and the splenium as “S”. |
2004
A Statistically Based Flow for Image Segmentation
|
Publication: Med Image Anal. 2004 Sep;8(3):267-74. PMID: 15450221 | PDF Authors: Pichon E, Tannenbaum A, Kikinis R. Institution: School of Electrical & Computer Engineering, Georgia Institute of Technology, Atlanta, GA, USA. Background/Purpose: In this paper we present a new algorithm for 3D medical image segmentation. The algorithm is versatile, fast, relatively simple to implement, and semi-automatic. It is based on minimizing a global energy defined from a learned non-parametric estimation of the statistics of the region to be segmented. Implementation details are discussed, and source code is freely available as part of the 3D Slicer project. In addition, a new unified set of validation metrics is proposed. Results on artificial and real MRI images show that the algorithm performs well on large brain structures both in terms of accuracy and robustness to noise. Funding:
|
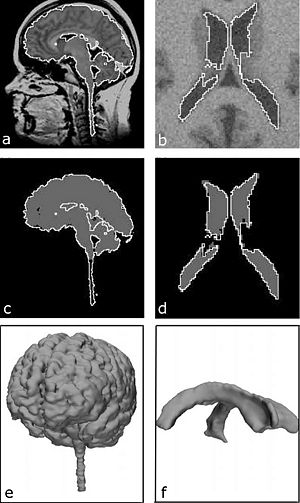 Results on real and noisy simulated datasets (left and right respectively): (a) sagittal slice of real dataset and proposed segmentation (WM GM); (b) axial slice of artificial dataset and proposed segmentation (ventricle); (c) expert segmentation (gray) and proposed segmentation (white); (d) underlying ground truth (gray) and proposed segmentation (white); (e) rendered surface of proposed segmentation (WM GM); (f) rendered surface of proposed segmentation (ventricle). |
Decreases in Ventricular Volume Correlate with Decreases in Ventricular Pressure in Idiopathic Normal Pressure Hydrocephalus Patients Who Experienced Clinical Improvement after Implantation with Adjustable Valve Shunts
|
Publication: Neurosurgery. 2004 Sep;55(3):582-92. PMID: 15335425 | PDF Authors: McConnell KA, Zou KH, Chabrerie AV, Bailey NO, Black PM. Institution: Department of Neurosurgery, Brigham and Women's Hospital, Harvard Medical School, Boston, MA, USA. Background/Purpose: This retrospective study examined whether changes in ventricular volume correspond with changes in adjustable valve pressure settings in a cohort of patients who received shunts to treat idiopathic normal pressure hydrocephalus. We also examined whether these pressure-volume curves and other patient variables would co-occur with a positive clinical response to shunting. Methods: We selected 51 patients diagnosed with idiopathic normal pressure hydrocephalus who had undergone implantation of a Codman Hakim programmable valve (Medos S.A., Le Locle, Switzerland). Clinical data were gathered from the patients. Funding:
|
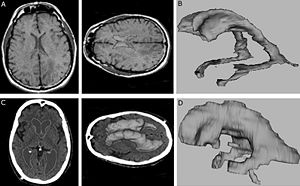 3D Slicer software segmentation of the ventricular system of a subject without hydrocephalus (A) used to produce the three-dimensional model of a normal, nonhydrocephalic ventricular system (B). C and D, 3D Slicer software segmentation of the ventricular system of a subject with INPH (C) used to produce the three-dimensional model of a hydrocephalic ventricular system (D). |
Spatial Motion Constraints in Medical Robot using Virtual Fixtures Generated by Anatomy
|
Publication: Proceedings of the 2004 IEEE International Conference on Robotics & Automation, ICRA 2004. | PDF Authors: Li M, Taylor RH. Institution: Department of Computer Science, NSF Engineering Research Center for Computer Integrated Surgical Systems and Technology, Johns Hopkins University, Baltimore, MD, USA. Background/Purpose: In Ear, Nose and Throat (ENT) surgery, the operating volume is very limited. This is especially true in sinus surgery, when the instrument passes through the nasal and sinus cavity to reach the pathological area. The nasal and sinus bones impose geometric constraints on the work volume. During the surgery, the surgeon needs to control the motion of the instrument tip to accomplish some delicate procedure; meanwhile he/she needs to avoid hitting anatomic constraints. In this paper, we present a method to assist the path following task in a constrained area. The system reads the user’s force input and combines it with the planned tip-trajectory to create the tip motion constraints; meanwhile it generates the tool-shaft boundary constraints based on a 3D geometric model. We map instrument tip motion and boundary information to joint displacements via robot kinematics, and then use a constrained quadratic optimization algorithm to compute the optimal set of corresponding joint displacements. In the preliminary study, we show that robot guidance using cooperative control and virtual fixtures derived from complex geometry can assist users in skilled manipulation tasks, while maintaining desirable properties such as collision avoidance and safety. Funding:
|
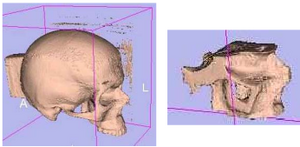 3D Slicer surface models of test phantom. (left) whole skull surface model and, (right) the model of nasal cavity portion used to generate constraints |
Clinical Validation of the Normalized Mutual Information Method for Registration of CT and MR Images in Radiotherapy of Brain Tumors
|
Publication: J Appl Clin Med Phys. 2004 Summer;5(3):66-79. PMID: 15753941 | PDF Authors: Veninga T, Huisman H, van der Maazen RW, Huizenga H. Institution: Department of Radiation Oncology, University Medical Center Nijmegen, The Netherlands. Background/Purpose: Image registration integrates information of different imaging modalities and has the potential to improve target volume determination in radiotherapy planning. This paper describes the implementation and validation of a 3D fully automated registration procedure in the process of radiotherapy treatment planning of brain tumors. 15 Patients with various brain tumors received CT and MR brain imaging before the start of radiotherapy. The normalized mutual information (NMI) method was used for image registration. Registration accuracy was estimated by performing statistical analysis of coordinate differences between CT and MR anatomical landmarks along the x-, y- and z-axes. Second, a visual validation protocol was developed to validate the quality of individual registration solutions and this protocol was tested in a series of 36 CT-MR registration procedures with intentionally applied registration errors. The mean coordinate differences between CT and MR landmarks along the x- and y-axes were in general within 0.5 mm. The mean coordinate differences along the z-axis were within 1.0 mm, which is of the same magnitude as the applied slice thickness in scanning. Second, the detection of intentionally applied registration errors by employment of a standardized visual validation protocol resulted in low false-negative and low false-positive rates. Application of the NMI method for the brain results in excellent automatic registration accuracy and the method has been incorporated in daily routine within our institute. A standardized validation protocol is proposed that ensures the quality of individual registrations by detecting registration errors with high sensitivity and specificity. This protocol is proposed for the validation of other linear registration methods. |
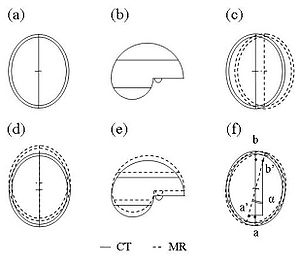 For the purpose of individual quality assurance (QA) of image registration, an independent visual validation protocol was developed, using 3D Slicer, a freely available software program for visualization and processing of medical data. All image data were transferred to 3D Slicer in DICOM format. The validation protocol consists of a stepwise procedure for an estimate of translation errors along the three orthogonal axes (Trx, Try, and Trz) as well as rotation errors around these three axes (Rx, Ry, and Rz). |
Diffusion-tensor Imaging–guided Tracking of Fibers of the Pyramidal Tract Combined with Intraoperative Cortical Stimulation Mapping in Patients with Gliomas
|
Publication: J Neurosurg. 2004 Jul;101(1):66-72. PMID: 15255253 | PDF Authors: Berman JI, Berger MS, Mukherjee P, Henry RG. Institution: Department of Radiology, University of California at San Francisco, CA, USA. Background/Purpose: The goal of this study was to use diffusion-tensor (DT) magnetic resonance (MR) imaging to track fibers combined with cortical stimulation mapping to delineate descending motor pathways. Subcortical localization of motor path-ways in relation to a glioma may provide critical information to guide tumor resection and prevent surgical morbidity. Methods: Eleven adult patients harboring gliomas underwent MR imaging 1 day prior to image-guided intraoperative cortical motor mapping and tumor resection. Screens depicting 27 cortical motor sites on a surgical navigation system were saved to launch DT imaging of fiber tracks of descending motor pathways. The position and organization of motor tracts were visualized by fiber tracking. Tracks from 16 motor stimulation sites followed descending pathways from the precentral gyrus, through the corona radiata and internal capsule, and into the cerebral peduncle. These tracks were also observed on DT images to diverge along crossing white matter bundles (four patients) and to terminate or deviate in regions of peritumoral vasogenic edema (five patients). The use of precise intraoperative cortical mapping information and DT images of fiber tracks can reveal the course of motor pathways beneath the cortex. The subcortical fiber tracks generated are consistent with the known anatomical course and somatotopic organization of the motor tract in relation to its cortical origins. Tracking fibers by using DT imaging in combination with functional localization has the potential to reduce surgical morbidity by revealing subcortical connections of the functional cortex. Funding:
|
Abnormal Association Between Reduced Magnetic Mismatch Field to Speech Sounds and Smaller Left Planum Temporale Volume in Schizophrenia
|
Publication: NeuroImage 2004; 22:720-7. PMID: 15193600 | PDF Authors: Yamasue H, Yamada H, Yumoto M, Kamio S, Kudo N, Uetsuki M, Abe O, Fukuda R, Aoki S, Ohtomo K, Iwanami A, Kato N, Kasai K. Institution: Department of Neuropsychiatry, Graduate School of Medicine, University of Tokyo, Bunkyo, Tokyo, Japan. Background/Purpose: Schizophrenia is associated with language-related dysfunction. A previous study [Schizophr. Res. 59 (2003c) 159] has shown that this abnormality is present at the level of automatic discrimination of change in speech sounds, as revealed by magnetoencephalographic recording of auditory mismatch field in response to across-category change in vowels. Here, we investigated the neuroanatomical substrate for this physiological abnormality. Thirteen patients with schizophrenia and 19 matched control subjects were examined using magnetoencephalography (MEG) and high-resolution magnetic resonance imaging (MRI) to evaluate both mismatch field strengths in response to change between vowel /a/ and /o/, and gray matter volumes of Heschl's gyrus (HG) and planum temporale (PT). The magnetic global field power of mismatch response to change in phonemes showed a bilateral reduction in patients with schizophrenia. The gray matter volume of left planum temporale, but not right planum temporale or bilateral Heschl's gyrus, was significantly smaller in patients with schizophrenia compared with that in control subjects. Furthermore, the phonetic mismatch strength in the left hemisphere was significantly correlated with left planum temporale gray matter volume in patients with schizophrenia only. These results suggest that structural abnormalities of the planum temporale may underlie the functional abnormalities of fundamental language-related processing in schizophrenia. Funding:
|
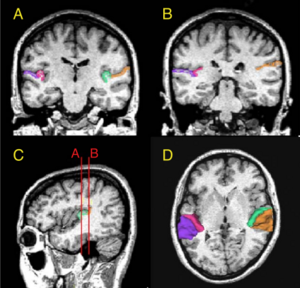 (A and B) Delineation of Heschl’s gyrus and planum temporale in a coronal slice in rostral and caudal part of regions of interest, respectively, based on MRI data of a control subject. The gray matter of Heschl’s gyrus is labeled green on subject left and wine-red on subject right. The gray matter of planum temporale is orange on subject left and violet on subject right. (C) Sagittal view of the Heschl’s gyrus and planum temporale in the left hemisphere. The coronal lines A and B correspond to the planes of panels A and B, respectively. (D) Three-dimensional reconstruction of Heschl’s gyrus and planum temporale gray matter superimposed on the axial plane. Each region is labeled using the same color as that in panels A, B and C. |
2003
Genetic Contribution to Cartilage Volume in Women: A Classical Twin Study
|
Publication: Rheumatology (Oxford). 2003 Dec;42(12):1495-500. PMID: 12832711 | PDF Authors: Hunter DJ, Snieder H, March L, Sambrook PN. Institution: Institute of Bone and Joint Research, Royal North Shore Hospital, University of Sydney, Australia. Background/Purpose: A classical twin study was performed to assess the relative contribution of genetic and environmental factors to cartilage volume. Methods: The subjects were 136 adult female twins: 31 monozygotic and 37 dizygotic twin pairs. The subjects had a T2-weighted fat-saturated sagittal gradient echo MRI performed of their right knee. Femoral, tibial and patella cartilage volumes were measured using 3D Slicer software that facilitates semi-automatic segmentation, generation of three-dimensional surface models and quantitative analysis. The intraclass correlations were calculated, and maximum-likelihood model fitting was used to estimate genetic and environmental variance components. All variables were adjusted for age, BMI and femoral condyle size. The intraclass correlations for all of the cartilage volumes assessed were higher in monozygotic than dizygotic twin pairs. The heritabilities (95% confidence intervals) obtained from model fitting were: femoral, 61% (36-77%); tibial, 76% (56-87%); patella, 66% (47-79%); and total cartilage volume, 73% (51-85%). This study provides evidence for the importance of genetic factors in determining cartilage volume. Identifying heritability is the first step on the way to finding specific genes, which may improve our insight in the pathophysiology of cartilage disorders including the etiology of complex diseases such as osteoarthritis. Funding:
|
Advanced Computer Assistance for Magnetic Resonance-guided Microwave Thermocoagulation of Liver Tumors
|
Publication: Acad Radiol. 2003 Dec;10(12):1442-9. PMID: 14697012 | PDF Authors: Morikawa S, Inubushi T, Kurumi Y, Naka S, Sato K, Demura K, Tani T, Haque HA, Tokuda J, Hata N. Institution: Molecular Neuroscience Research Center, Shiga University of Medical Science, Seta Tsukinowa-cho, Ohtsu, Shiga, Japan. Background/Purpose: The purpose of this study was to utilize computer assistance effectively for both easy and accurate magnetic resonance (MR) image-guided microwave thermocoagulation therapy of liver tumors. An open configuration MR scanner and a microwave coagulator at 2.45 GHz were used. A navigation software, 3D Slicer, was customized to combine fluoroscopic MR images and preoperative MR images for the navigation. New functions to display MR temperature maps with simple parameter setting, and to record and display the coagulated areas by multiple microwave ablations in the 3-dimensional space (footprinting), were also introduced into the software. The VGA signal of the computer display was directly transferred to the surgeon's monitor. The customized software could be used for both accurate image navigation and convenient and easy temperature monitoring. Because repeated punctures and ablations are usually required in this procedure, the footprinting function made targeting of the tumors both easy and accurate and was quite effective in achieving the necessary and sufficient treatment. Furthermore, clear display on the surgeon's monitor, which was obtained by direct transfer of the VGA signal, enabled precise image navigation. The newly developed computer assistance was quite useful and helpful for this MR-guided procedure. |
The Association of Cartilage Volume with Knee Pain
|
Publication: Osteoarthritis Cartilage. 2003 Oct;11(10):725-9. PMID: 13129691 | PDF Authors: Hunter DJ, March L, Sambrook PN. Institution: Institute of Bone and Joint Research, Royal North Shore Hospital, Sydney, Australia. Background/Purpose: Whilst the characteristic pathologic feature of OA is the loss of hyaline cartilage, prior studies have demonstrated a poor relationship between severity of reported knee pain and degree of radiographic change. The aim of this study was to examine the association between knee symptoms and MRI cartilage volume. DESIGN: A cross-sectional study was performed to assess the association between knee symptoms and MRI cartilage volume in an unselected, community based population. The subjects were 133 postmenopausal females. The subjects had a T2-weighted fat saturated sagittal gradient-echo MRI performed of their right knee. Femoral, tibial and patella cartilage volumes were measured using 3D Slicer, a software that facilitates semi-automatic segmentation, generation of 3D surface models and quantitative analysis. Qualitative data relating to symptoms, stiffness, pain, physical dysfunction and the quality of life using the WOMAC were recorded. The statistical analyses conducted to determine measures of association between knee pain/symptoms and cartilage volume were correlation, multiple regression and inter-quartile regression. Assessment of the association between patella cartilage volume and the WOMAC domains showed an inverse relationship between patella cartilage volume and pain, function and global score in a model including body mass index, physical activity and leg extensor power (all P=0.01). Inter-quartile regression comparing the lowest 25% with highest 25% patella cartilage volume demonstrated a stronger inverse relationship (P=0.005). This study suggests that alterations in patella volume are associated with pain, function and global scores of the WOMAC. In participants with more knee pain, there was an association with severity of patella cartilage reduction. Other MRI cartilage volume features were not strongly associated with WOMAC sub-scores. |
Three-dimensional Reconstruction of Magnetic Resonance Images of the Anal Sphincter and Correlation between Sphincter Volume and Pressure
|
Publication: Am J Obstet Gynecol. 2003 Jul;189(1):130-5. PMID: 12861151 | PDF Authors: Cornella JL, Hibner M, Fenner DE, Kriegshauser JS, Hentz J, Magrina JF. Institution: Mayo Graduate School of Medicine, Rochester, MN, USA. Background/Purpose: The purpose of this study was to assess the correlation between internal and external anal sphincter volumes and manometric anal pressures. Ten healthy nulliparous women underwent anal sphincter magnetic resonance imaging and anal manometry measurement. A 3-dimensional reconstruction of magnetic resonance images was accomplished with the use of 3D Slicer. Sphincter volumes were measured 3 times by the same observer for each of 10 patients. The intrarater reliability was measured with the use of the intraclass correlation coefficient (ICC = sigma2(patients)/(sigma 2(patients) + sigma2(error))) from a 2-way analysis of variance model with terms for patient and measurement trial. Measurements that were recorded on anal manometry included squeeze length, length of the high-pressure zone, and maximal resting and squeeze pressures. The mean volumes (± SD) were 18.77 ± 4.64 cm3, 13.82 ± 3.8 cm3, and 32.36 ± 8.37 cm3 for internal, external, and combined sphincters, respectively. Intrarater reliability was 98% for external sphincter volume (95% CI, 94%-99%), 98% for internal sphincter volume (95% CI, 94%-99%), and 99% for total volume (95% CI, 97%-100%). On the 3-dimensional images, the internal sphincter was found to be cylindric in shape, with an ellipse as a base. It is elongated in the anterior and posterior direction and flattened on the sides. The external sphincter was found to be funnel-shaped, being narrower caudad and widening in the cephalad direction. Similar to the internal sphincter, the external sphincter is elongated in the anteroposterior diameter. Volumes of the internal, external, and combined sphincters did not correlate with the maximum pressures at rest and squeeze. Correlations higher than r = 0.5 were observed for all 3 sphincter volume measurements versus high pressure zone at squeeze. The highest correlation, r = 0.66, was for internal sphincter volume versus high pressure zone at squeeze Three-dimensional reconstruction of the rectal sphincter musculature can be performed easily with 3-dimensional software. Measurements of the sphincter volumes have excellent intrarater reliability. Sphincter volumes do not correlate with pressures at rest or squeeze, but the internal sphincter volume correlates with the length of the high pressure zone at squeeze. Contrary to current generalized concepts, it is possible that the internal sphincter may play some role in generating the squeeze pressure. More research is necessary in applying 3-dimensional magnetic resonance image reconstruction in patients with different parity and continence status. Reconstruction of magnetic resonance images of the rectal sphincter musculature may prove to be beneficial in planning the treatment of patients with fecal incontinence. |
|
Publication: Acta Neurochir Suppl. 2003;85:121-5. PMID: 12570147 | PDF Authors: Nabavi A, Gering DT, Kacher DF, Talos IF, Wells WM, Kikinis R, Black PM, Jolesz FA. Institution: Department of Neurosurgery, University Kiel, Kiel, Germany. Background/Purpose: The introduction of MRI into neurosurgery has opened multiple avenues, but also introduced new challenges. The open-configuration intraoperative MRI installed at the Brigham and Women's Hospital in 1996 has been used for more than 500 open craniotomies and beyond 100 biopsies. Furthermore the versatile applicability, employing the same principles, is evident by its frequent use in other areas of the body. However, while intraoperative scanning in the SignaSP yielded unprecedented imaging during neurosurgical procedures their usage for navigation proved bulky and unhandy. To be fully integrated into the procedure, acquisition and display of intraoperative data have to be dynamic and primarily driven by the surgeon performing the procedure. To use the benefits of computer-assisted navigation systems together with immediate availability of intraoperative imaging we developed a software package. 3D Slicer has been used routinely for biopsies and open craniotomies. The system is stable and reliable. Pre- and intraoperative data can be visualized to plan and perform surgery, as well as to accommodate for intraoperative deformations, "brain shift", by providing online data acquisition. Funding:
|
The Virtual Craniofacial Patient: 3D Jaw Modeling and Animation
|
Publication: Stud Health Technol Inform. 2003;94:65-71. PMID: 15455866 | PDF Authors: Enciso R, Memon A, Fidaleo DA, Neumann U, Mah J. Institution: Craniofacial Virtual Reality Laboratory, University of Southern California, CA, USA. Background/Purpose: Recent developments in technology and software are providing better data and methods to facilitate research in biomedical modeling and simulation. In the area of segmentation, original methods involved the time-consuming task of manually tracing structures from slice to slice. This process is now possible with significantly less interaction from the user. Programs such as 3D Slicer, Mimics (Materialise N.V., Heverlee, Belgium) and Amira 2.3 (TGS) provide semi-automatic image-processing-based segmentation and modeling from CT images. These programs use the Generalized Marching Cubes algorithm to create a polygonal wireframe mesh of the segmented area and export a model in STL or other formats. Funding:
|
2002
A 3D Fiber Model of the Human Brainstem
|
Publication: Comput Med Imaging Graph. 2002 Nov-Dec;26(6):439-44. PMID: 12453507 | PDF Authors: Axer H, Leunert M, Mürköster M, Grässel D, Larsen L, Griffin LD, Graf v Keyserlingk D. Institution: Department of Neurology, Friedrich-Schiller-University, Jena, Germany. Background/Purpose: A new neuroanatomic approach to evaluate the fiber orientation in gross histological sections of the human brain was developed. Serial sections of a human brainstem were used to derive fiber orientation maps by analysis of polarized light sequences of these sections. Fiber inclination maps visualize angles of inclination, and fiber direction maps show angles of direction. These angles define vectors which can be visualized as RGB-colors. The serial sections were aligned to each other using the minimized Euclidian distance as fit criterion. In the 3D data set of the human brainstem the major fiber tracts were segmented, and three-dimensional models of these fiber tracts were generated. The presented results demonstrate that two kinds of fiber atlases are feasible: a fiber orientation atlas representing a vector in each voxel, which shows the nerve fiber orientation, and a volume-based atlas representing the major fiber tracts. These models can be used for the evaluation of diffusion tensor data as well as for neurosurgical planning. |
3D Visualisation of the Middle Ear and Adjacent Structures Using Reconstructed Multi-slice CT Datasets, Correlating 3D Images and Virtual Endoscopy to the 2D Cross-sectional Images
|
Publication: Neuroradiology. 2002 Sep;44(9):783-90. PMID: 12221454 | PDF Authors: Rodt T, Ratiu P, Becker H, Bartling S, Kacher DF, Anderson M, Jolesz FA, Kikinis R. Institution: Department of Neuroradiology, Hannover Medical School, Hannover, Germany. Background/Purpose: The 3D imaging of the middle ear facilitates better understanding of the patient's anatomy. Cross-sectional slices, however, often allow a more accurate evaluation of anatomical structures, as some detail may be lost through post-processing. In order to demonstrate the advantages of combining both approaches, we performed computed tomography (CT) imaging in two normal and 15 different pathological cases, and the 3D models were correlated to the cross-sectional CT slices. Reconstructed CT datasets were acquired by multi-slice CT. Post-processing was performed using the in-house software 3D Slicer, applying thresholding and manual segmentation. 3D models of the individual anatomical structures were generated and displayed in different colours. The display of relevant anatomical and pathological structures was evaluated in the greyscale 2D slices, 3D images, and the 2D slices showing the segmented 2D anatomy in different colours for each structure. Correlating 2D slices to the 3D models and virtual endoscopy helps to combine the advantages of each method. As generating 3D models can be extremely time-consuming, this approach can be a clinically applicable way of gaining a 3D understanding of the patient's anatomy by using models as a reference. Furthermore, it can help radiologists and otolaryngologists evaluating the 2D slices by adding the correct 3D information that would otherwise have to be mentally integrated. The method can be applied to radiological diagnosis, surgical planning, and especially, to teaching. |
2001
Serial Intraoperative Magnetic Resonance Imaging of Brain Shift
|
Publication: Neurosurgery. 2001 Apr;48(4):787-97. PMID: 11322439 | PDF Authors: Nabavi A, Black PM, Gering DT, Westin C-F, Mehta V, Pergolizzi RS Jr, Ferrant M, Warfield SK, Hata N, Schwartz RB, Wells WM III, Kikinis R, Jolesz FA. Institution: Division of Neurosurgery, Brigham and Women's Hospital, Harvard Medical School, Boston, MA, USA. Background/Purpose: A major shortcoming of image-guided navigational systems is the use of preoperatively acquired image data, which does not account for intraoperative changes in brain morphology. The occurrence of these surgically induced volumetric deformations ("brain shift") has been well established. Maximal measurements for surface and midline shifts have been reported. There has been no detailed analysis, however, of the changes that occur during surgery. The use of intraoperative magnetic resonance imaging provides a unique opportunity to obtain serial image data and characterize the time course of brain deformations during surgery. The vertically open intraoperative magnetic resonance imaging system (SignaSP, 0.5 T; GE Medical Systems, Milwaukee, WI) permits access to the surgical field and allows multiple intraoperative image updates without the need to move the patient. We developed volumetric display software, the 3D Slicer, that allows quantitative analysis of the degree and direction of brain shift. For 25 patients, four or more intraoperative volumetric image acquisitions were extensively evaluated. Serial acquisitions allow comprehensive sequential descriptions of the direction and magnitude of intraoperative deformations. Brain shift occurs at various surgical stages and in different regions. Surface shift occurs throughout surgery and is mainly attributable to gravity. Subsurface shift occurs during resection and involves collapse of the resection cavity and intraparenchymal changes that are difficult to model. Brain shift is a continuous dynamic process that evolves differently in distinct brain regions. Therefore, only serial imaging or continuous data acquisition can provide consistently accurate image guidance. Furthermore, only serial intraoperative magnetic resonance imaging provides an accurate basis for the computational analysis of brain deformations, which might lead to an understanding and eventual simulation of brain shift for intraoperative guidance. Funding:
|
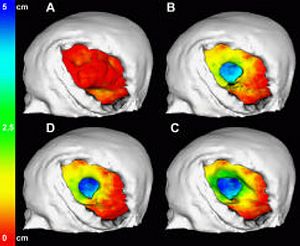 Color-coded models for the evaluation of successive surface deformations. The brain surfaces were extracted from the 3D volume SPGRs for all time points. The surface displacement from stage to stage was automatically calculated and color-coded. The color encodes depths from red (0 mm) to green (2.5 cm) to blue (5 cm). The color-coding was projected onto the model of the brain at that respective stage of the surgery. |
2000
Image-guided Therapy and Intraoperative MRI in Neurosurgery
|
Publication: Minim Invasive Ther Allied Technol. 2000;9(3-4):277-86. PMID: 20156025 Authors: Nabavi A, Mamisch CT, Gering DT, Kacher DF, Pergolizzi RS, Wells WM 3rd, Kikinis R, Black PM, Jolesz FA. Institution: Department of Radiology, Brigham and Women's Hospital, Harvard Medical School, Boston, MA, USA. Background/Purpose: Computer-assisted 3D planning, navigation and the possibilities offered by intra-operative imaging updates have made a large impact on neurological surgery. Three-dimensional rendering of complex medical image information, as well as co-registration of multimodal sources has reached a highly sophisticated level. When introduced into surgical navigation however, this pre-operative data is unable to account for intra-operative changes, ('brain-shift'). To update structural information during surgery, an open-configured, intra-operative MRI (Signa SP, 0.5 T) was realised at our institution in 1995. The design, advantages, limitations and current applications of this system are discussed, with emphasis on the integration of imaging into procedures. We also introduce our integrated platform for intra-operative visualisation and navigation, the 3D Slicer. Funding:
|
