Modules:VMTK in 3D Slicer Tutorial: Coronary Artery Centerline Extraction
Return to Slicer 3.5 Documentation
Contents
Authors, Collaborators & Contact
- Author: Daniel Haehn, University of Heidelberg
- Acknowledgments: Luca Antiga, Mario Negri Institute; Steve Pieper, Isomics Inc.
- Contact: Daniel Haehn, haehn@bwh.harvard.edu
Background
| Coronary heart disease (CHD) is the leading cause of death in high-income countries and one of the main causes of death worldwide [WHO2008]. The primary cause for CHD is atherosclerosis of the coronary arteries and is called coronary artery disease (CAD). Plaque within the walls of the coronaries narrows the lumen of the affected vessels (so-called stenosis) and disturbs the regularization abilities of the vessel walls. Consequently this reduces the blood flow inside the affected vessels and constrains the supply of oxygen and nutrients to the myocardium. Beside of heart pain, symptoms of the CHD can appear as heart-rhythm-disturbances, cardiac insufficiency, angina-pectoris-attacks, heart attacks or sudden cardiac deaths [HJ07, pp307].
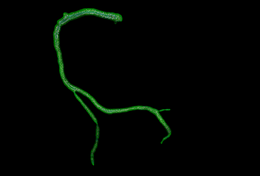
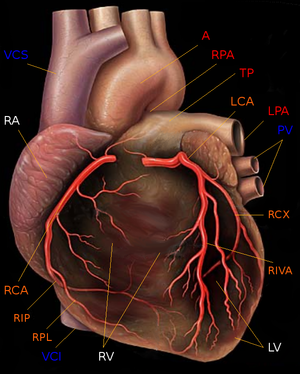
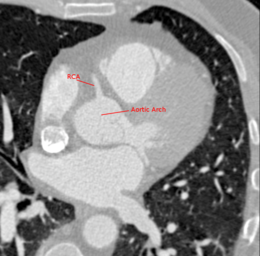
Medical imaging is used for the diagnosis of CAD and for the quantification and grading of stenosis. The extraction of the central lumen line (centerline) of coronary arteries is helpful for visualization purposes, stenosis quantification or further processing steps (e.g. reformatting) [Schaap2009]. This tutorial shows how to use tools based on the Vascular Modeling Toolkit (VMTK) ([Antiga2008]) in 3D Slicer to segment the right coronary artery (A. coronaria dextra, RCA) in a computed tomography angiography (CTA) volume and extract the associated centerline. In particular the segmentation is performed on a CTA dataset which was obtained through the Rotterdam Coronary Artery Algorithm Evaluation Framework ([Schaap2009]). Even if this documentation shows how to establish a work flow between three VMTK in 3D Slicer tools, each of the three documented segmentation steps can be considered as a guide for the individual module.
|
VMTK in 3D Slicer Installation
Before using VMTK in 3D Slicer a set of modules has to be installed. Since the 3D Slicer version 3.5 the modules are available as extensions and can be downloaded into an existing Slicer installation by using the extension wizard.| The 3D Slicer extension build system provides VMTK in 3D Slicer packages for different OS platforms. At the moment Linux 64bit and Darwin are supported.
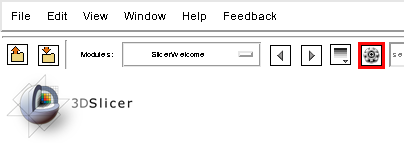
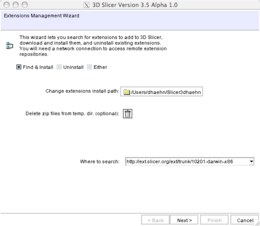
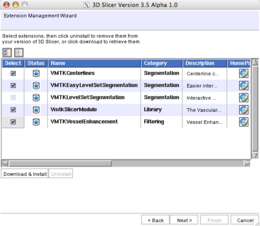
Using the extension wizard, the VMTK in 3D Slicer modules can be installed following three steps.
| ||
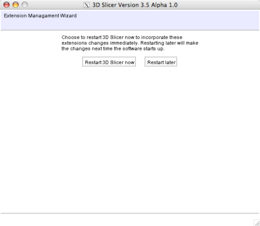
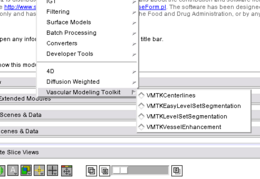
| After restarting 3D Slicer, the VMTK tools are available in the module selector inside the category Vascular Modeling Toolkit. | ||
If the extension wizard does not work for you or if you want to use VMTK in 3D Slicer on unsupported OS platforms, you should give the manual installation a shot.
Segmentation
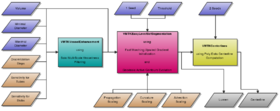
The centerline extraction using VMTK in 3D Slicer consists of a processing sequence using three different modules.
Due to time-consuming calculations, it is highly recommended to extract a subvolume of the region of interest prior to the segmentation process. This can be done by using Converters -> Extract Subvolume or Converters -> Extract Subvolume ROI in the 3D Slicer module selector.
Generating Vesselness using VMTKVesselEnhancement
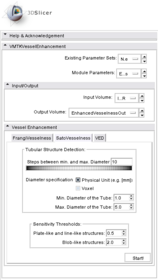
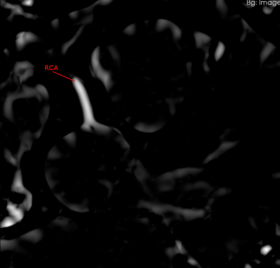
| The VMTKVesselEnhancement module provides multiscale vesselness filters in 3D Slicer. These filters detect tubular or blob-like structures of various sizes according to a defined scale. We want to use the method of Sato et al. ([Sato1998]) to enhance the right coronary artery in our extracted subvolume.
INSTRUCTIONS:
The vesselness filtering takes some time. Our extracted subvolume gets processed in about 10 minutes on a Quad Core 2.6GHz Xeon machine with 6GB of RAM. |
HINTS:
- VMTKVesselEnhancement is already configured to detect tubular rather than blob-like structures. This can be modified by setting different sensitivity thresholds. The lower the threshold, the more likely is that the desired structure gets highlighted.
- Parameter presets for certain use-cases exist and can be selected using the Existing Parameter Sets: node selector. They can be extended by editing the presets.xml MRML file inside the module directory.
Lumen Segmentation using VMTKEasyLevelSetSegmentation
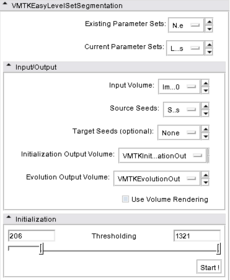
| Segmentation of the vessel lumen can be performed using the VMTKEasyLevelSetSegmentation module. The level-set segmentation process consists of two steps: Fast Marching Upwind Gradient initialization ([Antiga2008], [Sethian1999]) and Geodesic Active Contours evolution ([Caselles1995]).
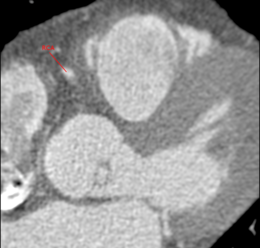
The initialization step involves the description of a starting model within a region of interest. In the evolution step this initial deformable model then gets inflated to match the contours of the targeted volume. We want to initialize inside the RCA on the vessel enhanced volume from the previous step and then evolve on the original extracted subvolume. INSTRUCTIONS: Initialization:
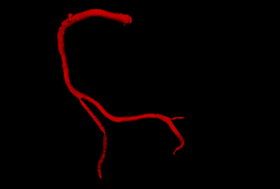
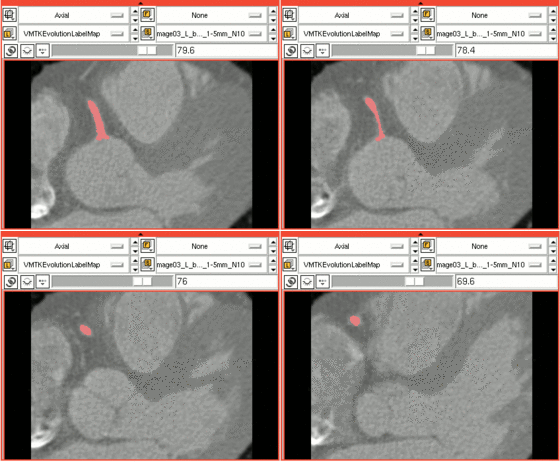
The initial segmentation is shown as an overlayed labelmap in the 3D Slicer slice viewers and a red model is shown in the 3D rendering window. Evolution:
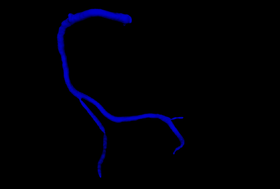
The evolved segmentation is shown as an overlayed labelmap in the 3D Slicer slice viewers and a blue model is shown in the 3D rendering window. |
|||
|
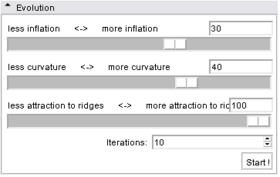
For the segmentation of the RCA we use the following parameters:
Attraction to ridges is the most important parameter. Since our initialization is already pretty good, we only choose medium inflation and medium curvature. The Fast Marching initialization takes some time. Our extracted subvolume gets processed in about 6 minutes on a Quad Core 2.6GHz Xeon machine with 6GB of RAM.
| |||
Centerline Computation using VMTKCenterlines
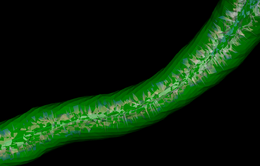
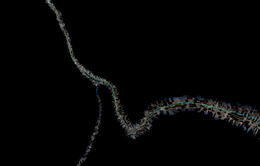
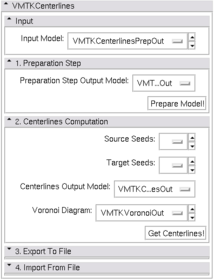
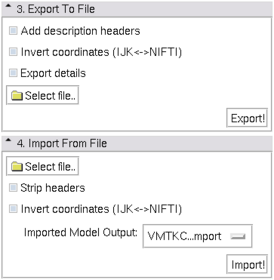
| Centerlines of polydata models can be computed using the VMTKCenterlines module. Beside the actual centerline it also outputs the Voronoi diagram which describes the maximal sphere radius of every point on the centerline. The module also provides import and export functionality for centerlines defined by a cloud of points.
Preparation Step:
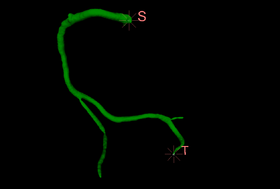
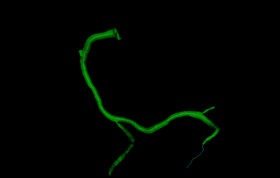
This step closes the input model with caps and changes the color to green. Centerlines Computation:
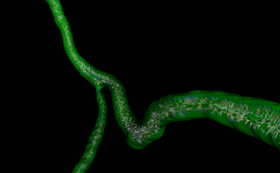
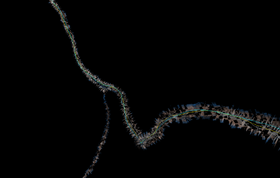
After computation, the centerlines and Voronoi diagram are added as 3D polydata models to the current scene and get displayed in the 3D rendering window. Import/Export: Computed centerlines can be imported and exported as clouds of points.
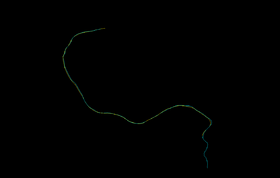
We imported the reference centerline for the RCA (expert segmentation, provided by [Schaap2009]) and added it to the 3D Slicer scene.
|
|
Evaluation
|
|
To evaluate our segmentation of the RCA, we compare our results to an expert segmentation and use the metrics proposed in the Rotterdam Coronary Artery Algorithm Evaluation Framework to quantify them.
Our segmentation overlaps more than 91% of the expert segmentation.
Before the first segmentation error occurs, our segmentation overlaps more than 83%.
Concerning the clinical relevant part of the vessel, our segmentation overlaps more than 91%. The clinical relevant part of the vessel is defined as parts where the vessel diameter is >= 1.5mm or parts which are laying distal than these ([Schaap2009]).
Accuracy AI: 0.307439, score: 44.9975 The average distance between our centerline and the expert segmentation is about 0.3 mm. |
References
| [Antiga2008] | Antiga, L.; Piccinelli, M.; Botti, L.; Ene-Iordache, B.; Remuzzi, A. & Steinman, D. A. An image-based modeling framework for patient-specific computational hemodynamics. Med Biol Eng Comput, Biomedical Engineering Department, Mario Negri Institute for Pharmacological Research, Villa Camozzi, Ranica, BG, Italy. 2008, 46, 1097-1112 | |
| [Caselles1995] | Caselles, V.; Kimmel, R. & Sapiro, G. Geodesic active contours. Proc. Fifth International Conference on Computer Vision, 1995, 694-699 | |
| [HJ07] | Huch, R. & Jürgens, K. D. Mensch, Körper, Krankheit. Urban & Fischer Verlag, 2007 | |
| [Sato1998] | Sato, Y.; Nakajima, S.; Shiraga, N.; Atsumi, H.; Yoshida, S.; Koller, T.; Gerig, G. & Kikinis, R. Three-dimensional multi-scale line filter for segmentation and visualization of curvilinear structures in medical images. Department of Radiology, Harvard Medical School and Brigham and Women's Hospital, Boston, MA 02115, USA. Med Image Anal, 1998, 6 | |
| [Schaap2009] | Schaap, M.; Metz, C.; van Walsum, T.; van der Giessen, A.; Weustink, A.; Mollet, N.; Bauer, C.; Bogunović, H.; Castro, C.; Deng, X.; Dikici, E.; O'Donnell, T.; Frenay, M.; Friman, O.; Hoyos, M. H.; Kitslaar, P.; Krissian, K.; Kühnel, C.; Luengo-Oroz, M. A.; Orkisz, M.; Smedby, Ö.; Styner, M.; Szymczak, A.; Tek, H.; Wang, C.; Warfield, S. K.; Zambal, S.; Zhang, Y.; Krestin, G. P. & Niessen, W. Standardized Evaluation Methodology and Reference Database for Evaluating Coronary Artery Centerline Extraction Algorithms. Medical Image Analysis, 2009, 13/5, 701-714 | |
| [Sethian1999] | Sethian, J. A. Level Set Methods and Fast Marching Methods: Evolving Interfaces in Computational Geometry, Fluid Mechanics, Computer Vision, and Materials Science (Cambridge ... on Applied and Computational Mathematics) Cambridge University Press, 1999 | |
| [WHO08] | World Health Organization WHO. The top ten causes of death. Fact sheet N310, 10 2008. |
