Home < Documentation < Nightly < Modules < SegmentCAD
Introduction and Acknowledgements
|
Extension: OpenCAD
This work is supported by NA-MIC, NCIGT, and the Slicer Community.
Author: Vivek Narayan, Jayender Jagadeesan
Contact: Jayender Jagadeesan <email> jayender@bwh.harvard.edu</email>
|
|
This project is supported by P41 RR019703/RR/NCRR NIH HHS/United States, P01 CA067165/CA/NCI NIH HHS/United States and P41 EB015898/EB/NIBIB NIH HHS/United States
|
Module Description
The SegmentCAD module is designed to segment tumors from DCE-MRI datasets which include pre-contrast image and post-contrast images at different time points. SegmentCAD uses blackbox methods to calculate the wash-in and wash-out slopes from the time-intensity curves. The segmentation output is a Label Map with red, yellow, and blue colors respectively identifying washout (Type III), plateau (Type II), and persistent (Type I) voxels.
Methods
- Only Voxels with a percent increase from pre-contrast to the first post-contrast time point greater than the Minimum Threshold of Increase (default = 75.00%) are considered for segmentation and classification.
- Slope of delayed curve for each voxel is calculated as (Intensity at 4th time point - Intensity at 1st time point) / (Intensity at 1st time point).
- Segmented voxels are individually classified by color according to slope of delayed curve:
- Blue for Persistent curve
- Slope of delayed curve > 0.2 (default) (Type I)
- Yellow for Plateau curve
- -0.2 < Slope of delayed curve < 0.2 (Type II)
- Red for Washout curve
- Slope of delayed curve < -0.2 (default) (Type III)
|
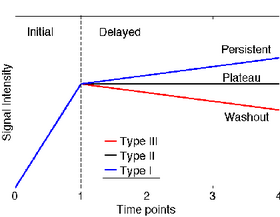 Classification based on Delayed Curve |
Features
- Segmentation - Generate Label Map delineating the regions of enhanced perfusion corresponding to the tumor with color representing the Type of Curve.
- Interactive Charting - Calculates and displays the percent increase from baseline(pre-contrast intensity) of the voxel under the current mouse pointer location, at each time point. On the X-axis, 0.0 is Pre-contrast, 1.0 is First Post-contrast, ..., 4.0 is the Final Post-contrast time point. The Y-axis represents percentage change from baseline/pre-contrast intensity.
- Volume Rendering - A 3D Volume Rendering of the output Label Map is displayed in the 3D viewer after segmentation.
- Label Statistics - Tabular display of statistics of all First Post-contrast time point voxels highlighted in the output Label Map and grouped according to curve type (Type I, II, and III). These statistics include: Voxel Count, Volume mm^3, Volume cc, Minimum Intensity, Maximum Intensity, Mean Intensity, Standard Deviation.
Tutorials
SegmentCAD Tutorial (pptx)
Data sets
Breast DCE-MRI Data Set 1 (zip file containing the nrrd volumes for the SegmentCAD tutorial)
Breast DCE-MRI Data Set 2 (zip file containing additional test set of nrrd volumes)
Panels and their use
|
The GUI of the SegmentCAD module contains 5 sections:
- Select DCE-MRI Volumes for Segmentation
- Pre-contrast Volume: Select the Pre-contrast Image
- First Post-contrast Volume: Select the Post-contrast Image at the First time point
- Second Post-contrast Volume: Select the Post-contrast Image at the Second time point. This will only be used for the Interactive Charting feature.
- Third Post-contrast Volume: Select the Post-contrast Image at the Third time point. This will only be used for the Interactive Charting feature.
- Fourth Post-contrast Volume: Select the Post-contrast Image at the Fourth or Final time point.
- Use Label Map as ROI: Enable this to select a custom label map input to restrict the segmentation analysis to a specific ROI.
- Select or Create Output SegmentCAD Label Map
- Output SegmentCAD Label Map: Create or select a label map volume node to represent the output of the segmentation.
- Legend | |: A reference for what type of curves are represented by the colors of the label map.
- Display Volume Rendering: Enable this to display a 3D Volume Rendering of the Label Map output in the 3D viewer after segmentation.
- Calculate SegmentCAD Label statistics: Enable this to calculate and display statistics of all the First Post-contrast time point voxels highlighted in the output Label Map.
- Set Advanced Segmentation Parameters
- Minimum Threshold of Increase: The minimum percentage increase from pre-contrast to the first post-contrast time point for a voxel to be included in the segmentation output and classified (default set at 75%).
- Type I (Persistent) Curve Minimum Slope: The minimum slope of the delayed curve for a voxel to be classified as having a Type I Persistent Curve (default set at 0.2).
- Type 3 (Washout) Curve Maximum Slope: The maximum slope of the delayed curve for a voxel to be classified as having a Type III Washout Curve (default set at -0.2).
- Apply SegmentCAD: Perform Segmentation.
- SegmentCAD Label Statistics
- Statistics Table: Table displaying statistics of all First Post-contrast time point voxels highlighted by the Label Map and grouped according to curve type (Type I, II, and III).
- Chart Statistics: Generates bar graph comparing all labels in the label map based on the statistical criterion specified in the menu.
- Menu Items: Volume, Curve Type, Voxel Count, Volume mm^3, Volume cc, Minimum Intensity, Maximum Intensity, Mean Intensity, Standard Deviation
- Ignore Zero label: Ignore the unsegmented region of the First Post-contrast image when displaying bar graph.
- Interactive Charting Settings
- Enable/Disable Interactive Charting: Toggle the calculation and display of the percent increase from baseline(pre-contrast intensity) of the voxel under the current mouse pointer location, at each time point. On the X-axis, 0.0 is Pre-contrast, 1.0 is First Post-contrast, ..., 4.0 is the Final Post-contrast. Y-axis represents percentage change from baseline intensity.
|
|
Quick Instructions for Use
- Select the pre-contrast volume
- Select the first post-contrast volume
- Select the second post-contrast volume
- Select the third post-contrast volume
- Select the fourth post-contrast volume
- Uncheck 'Use Label Map as ROI'
- Create or select a label map volume node to represent the output of the segmentation
- Click "Apply SegmentCAD"
Module Output
Similar Modules
N/A
References
N/A
Information for Developers
Source code: https://github.com/vnarayan13/Slicer-OpenCAD


