Documentation/Nightly/Modules/PETLiverUptakeMeasurement
|
For the latest Slicer documentation, visit the read-the-docs. |
Introduction and Acknowledgements
|
Acknowledgments:
The UIowa QIN PET Liver Uptake Measurement tool was funded in part by Quantitative Imaging to Assess Response in Cancer Therapy Trials NIH grant U01-CA140206 and Quantitative Image Informatics for Cancer Research (QIICR) NIH grant U24 CA180918. License: Slicer License | |||||||
|
Module Description
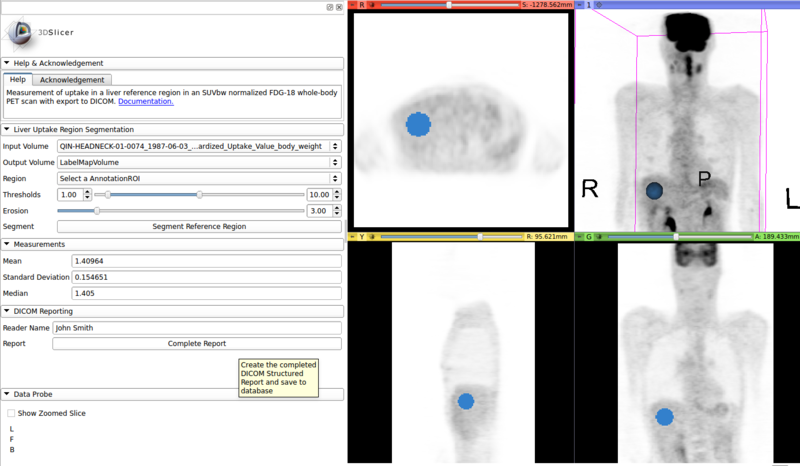
Tool for automated measurement of liver uptake in SUV normalized whole-body FDG-18 PET scans and export to DICOM. The tool automatically identifies a spherical region inside of the liver and measures mean, standard deviation and median uptake in the identified region. The segmented region and measurement results can be exported as DICOM Segmentation (SEG) and Structured Report (SR), respectively. In the majority of cases the user only needs to specify the input PET scan. However, to be able to deal with unusual cases where standard parameters regarding the liver's location or appearance are not applicable, the tool allows the user to provide additional guidance to the algorithm.
Basic usage
- Load SUV normalized whole-body FDG-18 PET scan from Slicer's DICOM database. This can be accomplished using the DICOM PET SUV Plugin which is part of the UIowa QIN PET DICOM Extension.
- Go to the “PET Liver Uptake Measurement Quantitative Reporting” module.
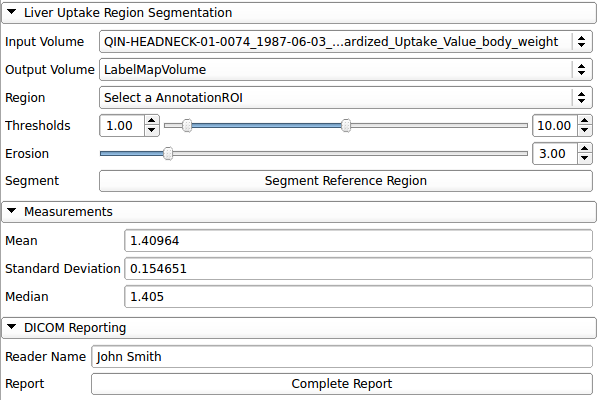
- Select the loaded PET scan as "Input Volume".
- Under "Output Volume" select "Create new LabelMapVolume".
- Click "Segment Reference Region".
- Verify correctness of the identified region for liver uptake measurement. If needed, use one of the options described below.
- In section "Measurements" read the measured "Mean", "Standard Deviation" and "Median" SUV values of the identified liver reference region.
- In section "DICOM Reporting" click "Complete Report" to export the segmented region and measurements to Slicer's DICOM database.
Options
In unusual circumstances the tool may not be able to automatically identify a correct measurement region in the liver. E.g. the tool was developed for whole-body FDG-18 PET scans and assumes that part of the brain is visible as a reference point for localization of the liver. In such cases, the user may provide additional information to the algorithm:
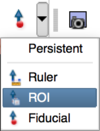
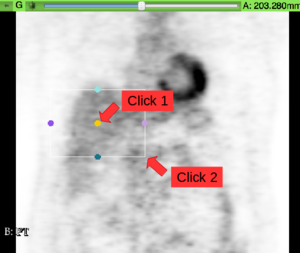
- Region: A ROI box may be provided to indicate the rough location of the liver. The tool will only search for a measurement region with its center inside of the provided ROI. Usage: (a) Select ROI from the annotation toolbar. (b) Place ROI around the liver by first clicking at the ROI’s center and then at a corner point. (c) From the “Region” drop-down list select the created ROI “R”.
- Upper and lower thresholds: These thresholds indicate the rough expected SUV range for the liver tissue, separating it from non-liver tissue.
- Erosion distance: Distance between the measurement region and the identified liver’s boundary. This allows excluding voxels from the measurement region which are affected by partial volume effects.
References
- C. Bauer, S. Sun, W. Sun, J. Otis, A. Wallace, B. J. Smith, J. J. Sunderland, M. M. Graham, J. M. Buatti and R. R. Beichel: "Automated measurement of uptake in cerebellum, liver, and aortic arch in full-body FDG PET/CT scans", in Medical Physics, 2012. http://dx.doi.org/10.1118/1.4711815


