Documentation/Nightly/Modules/MRI SNR Measurement
|
For the latest Slicer documentation, visit the read-the-docs. |
Introduction and Acknowledgements
|
This work is supported by NA-MIC, NCIGT, and the Slicer Community. This work is partially supported by NIH 1R01CA111288-01A1 "Enabling Technologies for MRI-Guided Prostate Interventions" (PI: Clare Tempany), P01-CA67165 "Image Guided Therapy" (PI: Ferenc Joelsz) and AIST Intelligent Surgical Instrument Project (PI: Makoto Hashizume, Site-PI: Nobuhiko Hata). | |||||
|
Module Description
3D Slicer CLI to calculate signal-to-nose ratio of MR images using "difference image" method.
Introduction to SNR Measurement
There are several methods to determine the SNR of MR images suggested in the NEMA standard and the literature. The most commonly used method among the studies on MRI-compatible robotics is a single image method, where SNR is measured based on two regions of interest (ROIs) on a single image assuming the statistically and spatially uniform distribution of noise [Kaufman-1989, Henkelman-1985, NEMA-2008]. Usually, one ROI is defined in the tissue of interest, and the other is in the image background i.e. air. Although the method takes a practical approach requiring only a single image, it is know that the method does not yield accurate SNR measurement in a phased-array surface coil system and/or sum-of-square reconstruction due to the spatial and statistical variation of noise. Alternatively, one can measure SNR without assuming the statistically and spatially uniform distribution of noise with the following methods. The first method is to measure pixel-by-pixel SNR through the repeated acquisition [Reeder-2005, Kellman-2005, Constantinides-2004, Dietrich-2007]. Because the method relies less on the assumption of statistical and spatial noise distribution than any other methods, it is often used as the gold standard SNR measurement. A drawback of this method, however, is that it requires a large number of image acquisitions, typically a few hundreds, making it difficult to be used with a slow imaging sequence. The second method is the "noise only image" method [NEMA-2008, Constantinides-1997, Kellman-2005]. The method calculates SNR based on a single or multiple "noise only images", which are acquired without radiofrequency (RF) excitation. The "noise only image" method was further generalized by Kellman and McVeigh, where images are reconstructed in "SNR units" based on noise only images allowing direct pixel-by-pixel SNR measurement [Kellman-2005]. A disadvantage of the "noise only image" method is that most of clinical MRI system does not allow acquiring noise only images with standard pulse sequence. The third method is the "difference image" method, where noise is estimated by calculating pixel-by-pixel difference between two images acquired under exactly the same conditions [NEMA-2008, Murphy-1993, Firbank-1999]. Despite several drawbacks e.g. requirement for stationary tissue and limited precision due to small sample size, the method allows measuring local SNR with standard clinical sequence. The SNRMeasurement module calculates the SNR of MR images using the "difference image" method.
- [Kaufman-1989] Kaufman L, Kramer DM, Crooks LE, Ortendahl DA. Measuring signal-to-noise ratios in MR imaging. Radiology 1989;173:265-267.
- [Henkelman-1985] Henkelman RM. Measurement of signal intensities in the presence of noise in MR images. Med Phys 1985;12:232-233.
- [NEMA-2008] National Electrical Manufacturers Association (NEMA). Determination of signal-to-noise ratio (SNR) in diagnostic magnetic resonance imaging. NEMA Standards Publication MS 1-2008. National Electrical Manufacturers Association; 2008.
- [Reeder-2005] Reeder SB, Wintersperger BJ, Dietrich O, et al. Practical ap- proaches to the evaluation of signal-to-noise ratio performance with parallel imaging: application with cardiac imaging and a 32- channel cardiac coil. Magn Reson Med 2005;54:748-754.
- [Kellman-2005] Kellman P, McVeigh ER. Image reconstruction in SNR units: a general method for SNR measurement. Magn Reson Med 2005;54: 1439-1447.
- [Constantinides-2004] Constantinides CD, Atalar E, McVeigh ER. Signal-to-noise mea- surements in magnitude images from NMR phased arrays. Magn Reson Med 1997;38:852-857 (Erratum in: Magn Reson Med 2004; 52:219).
- [Dietrich-2007] Dietrich O, Raya JG, Reeder SB, Reiser MF, Schoenberg SO. Measurement of signal-to-noise ratios in MR images: influence of multichannel coils, parallel imaging, and reconstruction filters. J Magn Reson Imaging. 2007 Aug;26(2):375-85.
- [Murphy-1993] Murphy BW, Carson PL, Ellis JH, Zhang YT, Hyde RJ, Chenevert TL. Signal-to-noise measures for magnetic resonance imagers. Magn Reson Imaging 1993;11:425-428.
- [Firbank-1999] Firbank MJ, Coulthard A, Harrison RM, Williams ED. A comparison of two methods for measuring the signal to noise ratio on MR images. Phys Med Biol 1999;44:N261-N264.
- [Constantinides-1997] Constantinides CD, Atalar E, McVeigh ER. Signal-to-noise measure- ments in magnitude images from NMR phased arrays. [Published erra- tum in: Magn Reson Med. 2004 Jul;52:219]. Magn Reson Med 1997;38: 852-857.
Tutorials
The SNR module is created to compute the SNR for MR sequences based on the difference image method. In this method, two MR images are acquired under identical conditions. These images are then added and subtracted from each other pixel by pixel. In the resulting images, a region of interest is defined and the mean and standard deviation of the ROI is computed. SNR is computed as:[math]Insert formula here[/math]
- Procedure:
- Using Slicer, load the two MR images which SNR is measured for.
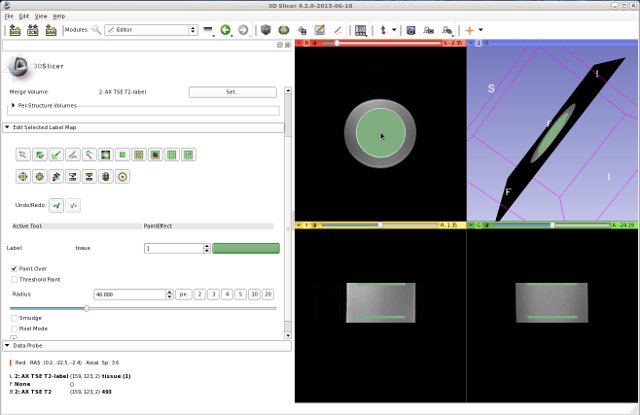
- Define an ROI using the Editor tool. The ROI should have two labels, for example two circles with the radius of 40 mm, on two axial slices. They should be separated properly from each other. It does not matter which of the two MR images is used to define the ROI.
- Open the SNRMeasurement module.:
- Select the Input Volume 1 as one of the MR image, and Input Volume 2 as the other MR image
- Select the Label Map as the ROI which was defined above. Usually it is named “MR image Name”-label.
- Click Apply
Panels and their use
N/A
Similar Modules
N/A
References
N/A
Information for Developers
| Section under construction. |


