Documentation/Nightly/Modules/AstroModeling
|
For the latest Slicer documentation, visit the read-the-docs. |
Introduction and Acknowledgements
|
Authors: Acknowledgements:
|
Module Description
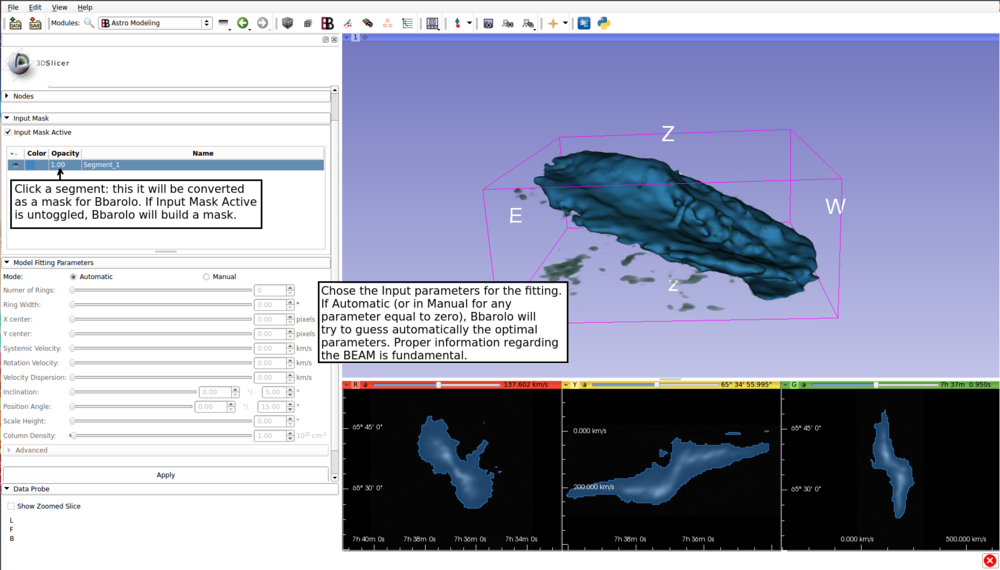
The Modeling module is a C++ SlicerAstro wrapping of 3DBAROLO [1],
a 3D algorithm to derive rotation curves of galaxies, developed by Enrico di Teodoro (Australian National University).
In addition, SlicerAstro provides an easy and interactive interface for comparing the automated-generated models with the data.
It is also possible to edit the value of each parameter for each ring of the tilted-ring model for refining the analysis of the kinematics of the galaxy in study.
Panels and their use
Select the Inputs:
Modify and visualize the model:

Illustration of the HI data and model, fitted by 3DBAROLO, of NGC2403 from the THINGS survey. The galaxy is very well resolved. The top-left view is a 3D view of NGC2403. The white labels represent the four cardinal directions (N, S, E, W). The yellow segmentation (in the 3D view) represents the model that fits the regular disk. The model has been fitted in automatic mode (i.e., no mask and no input parameters have been provided to 3DBAROLO from the graphical user interface). The green rendering of the data, from an intensity level of 3 times the rms, clearly shows unsettled gas in the inner region. The top-right view has plotting capabilities and the different parameters of the rings of the output model can be shown and edited. The bottom views are slices of the data-cube: bottom-left, XY; bottom-middle, PV-Major; bottom-right, PV-Minor. The green and the blue segmentations (in the 2-D views) are contours of the data and model, respectively, at the rms value chosen in the Contour level widget.
References
@ARTICLE{2017A&C....19...45P,
   author = {{Punzo}, D. and {van der Hulst}, J.~M. and {Roerdink}, J.~B.~T.~M. and
	{Fillion-Robin}, J.~C. and {Yu}, L.},
    title = "{SlicerAstro: A 3-D interactive visual analytics tool for HI data}",
  journal = {Astronomy and Computing},
archivePrefix = "arXiv",
   eprint = {1703.06651},
 primaryClass = "astro-ph.IM",
 keywords = {Radio lines: galaxies, Scientific visualization, Visual analytics, Agile software development, Object oriented development, Empirical software validation},
     year = 2017,
    month = apr,
   volume = 19,
    pages = {45-59},
      doi = {10.1016/j.ascom.2017.03.004},
}
@ARTICLE{2015MNRAS.451.3021D,
   author = {{Di Teodoro}, E.~M. and {Fraternali}, F.},
    title = "{$^{3D}$ BAROLO: a new 3D algorithm to derive rotation curves of galaxies}",
  journal = {\mnras},
archivePrefix = "arXiv",
   eprint = {1505.07834},
 keywords = {methods: data analysis, galaxies: kinematics and dynamics},
     year = 2015,
    month = aug,
   volume = 451,
    pages = {3021-3033},
      doi = {10.1093/mnras/stv1213},
}

