Documentation/4.4/Modules/dPetBrainQuantification
|
For the latest Slicer documentation, visit the read-the-docs. |
Introduction and Acknowledgements
|
It is possible to segment relevant blood pools, derive pTAC curves with methods based on Chen [1], and perform voxel or region based Patlak analysis [2] Author: Martín Bertran and Natalia Martínez (Facultad de Ingeniería, Udelar, Uruguay) |
Module description
This module provides a tool for processing dynamic PET brain scans with FDG tracer into Patlak-Gedde [2] parametric K-Maps. It attempts to minimize the required user input, as well as additional information other than the dPET scan.
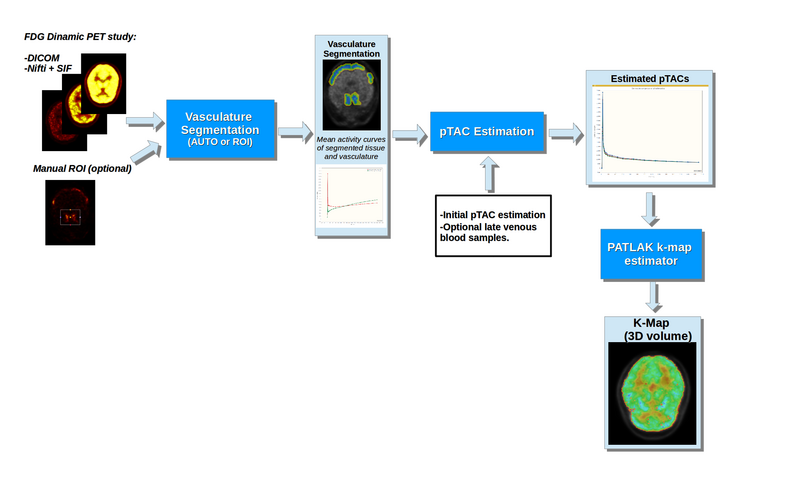
Processing is divided into 3 blocks:
- Vascular segmentation: Allows the segmentation of vasculature and adjacent tissue from the dPET scan (Necessary for implemented IDIF pTAC extraction methods). Segmentation can either be done automatically or through a user defined ROI.
- pTAC estimation: Estimates pTAC from the dPET scan by attempting to correct for Partial Volume Effects. Estimation can be done without additional information, but the module allows the incorporation of additional late blood samples. Additionally, the Hunter [3] PBIF method is also implemented.
- K-Map Estimation: The module allows the creation of a scalar volume with the parametric K-Map. Estimation can be done voxel by voxel or over user defined regions.
The most usual “end to end” workflow involves loading the dPET brain scan, and obtaining a K-map volume. However, the processing blocks can be used independently, each allowing external inputs, the relevant output variables can also be saved and stored.
Figure 1 shows a basic illustration of the processing blocks.
Illustration of the dPET processing blocks
Panel 1 : PET dynamic study and information.
This panel allows the loading of the dPET scan, and optional blood samples. Figure 2 shows a screencap of the available options in this panel.
Screencap: PET dynamic study and information panel
- Import DICOM Study:Provides an alternative one button access to the DICOM browser.
- Nifti + SIF input directory: The dPET study can also be imported from a 3D Nifti stack and a SIF frametime definition file. This encapsulates a call to the multivolume importer module.
- Input multivolume: The multivolume node to be processed must be selected from the 3D SLICER scene.
- Import acquired blood samples: Optional input that allows the loading of aquired blood samples from a CSV file. The format is as follows:
time,value,time,value,...
Time is given in seconds, value in Bq/ml.
Panel 2: Visualization options.
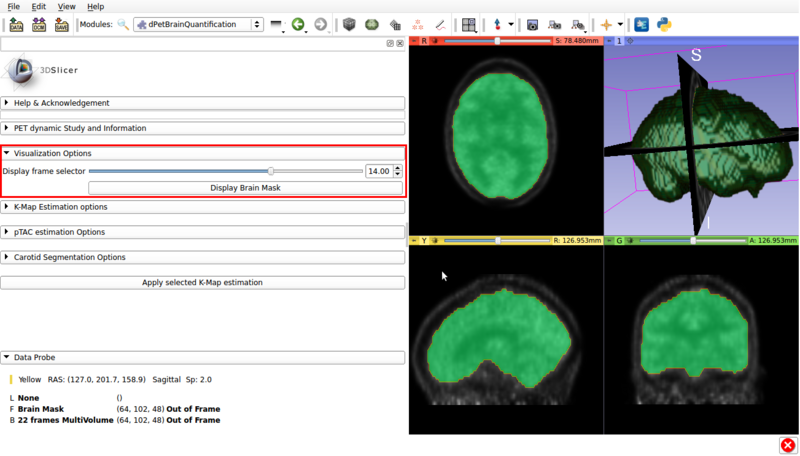
A screencap of the panel can be seen in figure 3.
This panel has the following options.
Visualization panel screencap. The segmented brain mask is displayed over the 14th frame of the imported dPET study.
- Display frame selector:Slidebar that allows to change the displayed frame from the multivolume in the background.
- Display Brain Mask: Renders the automatic Brain Mask segmentation in the foreground. This is the default region used for voxel based Patlak analysis.
Panel 3 : Carotid Segmentation Options.
This panel presents the available segmentation options. Two segmentation methods are available:
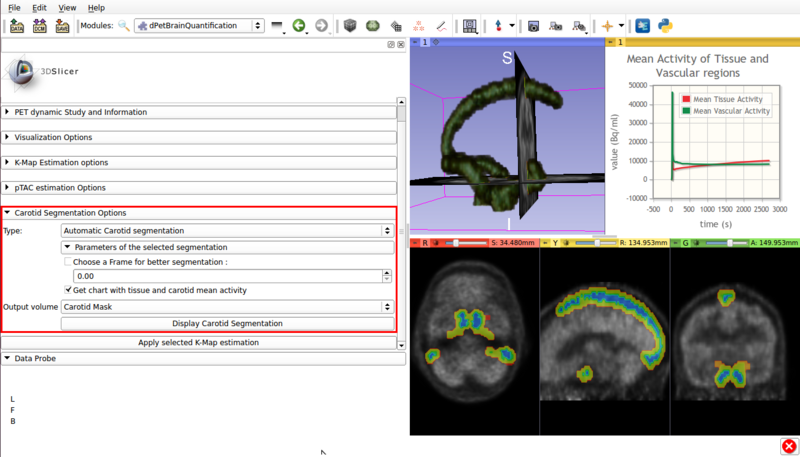
- Automatic segmentation (See figure 4).
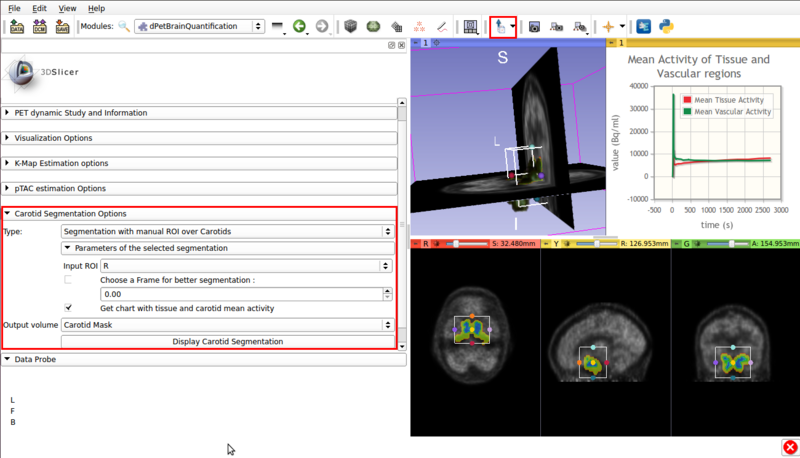
- ROI assisted segmentation(See figure 5).
Screencap of the Carotid segmentation options panel. The automatically segmented vascular regions are displayed on the viewer window.
Screencap of the Carotid segmentation options panel. The ROI assisted segmented vascular regions and the input ROI are displayed on the viewer window.
- Type :Automatic Carotid segmentation: Automatically segments vasculature within the image.
- Type :Segmentation with manual ROI over Carotids: Requires a user input ROI node over the carotid region. This node must be set as input in the Input ROI option.
If possible, the ROI should contain approximately equal ammounts of tissue and vasculature.
- Choose a frame for better segmentation: Allows the user to choose the frame that shows the best contrast between vasculature and tissue. By default this option is disabled, it is of use for certain tracers.
- Get chart with tissue and carotid mean activity: Displays in scene a chart with the mean activity curves of segmented tissue and vasculature. Both TACs remain in scene, which allows for later exporting as a mcsv file.
- Output volume: Allows saving the segmented vasculature as a scalar volume node.
- Display Carotid Segmentation Executes the segmentation algorithm with the selected options.
Panel 4:pTAC estimation Options.
This panel presents the available pTAC estimation options.
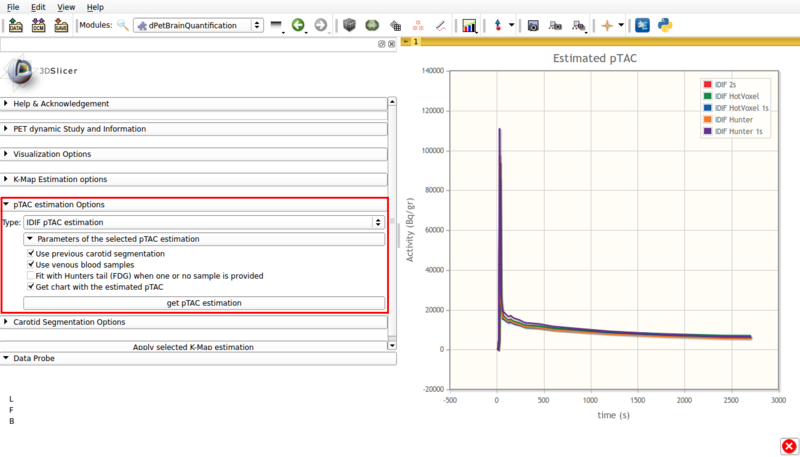
- Type: IDIF pTAC estimation.
This options estimates the plasma time activity curve (pTAC) from the segmented vasculature and adjacent tissue.
By default, the initial estimator used is the 5% hottest voxels.
Available options are shown in figure 6, and are as follows:
Screencap of pTAC estimation options using IDIF. The resulting estimators are shown in the viewer window.
- Use previous carotid segmentation:
This checkbox allows the previous carotid segmentation to be used for pTAC estimation. Else, a new segmentation will be run using the currently selected segmentation options.
- Use venous blood samples:This checkbox allows the use of imported venous samples for pTAC estimation.
- Fit with Hunter tail (FDG) when one or no sample is provided:
Allows the use of a Hunter based initial estimator for pTAC extraction.
- Get chart with estimated pTAC: Displays in scene a chart with the estimated pTAC. The pTAC remains in scene, which allows for later exporting as a mcsv file.
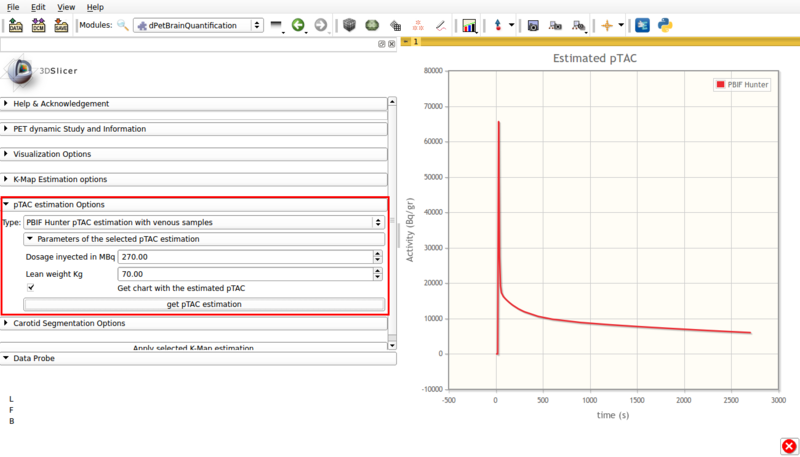
- Type: PBIF Hunter pTAC estimation with venous samples.
This estimation is based on Hunter et al [3] for FDG based on populational data. It requires at least one user input late venous sample. Figure 7 shows a screencap of the options panel.
Screencap of the PBIF pTAC estimation panel. The obtained estimation is displayed in scene.
This panel contains:
- Dosage injected in Mbq: Input injected tracer dosage in MBq.
- Lean weight Kg: Input patient's lean weigth.
- Get chart with estimated pTAC: Displays a graph in scene with the estimated pTAC. This pTAC remains in scene, which allows for later exporting as a mcsv file.
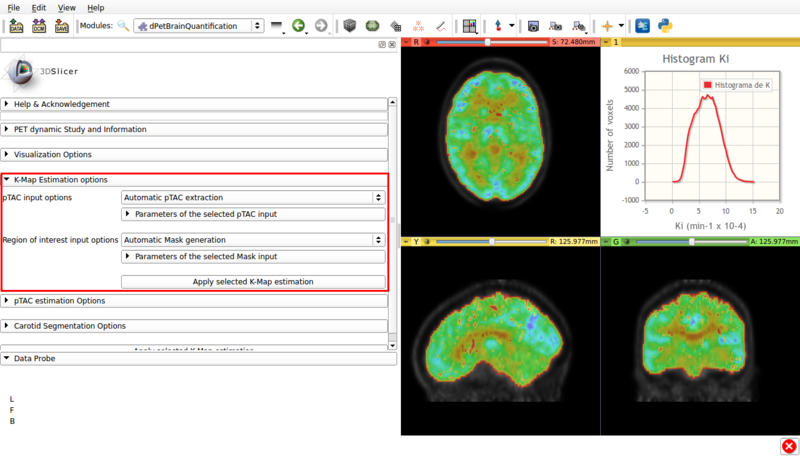
Panel 5:K-Map Estimation options.
This panel presents the available options for a Gedde-Patlak analysis. A screencap of the panel can be seen in Figure 8
Screencap of the K-Map estimation panel. The estimated K-Map volume is overlaid over the dPET scan.
- pTAC Input options: The Patlak analysis can be applied with either the last estimated pTAC or a .csv input external pTAC.
- Region of interest Input options: Allows the user to either perform a voxel based Patlak estimation over the automatically generated brain mask (Automatic Mask Generation). Or to perform region based estimation over either a user defined ROI (Input ROI) or a labelmap (Input Labelmap)
Similar Modules
N/A
References
[1]Chen K, Bandy D, Reiman E, Huang SC, Lawson M, Feng D, Yun LS, Palant A (1998) Noninvasive quantification of the cerebral metabolic rate for glucose using positron emission tomography, 18F-fluoro-2-deoxyglucose, the Patlak method, and an image-derived input function. J Cereb Blood Flow Metab 18:716–23
[2] Patlak CS, Blasberg RG, Fenstermacher JD. Graphical evaluation of blood-to-brain transfer constants from multiple-time uptake data. J Cereb Blood Flow Metab. 1983; 3: 1-7.
[3] Hunter, G. J., Hamberg, L. M., Alpert, N. M., Choi, N. C., & Fischman, A. J. (1996). Simplified measurement of deoxyglucose utilization rate. Journal of nuclear medicine: official publication, Society of Nuclear Medicine, 37(6), 950-955.
Information for Developers
| Section under construction. |
