Home < Documentation < 4.4 < Modules < PkModeling
Introduction and Acknowledgements
|
Extension: PkModeling
Acknowledgments:
This work is part of the National Alliance for Medical Image Computing (NA-MIC), funded by the National Institutes of Health through the NIH Roadmap for Medical Research, and by National Cancer Institute as part of the Quantitative Imaging Network initiative (U01CA151261) and QIICR (U24CA180918).
Implementation of the pharmacokinetics modeling was contributed by Yingxuan Zhu and Jim Miller from GE Research.
Author: Yingxuan Zhu (while at GE), Andrey Fedorov (SPL), John Evans (MGH), Jim Miller (GE)
Contact: Jim Miller, <email>millerjv@ge.com</email>
|
| National Alliance for Medical Image Computing (NA-MIC)
|
| Quantitative Image Informatics for Cancer Research
|
|
|
Module Description
|
PkModeling (Pharmacokinetics Modeling) calculates quantitative parameters from Dynamic Contrast Enhanced DCE-MRI images. This module performs two operations:
- Converts signal intensities to concentration values. The concentration values are used to calculate quantitative parameters.
- Calculates quantitative parameters from concentration values. These parameters include:
- Ktrans
- Volume transfer constant between blood plasma and EES (extracellular-extravascular space) at each voxel (min^-1)
- Ve
- Fractional volume for extracellular space at each voxel
- MaxSlope
- Maximum slope in the time series curve of each voxel
- AUC
- Area under the curve of each voxel, measured from bolus arrival time to the end time of interval, normalized by the AUC of the AIF
|
Use Cases
- estimation of quantitative perfusion parameters from DCE MRI
- treatment response evaluation
- breast, prostate, brain DCE MRI analysis
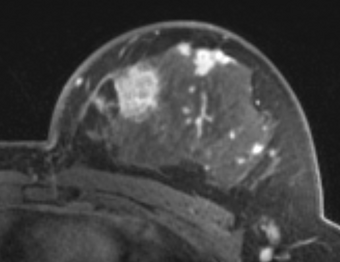 Sample frame from a breast DCE MRI dataset (one of the datasets presented in a study by Huang et al. [6] |
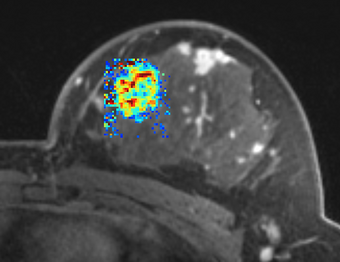 Ktrans map result of PK modeling using population AIF (Parker et al., [5]) |
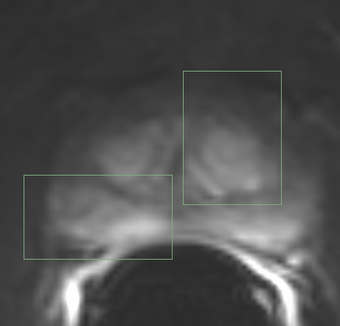 Sample frame from a prostate DCE MRI dataset (QIN-PROSTATE-002 from TCIA QIN-PROSTATE collection) |
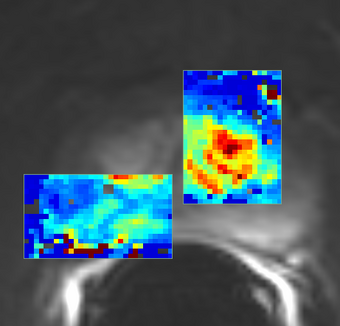 Ktrans map result of PK modeling using population AIF (Parker et al., [5]) |
Tutorials
Panels and their use
|
|
- PkModeling Parameters:
- T1 Blood Value (milliseconds)
- T1 Tissue Value (milliseconds) (default value is the published value for prostate tissue estimated in healthy individuals (see Ref. de Bazelaire et al.)
- r1 Relaxivity Value of the contrast agent, L x mol^(-1) x s^(-1). This value is contrast agent specific. Default setting of 0.0039 corresponds to Gd-DPTA (Magnevist) at 3T, see Ref. Pintaske et al. You will need to adjust this setting based on the magnet signal strength and contrast agent.
- Hematocrit Value. Volume percentage of red blood cells in blood.
- AUC Time Interval Value: Time interval for AUC calculation
- Use Population AIF: A mean AIF is calculated from a functional form instead of from the input using the aifMask or a prescribed AIF. See Ref. Parker et al.
- IO
- Input 4D Image: 4D DCE-MRI data
- AIF Mask Image: Mask designating the location of the arterial input function (AIF). AIF can either be calculated from the input using the aifMask, prescribed directly in concentration units using the prescribedAIF option, or via a population AIF.
- Prescribed AIF: Prescribed arterial input function (AIF). AIF can either be calculated from the input using the aifMask option, via a population AIF, or can be prescribed directly in concentration units using the prescribedAIF option. An example of how a prescribed AIF can be defined is in File:AIF example.mcsv.zip (unzip before importing into Slicer!). Note that the x column corresponds to timestamps in seconds, and the y column is the contrast agent concentration (NOT image signal intensity).
- Output Ktrans image: volume transfer constant between blood plasma and extravascular extracellular space (EES) (min^-1)
- Output ve image: volume of EES per unit volume of tissue
- Output fpv image: (or v_p) blood plasma volume per unit of tissue
- Output maximum slope image: maximum slope of the signal intensity curve between any two consecutive timepoints
- Output AUC image: area under the curve in the first 90 seconds
- Advanced options:
- Output R-squared goodness of fit image: each pixel will be initialized to a value between 0 and 1 characterizing the goodness of fit. Larger values correspond to a better fit (see R^2 measure description)
- Output Bolus Arrival Time Image: the bolus arrival time calculated at each pixel
|
The following acquisition parameters should be available in the NRRD header of the input data (if you are analyzing a DICOM time series, they will typically be extracted from the DICOM data):
- TR Value: Repetition time (milliseconds)
- TE Value: Echo time (milliseconds)
- FA Value: Flip angle (degrees)
- Timestamps for the dynamic series (in milliseconds)
Here is an example how this information is represented in the NRRD header:
MultiVolume.DICOM.EchoTime:=2.93
MultiVolume.DICOM.FlipAngle:=10
MultiVolume.DICOM.RepetitionTime:=6.13
MultiVolume.FrameIdentifyingDICOMTagName:=AcquisitionTime
MultiVolume.FrameIdentifyingDICOMTagUnits:=ms
Similar Modules
References
- [1] Knopp MV, Giesel FL, Marcos H et al: Dynamic contrast-enhanced magnetic resonance imaging in oncology. Top Magn Reson Imaging, 2001; 12:301-308.
- [2] Rijpkema M, Kaanders JHAM, Joosten FBM et al: Method for quantitative mapping of dynamic MRI contrast agent uptake in human tumors. J Magn Reson Imaging 2001; 14:457-463.
- [3] de Bazelaire, C.M., et al., MR imaging relaxation times of abdominal and pelvic tissues measured in vivo at 3.0 T: preliminary results. Radiology, 2004. 230(3): p. 652-9.
- [4] Pintaske J, Martirosian P, Graf H, Erb G, Lodemann K-P, Claussen CD, Schick F. Relaxivity of Gadopentetate Dimeglumine (Magnevist), Gadobutrol (Gadovist), and Gadobenate Dimeglumine (MultiHance) in human blood plasma at 0.2, 1.5, and 3 Tesla. Investigative radiology. 2006 March;41(3):213–21.
- [5] Parker GJ, Roberts C, Macdonald A, Buonaccorsi GA, Cheung S, Buckley DL, Jackson A, Watson Y, Davies K, Jayson GC. Experimentally-derived functional form for a population-averaged high-temporal-resolution arterial input function for dynamic contrast-enhanced MRI. Magnetic Resonance in Medicine, 2006 Nov; 56(5):993-1000.
- [6] Huang, W., Li, X., Chen, Y., Li, X., Chang, M.-C., Oborski, M. J., … Kalpathy-Cramer, J. (2014). Variations of dynamic contrast-enhanced magnetic resonance imaging in evaluation of breast cancer therapy response: a multicenter data analysis challenge. Translational Oncology, 7(1), 153–66. doi:10.1593/tlo.13838 http://dx.doi.org/10.1593/tlo.13838
- [7] Tofts, P. S., Brix, G., Buckley, D. L., Evelhoch, J. L., Henderson, E., Knopp, M. V, … Weisskoff, R. M. (1999). Estimating kinetic parameters from Contrast-Enhanced T 1 -Weighted MRI of a Diffusable Tracer : Standardized Quantities and Symbols. J Magn Reson Imaging, 10(3), 223–232.
Information for Developers
Source code: https://github.com/millerjv/PkModeling


