|
The Colors Module manages MRML color nodes.
Color nodes can contain discrete color look up tables or procedurally defined color transfer functions.
Color look up tables are used by mappers to translate between an integer and a color value for display of models and volumes.
Slicer supports three kinds of tables:
- Continuous scales, like the greyscale table.
- Parametric tables, defined by an equation, such as the fMRIPA table.
- Discrete tables, such as those read in from a file.
Color transfer functions are used to map scalar values, which can be integers or float/double numbers, into color values for display of models and volumes.
You can create a duplicate of a color table to allow editing the names, values and color by clicking on the  icon next to the drop down menu of color table nodes. You can then save the new color table via the File -> Save interface. icon next to the drop down menu of color table nodes. You can then save the new color table via the File -> Save interface.
You can load a color table file from the File -> Add Data dialog.
File format
The color table file format is a plain text file with the .txt or .ctbl extension. Each line in the file has:
label name R G B A
label is an integer, name a string, and RGBA are 0-255.
File example:
# Comments if the line start with #
0 air 0 0 0 0
1 bone 255 255 255 255 whatever after the Alpha value is discarded
2 tumor 255 128 0 255
...
A procedurally defined color node has the file extension .txt (coming soon: an xm version with the extension .cxml). It defines a number of points in a color transfer function using the following format:
position R G B
position is a floating point number that defines the scalar range over which the mapping is valid. RGB are color values from 0.0 to 1.0.
Custom LUTs
You can create custom LUTs by creating a table with the colors on the wiki, saving to file and then loading them into Slicer.
Categories
The colors are divided up into categories:
- Discrete
 Labels: A legacy color table that contains some anatomical mapping Labels: A legacy color table that contains some anatomical mapping FullRainbow: A full rainbow of 256 colors, goes from red to red with all rainbow colors in between. Useful for colorful display of a label map. FullRainbow: A full rainbow of 256 colors, goes from red to red with all rainbow colors in between. Useful for colorful display of a label map. Grey: A grey scale ranging from black at 0 to white at 255. Useful for displaying MRI volumes. Grey: A grey scale ranging from black at 0 to white at 255. Useful for displaying MRI volumes. Iron: A scale from red to yellow, 157 colors. Iron: A scale from red to yellow, 157 colors. Rainbow: Goes from red to purple, passing through the colors of the rainbow in between. Useful for a colorful display of a label map. Rainbow: Goes from red to purple, passing through the colors of the rainbow in between. Useful for a colorful display of a label map. Ocean: A lighter blue scale of 256 values, useful for showing registration results. Ocean: A lighter blue scale of 256 values, useful for showing registration results. Desert: Red to yellow/orange scale, 256 colous. Desert: Red to yellow/orange scale, 256 colous. InvertedGrey: A white to black scale, 256 colors, useful to highlight negative versions, or to flip intensities of signal values. InvertedGrey: A white to black scale, 256 colors, useful to highlight negative versions, or to flip intensities of signal values. ReverseRainbow: A colorful display option, 256 colors going from purple to red ReverseRainbow: A colorful display option, 256 colors going from purple to red fMRI: A combination of Ocean (0-22) and Desert (23-42), useful for displaying functional MRI volumes (highlights activation) fMRI: A combination of Ocean (0-22) and Desert (23-42), useful for displaying functional MRI volumes (highlights activation) fMRIPA: A small fMRI positive activation scale going from red to yellow from 0-19, useful for displaying functional MRI volumes when don't need the blue of the fMRI scale. fMRIPA: A small fMRI positive activation scale going from red to yellow from 0-19, useful for displaying functional MRI volumes when don't need the blue of the fMRI scale. Random: A random selection of 256 rgb colors, useful to distinguish between a small number of labeled regions (especially outside of the brain) Random: A random selection of 256 rgb colors, useful to distinguish between a small number of labeled regions (especially outside of the brain) Red: A red scale of 256 values. Useful for layering with Cyan Red: A red scale of 256 values. Useful for layering with Cyan Green: A green scale of 256 values, useful for layering with Magenta Green: A green scale of 256 values, useful for layering with Magenta Blue: A blue scale of 256 values from black to pure blue, useful for layering with Yellow Blue: A blue scale of 256 values from black to pure blue, useful for layering with Yellow Yellow: A yellow scale of 256 values, from black to pure yellow, useful for layering with blue (it's complementary, layering yields gray) Yellow: A yellow scale of 256 values, from black to pure yellow, useful for layering with blue (it's complementary, layering yields gray) Cyan: A cyan ramp of 256 values, from black to cyan, complementary ramp to red, layering yeilds gray Cyan: A cyan ramp of 256 values, from black to cyan, complementary ramp to red, layering yeilds gray Magenta: A magenta scale of 256 colors from black to magenta, complementary ramp to green, layering yeilds gray Magenta: A magenta scale of 256 colors from black to magenta, complementary ramp to green, layering yeilds gray Warm1: A scale from yellow to red, of 256 colors, ramp of warm colors that's complementary to Cool1 Warm1: A scale from yellow to red, of 256 colors, ramp of warm colors that's complementary to Cool1 Warm2: A scale from green to yellow, 256 colors, ramp of warm colors that's complementary to Cool2 Warm2: A scale from green to yellow, 256 colors, ramp of warm colors that's complementary to Cool2 Warm3: A scale from cyan to green, 256 colors, ramp of warm colors that's complementary to Cool3 Warm3: A scale from cyan to green, 256 colors, ramp of warm colors that's complementary to Cool3 Cool1: A scale from blue to cyan, 256 colors, ramp of cool colors that's complementary to Warm1 Cool1: A scale from blue to cyan, 256 colors, ramp of cool colors that's complementary to Warm1 Cool2: A scale from magenta to blue, 256 colous, ramp of cool colors that's complementary to Warm2 Cool2: A scale from magenta to blue, 256 colous, ramp of cool colors that's complementary to Warm2 Cool3: A scale from red to magenta, ramp of cool colors that's complementary to Warm3 Cool3: A scale from red to magenta, ramp of cool colors that's complementary to Warm3 RandomIntegers: A random scale with 1000 entries. RandomIntegers: A random scale with 1000 entries.
- Shade:
 WarmShade1: A scale from black to red, of 256 colors, ramp of warm colors with variation in value that's complementary to CoolShade1 WarmShade1: A scale from black to red, of 256 colors, ramp of warm colors with variation in value that's complementary to CoolShade1 WarmShade2: A scale from black to yellow, through green, of 256 colors, ramp of warm colors with variation in value that's complementary to CoolShade2 WarmShade2: A scale from black to yellow, through green, of 256 colors, ramp of warm colors with variation in value that's complementary to CoolShade2 WarmShade3: A scale from black to green, of 256 colors, ramp of warm colors with variation in value that's complementary to CoolShade3 WarmShade3: A scale from black to green, of 256 colors, ramp of warm colors with variation in value that's complementary to CoolShade3 CoolShade1: A scale from black to cyan, 256 colors, ramp of cool colors with variation in value that is complementary to WarmShade1 CoolShade1: A scale from black to cyan, 256 colors, ramp of cool colors with variation in value that is complementary to WarmShade1 CoolShade2: A scale from black to blue through purple, 256 colors, ramp of cool colors with variation in value that is complementary to WarmShade2 CoolShade2: A scale from black to blue through purple, 256 colors, ramp of cool colors with variation in value that is complementary to WarmShade2 CoolShade3: A scale from black to magenta, 256 colors, ramp of cool colors with variation in value that is complementary to WarmShade3 CoolShade3: A scale from black to magenta, 256 colors, ramp of cool colors with variation in value that is complementary to WarmShade3
- Tint:
 WarmTint1: A scale from white to red, 256 colors, ramp of warm colors with variation in saturation that's complementary to CoolTint1 WarmTint1: A scale from white to red, 256 colors, ramp of warm colors with variation in saturation that's complementary to CoolTint1 WarmTint2: A scale from white to yellow, 256 colors, ramp of warm colors with variation in saturation that's complementary to CoolTint2 WarmTint2: A scale from white to yellow, 256 colors, ramp of warm colors with variation in saturation that's complementary to CoolTint2 WarmTint3: A scale from white to green, 256 colors, ramp of warm colors with variation in saturation that's complementary to CoolTint3 WarmTint3: A scale from white to green, 256 colors, ramp of warm colors with variation in saturation that's complementary to CoolTint3 CoolTint1: A scale from white to cyan, 256 colors, ramp of cool colors with variations in saturation that's complementary to WarmTint1 CoolTint1: A scale from white to cyan, 256 colors, ramp of cool colors with variations in saturation that's complementary to WarmTint1 CoolTint2: A scale from white to blue, 256 colors, ramp of cool colors with variations in saturation that's complementary to WarmTint2 CoolTint2: A scale from white to blue, 256 colors, ramp of cool colors with variations in saturation that's complementary to WarmTint2 CoolTint3: A scale from white to magenta, 256 colors, ramp of cool colors with variations in saturation that's complementary to WarmTint3 CoolTint3: A scale from white to magenta, 256 colors, ramp of cool colors with variations in saturation that's complementary to WarmTint3
- Continuous
 RedGreenBlue: A scale defined from -6.0 to 6.0 that maps to a rainbow from red to blue through green. RedGreenBlue: A scale defined from -6.0 to 6.0 that maps to a rainbow from red to blue through green.
- FreeSurfer
 Heat: The Heat FreeSurfer color table, shows hot spots with high activation Heat: The Heat FreeSurfer color table, shows hot spots with high activation BlueRed: A FreeSurfer color scale, 256 colors, from blue to red BlueRed: A FreeSurfer color scale, 256 colors, from blue to red RedBlue: A FreeSurfer color scale, 256 colors, from red to blue RedBlue: A FreeSurfer color scale, 256 colors, from red to blue RedGreen: A FreeSurfer color scale, 256 colors, from red to green, used to highlight sulcal curvature RedGreen: A FreeSurfer color scale, 256 colors, from red to green, used to highlight sulcal curvature GreenRed: A FreeSurfer color scale, 256 colors, from green to red, used to highlight sulcal curvature GreenRed: A FreeSurfer color scale, 256 colors, from green to red, used to highlight sulcal curvature- FreeSurferLabels: A color table read in from a text file, each line of the format: IntegerLabel Name R G B Alpha
- PET
 PET-Heat: Useful for displaying colorized PET data. PET-Heat: Useful for displaying colorized PET data. PET-Rainbow: Useful for displaying colorized PET data. PET-Rainbow: Useful for displaying colorized PET data. PET-MaximumIntensityProjection: Useful for displaying inverse grey PET data. PET-MaximumIntensityProjection: Useful for displaying inverse grey PET data.
- Cartilage MRI
 dGEMRIC-1.5T: Useful for displaying 1.5 tesla delayed gadolinium-enhanced MRI of cartilage dGEMRIC-1.5T: Useful for displaying 1.5 tesla delayed gadolinium-enhanced MRI of cartilage dGEMRIC-3T: Useful for displaying 3 Tesla delayed gadolinium-enhanced MRI of cartilage dGEMRIC-3T: Useful for displaying 3 Tesla delayed gadolinium-enhanced MRI of cartilage
- Default Labels from File:
- a list of color nodes loaded from files, from the default Slicer color directory
- ColdToHotRainbow: a shifted rainbow that runs from blue to red, useful when needing to display a volume for which larger values are hotter
- HotToColdRainbow: a shifted rainbow that runs from red to blue, useful when needing to display a volume for which larger values are colder
 PelvisColor: useful for displaying segmented pelvic MRI volumes PelvisColor: useful for displaying segmented pelvic MRI volumes Slicer3_2010_Brain_Labels: a brain segementation table with 16 labels defined. Slicer3_2010_Brain_Labels: a brain segementation table with 16 labels defined. 64Color-Nonsemantic: A color table with no semantic labels, pure color information 64Color-Nonsemantic: A color table with no semantic labels, pure color information- MediumChartColors: A Stephen Few palette. Similar to the Dark Bright color but in the medium range of intensity. May be a better choice for bar charts.
- DarkBrightChartColors: Palette designed by Stephen Few in "Practical Rules for Using Colors in Charts". Similar to the Maureen Stone palette. Stephen Few recommends this palette for highlighting data. This palette is useful when display small points or thin lines. Again, this palette is good for categorical data.
 Slicer3_2010_LabelColors: a table with 16 labels defined. Slicer3_2010_LabelColors: a table with 16 labels defined.- AbdomenColors: useful for displaying segmented abdominal MRI volumes
- SPL-BrainAtlas-ColorFile: useful for displaying segmented brain MRI volumes
- SPL-BrainAtlas-2012-ColorFile: an updated brain segmentation color node
- LightPaleChartColors: A light pale palette from Stephen Few, useful for charts.
- SPL-BrainAtlas-2009-ColorFile: an updated brain segmentation color node
- File
- If you load a color file from File -> Add Data, it will appear here
- User Generated: A user defined color table, use the editor to specify it
- Copies of other color tables get displayed in this category
- If you create a new color node, it will appear here
- GenericAnatomyColors: a list of whole body anatomy labels and useful colors for them, the default for the Editor module creating new label map volumes
- Generic Colors: a list of colors with the names being the same as the integer value for each entry
|
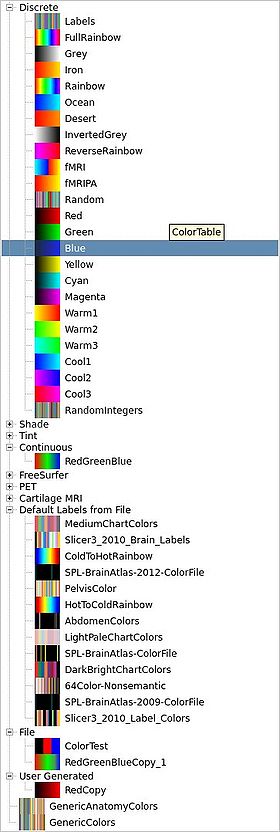 Drop down menu showing current color tables |
Use Cases
The Colors module Color Table Display panel can be popped up as a stand alone widget and used to select colors in other modules of Slicer4.
- The Models module uses it to select surface model colors.
- The Volumes module uses it to select color maps for label map volumes to control which colors are used to display the scalar values at each voxel
- The Editor uses it to select colors with which to paint on label map volumes.
- Select and edit colors for Charting
Tutorials
N/A
Panels and their use
- Colors: a drop down menu from which to select from the list of loaded color nodes
- [image:Slicer43-Colors-FolderPlus.jpeg]] Copy Color Node button: Duplicate the current color node to edit the color entries, built-in color nodes don't allow user editing.
- Color Table Display panel:
- Number of Colors: the number of colors in the currently selected table.
- Hide empty Colors: When checked, hide the unnamed color entries in the list below.
- Scalar Range: The range of scalar values that are mapped to to the full range of colors. This only changes the display range, not the values in the table.
- Table of currently selected colors:
- 1st Column: Index: the integer value giving the index of this color in the look up table, used to match it up with a scalar value in a volume voxel.
- 2nd Column: Color: a box showing the current color. When viewing an editable table, double click on it to bring up a color picker.
- Label: the text description of the color, often an anatomical label. For some tables, the name is automatically generated from the RGBA values.
- Opacity: a value between 0 and 1 describing how opaque this color is. The background color at index 0 is usually set to 0 and other colors to 1.
|
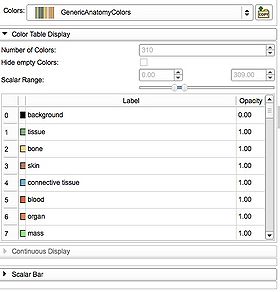 Color Table Display panel |
- Continuous Display Panel
- For Slicer default nodes this panel is not editable, make a copy to inspect the color values by clicking on the circles that determine the points of the continuous function. Click elsewhere in the color display to add new points.
- Point: the index of this point
- Color box: click on this to edit the color for this point
- Floating point number: the scalar value that maps to this color
|
|
- Scalar Bar panel:
- Use color names for labels: check this box if you wish to use the names of the colors for the labels in the scalar bar widget, uncheck if you wish to use the scalar values.
- Display scalar bar: check this box if you wish to see a scalar bar in the 3d view that shows the range of colors for this color look up table. You can drag the widget around in the 3D window, it will resize and switch between horizontal and vertical alignments.
- Title properties control the display of the scalar bar's title text.
- Text: Title text with the color node name, often showing the measurement units of mm.
- Color: the color to use for the title text.
- Opacity: the opacity of the title text.
- Font: the font used to display the title text.
- Style: check these boxes if you wish to adjust the style of the title text font.
- Labels properties control the display of the scalar bar's label text, displayed along the length of the scalar bar.
- Format: a string format that controls the number of digits in the values displayed as the scalar bar labels, uses standared C++ string format notation.
- Color: the color to use for the label text.
- Opacity: the opacity of the label text.
- Font: the font used to display the label text.
- Style: check these boxes if you wish to adjust the style of the label text font.
- Maximum number of colors: limit the range of colors displayed on the scalar bar.
- Number of labels: how many labels to display along the length of the scalar bar.
|
|
Similar Modules
- The Volumes, Editor and Models modules use the colors to adjust the display properties for label map volumes and surface models
References
Information for Developers
|


