File list
From Slicer Wiki
This special page shows all uploaded files.
| Date | Name | Thumbnail | Size | Description | Versions |
|---|---|---|---|---|---|
| 15:38, 14 September 2016 | CardiacCT.seq.nrrd (file) | 12.49 MB | Cardiac CT scan that can be replayed by Sequences extension. | 1 | |
| 18:13, 21 October 2015 | MatlabBridgeTutorial.pdf (file) |  |
2.61 MB | Updated links | 2 |
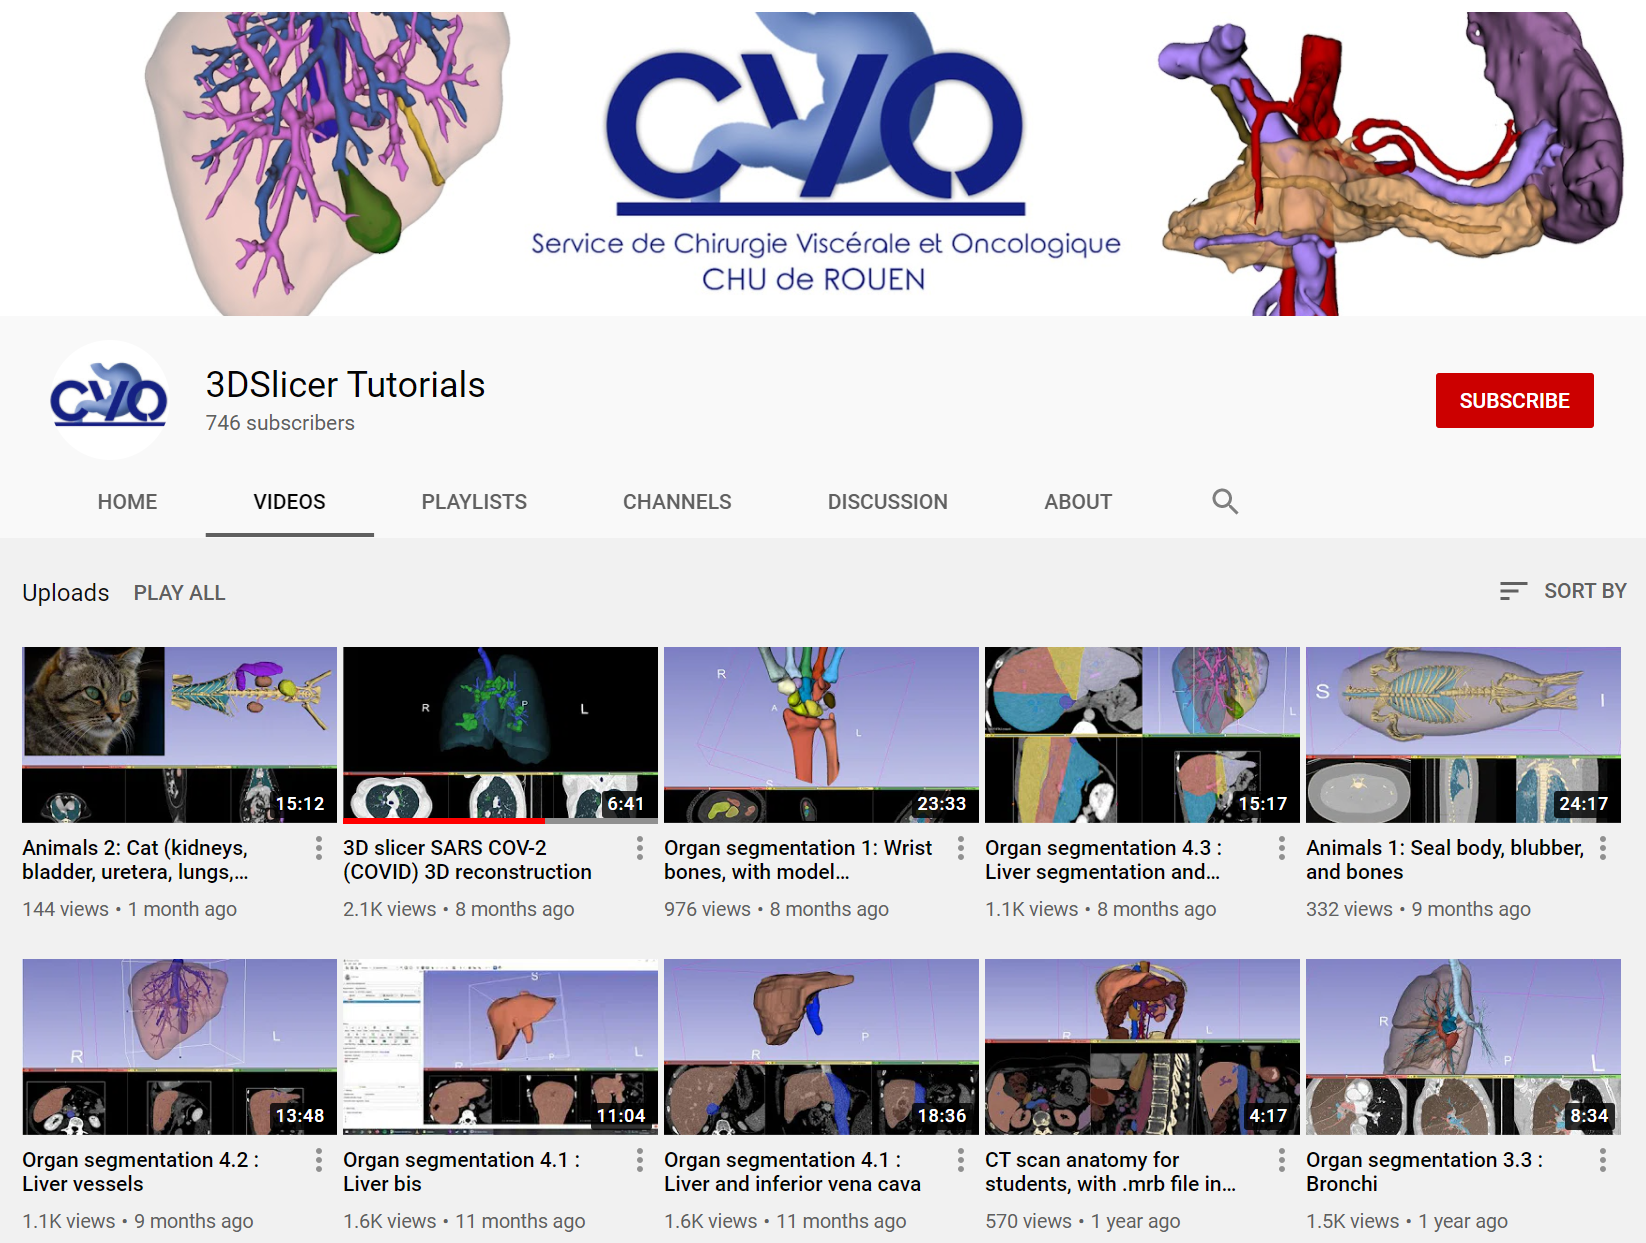
| 19:35, 11 December 2020 | ChuRouen.png (file) |  |
1.27 MB | Screenshot from the youtube channel of https://www.youtube.com/channel/UC8vxI0-dEWrw0_tBF-v8xGA/videos (CHU de Rouen, France) | 1 |
| 01:33, 4 November 2014 | CleaverSampleData.zip (file) | 1.14 MB | Sample data for Cleaver extension | 1 | |
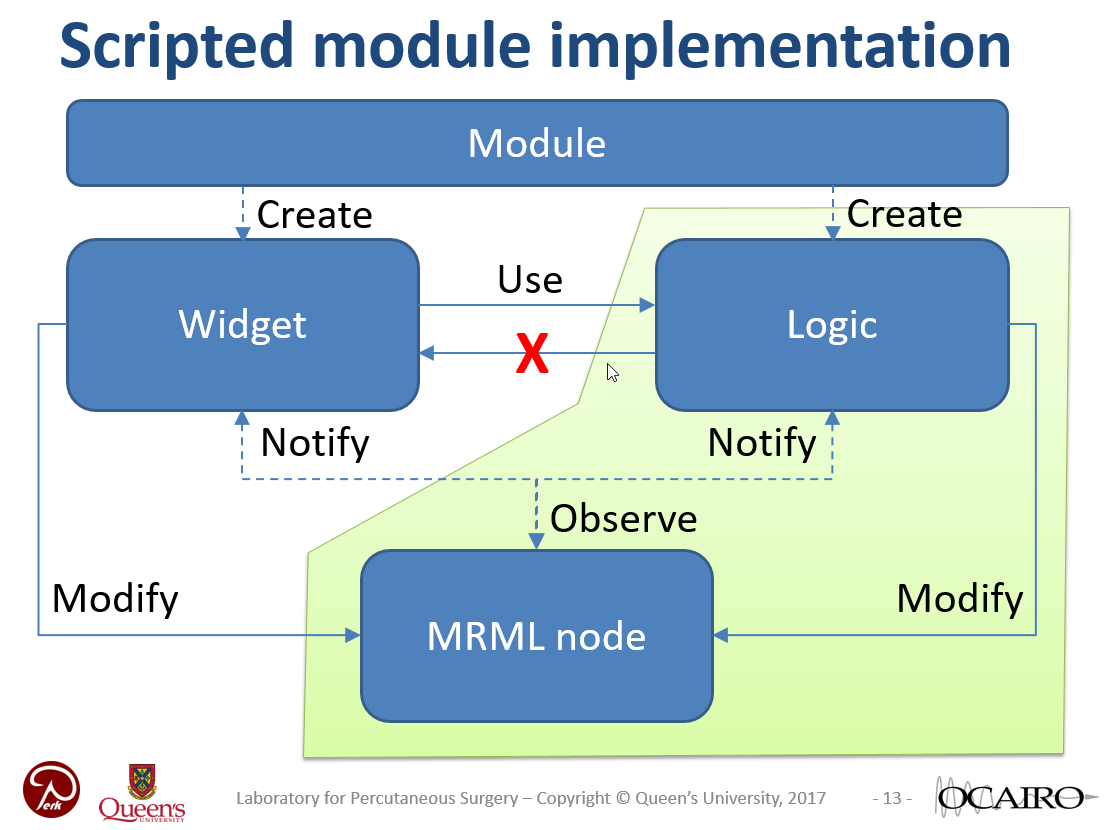
| 17:32, 21 April 2017 | SlicerModulesProgrammingBeyondBasics.pdf (file) |  |
910 KB | Python scripted module design - beyond basics (role of widget, logic, MRML classes, using MRML node for storing module parameters, etc.) | 1 |
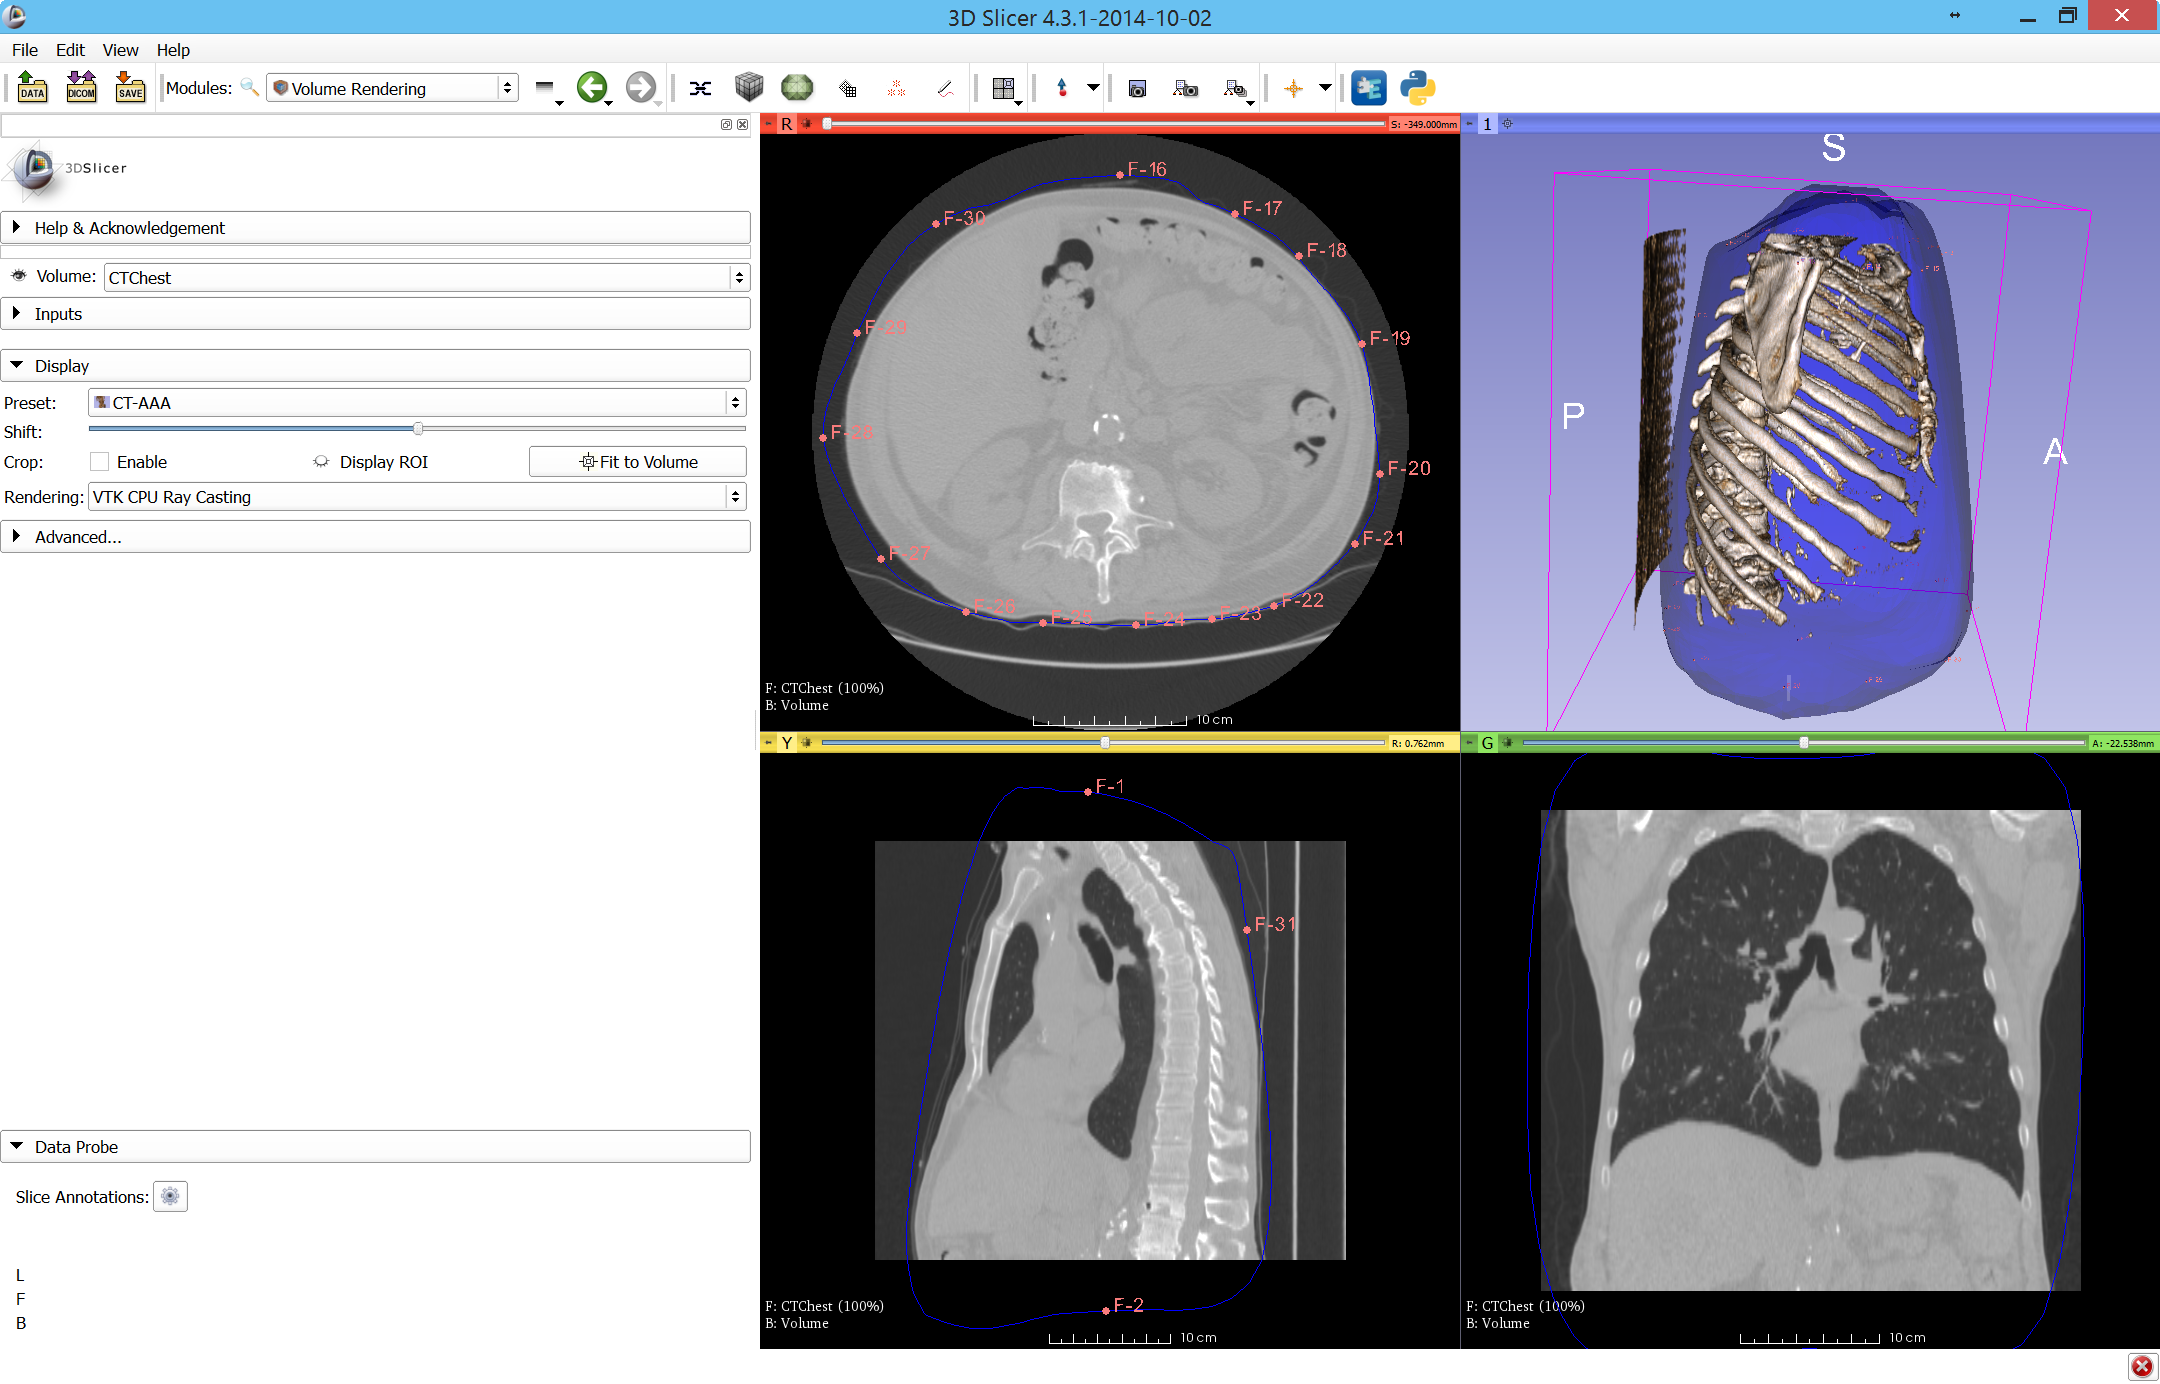
| 06:39, 18 October 2014 | VolumeClipScreenshot1.png (file) |  |
905 KB | Before applying volume clipping (table is visible) | 1 |
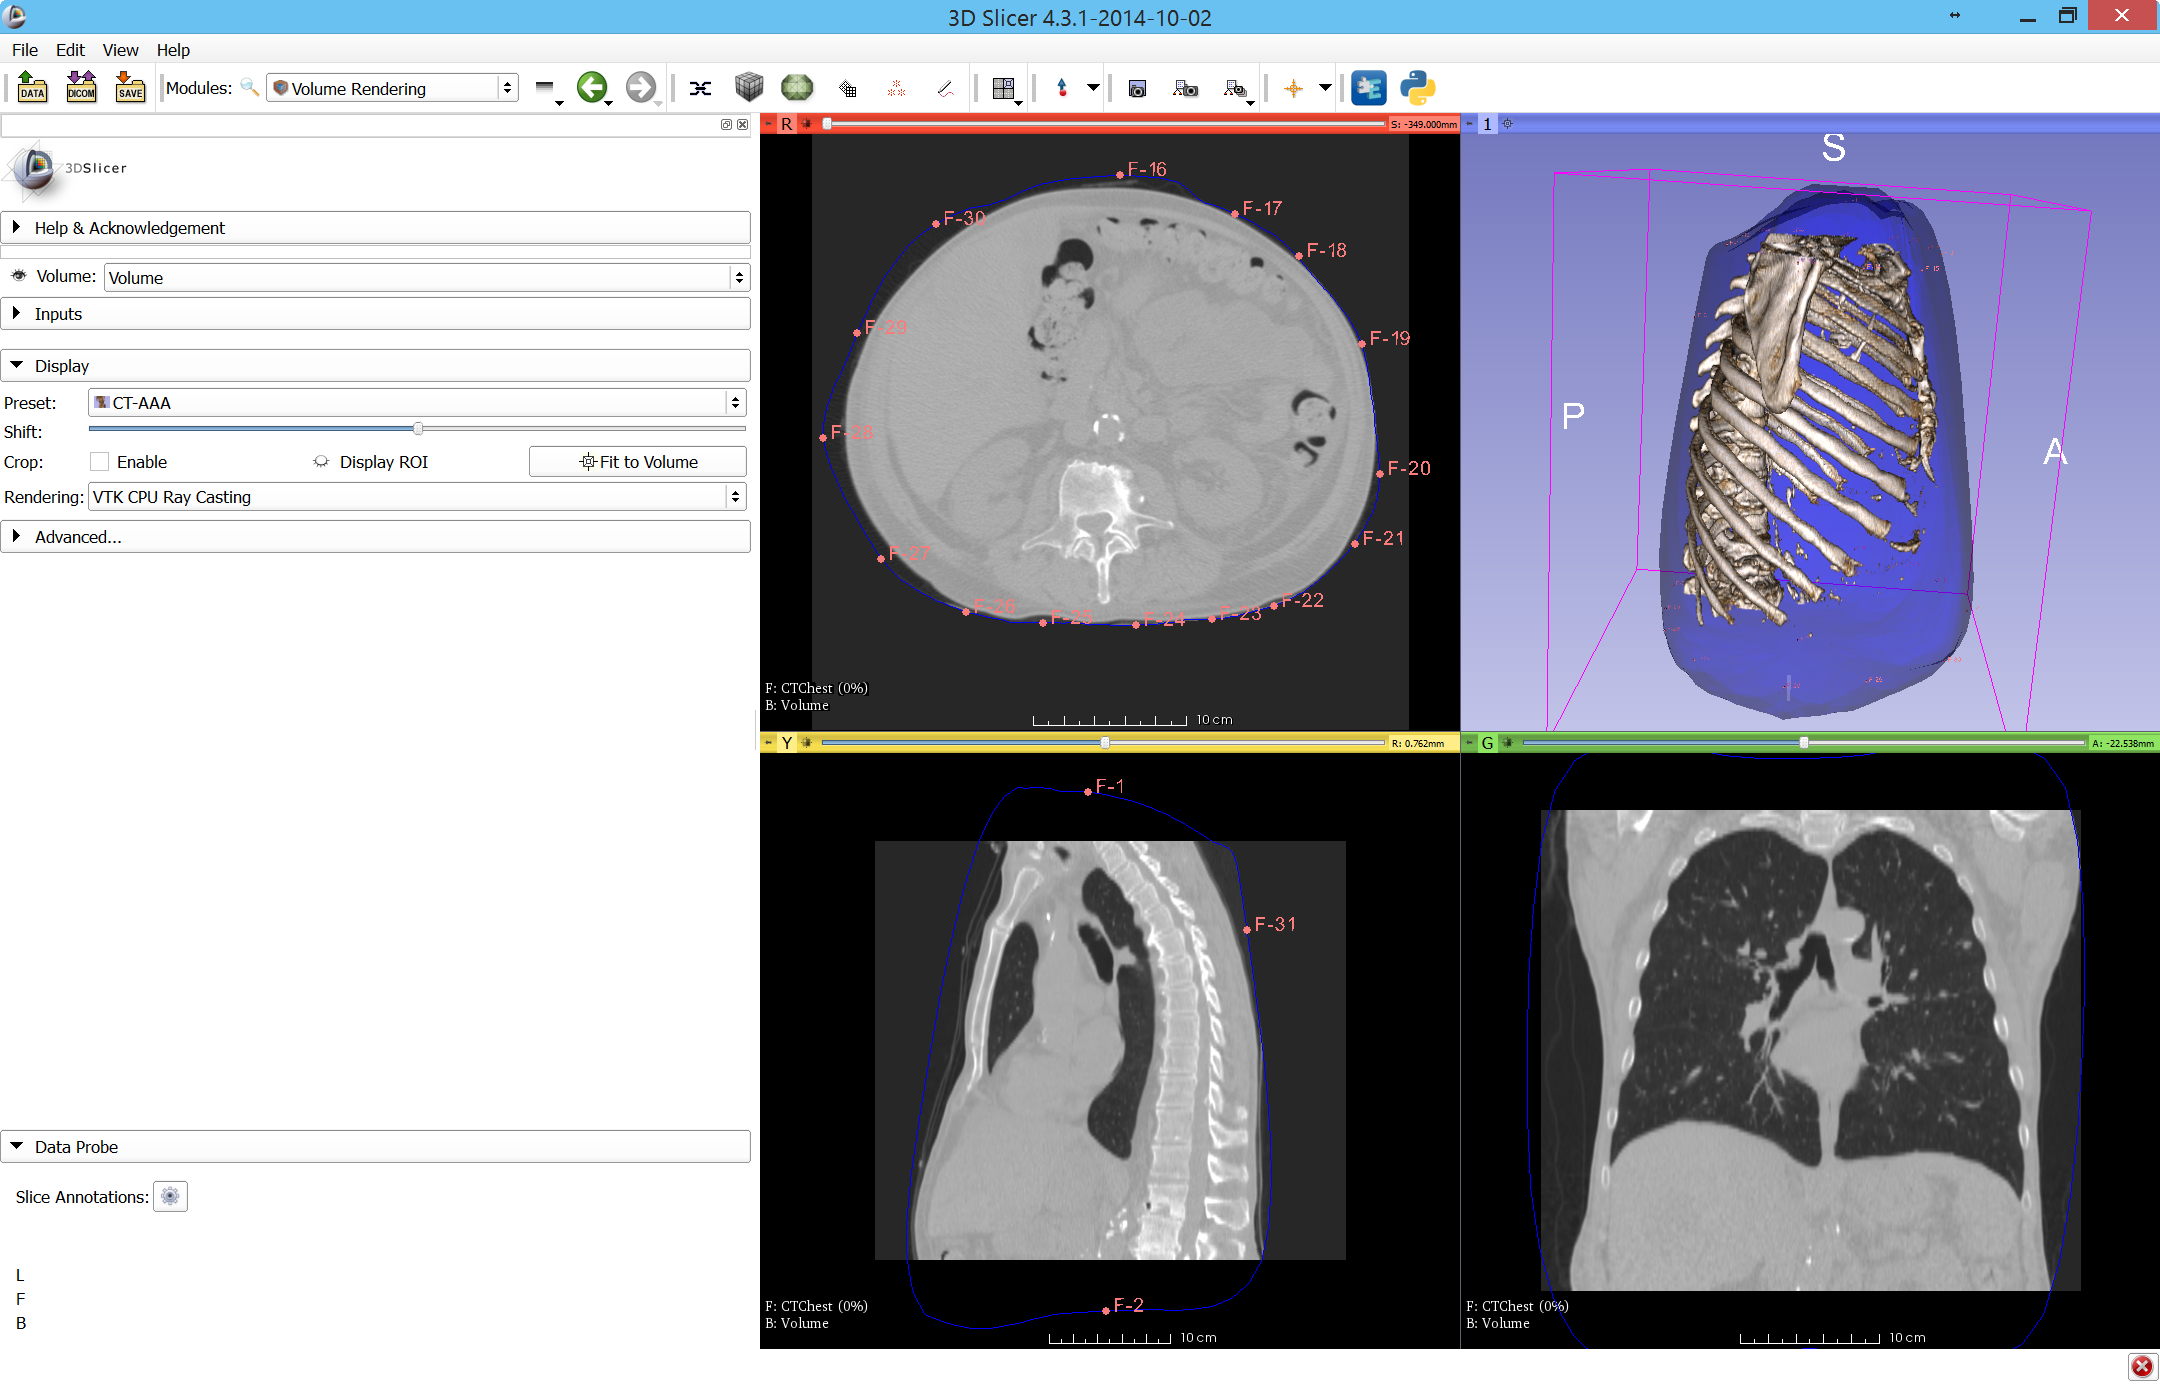
| 06:40, 18 October 2014 | VolumeClipScreenshot2.png (file) |  |
810 KB | After applying volume clipping (table is removed) | 1 |
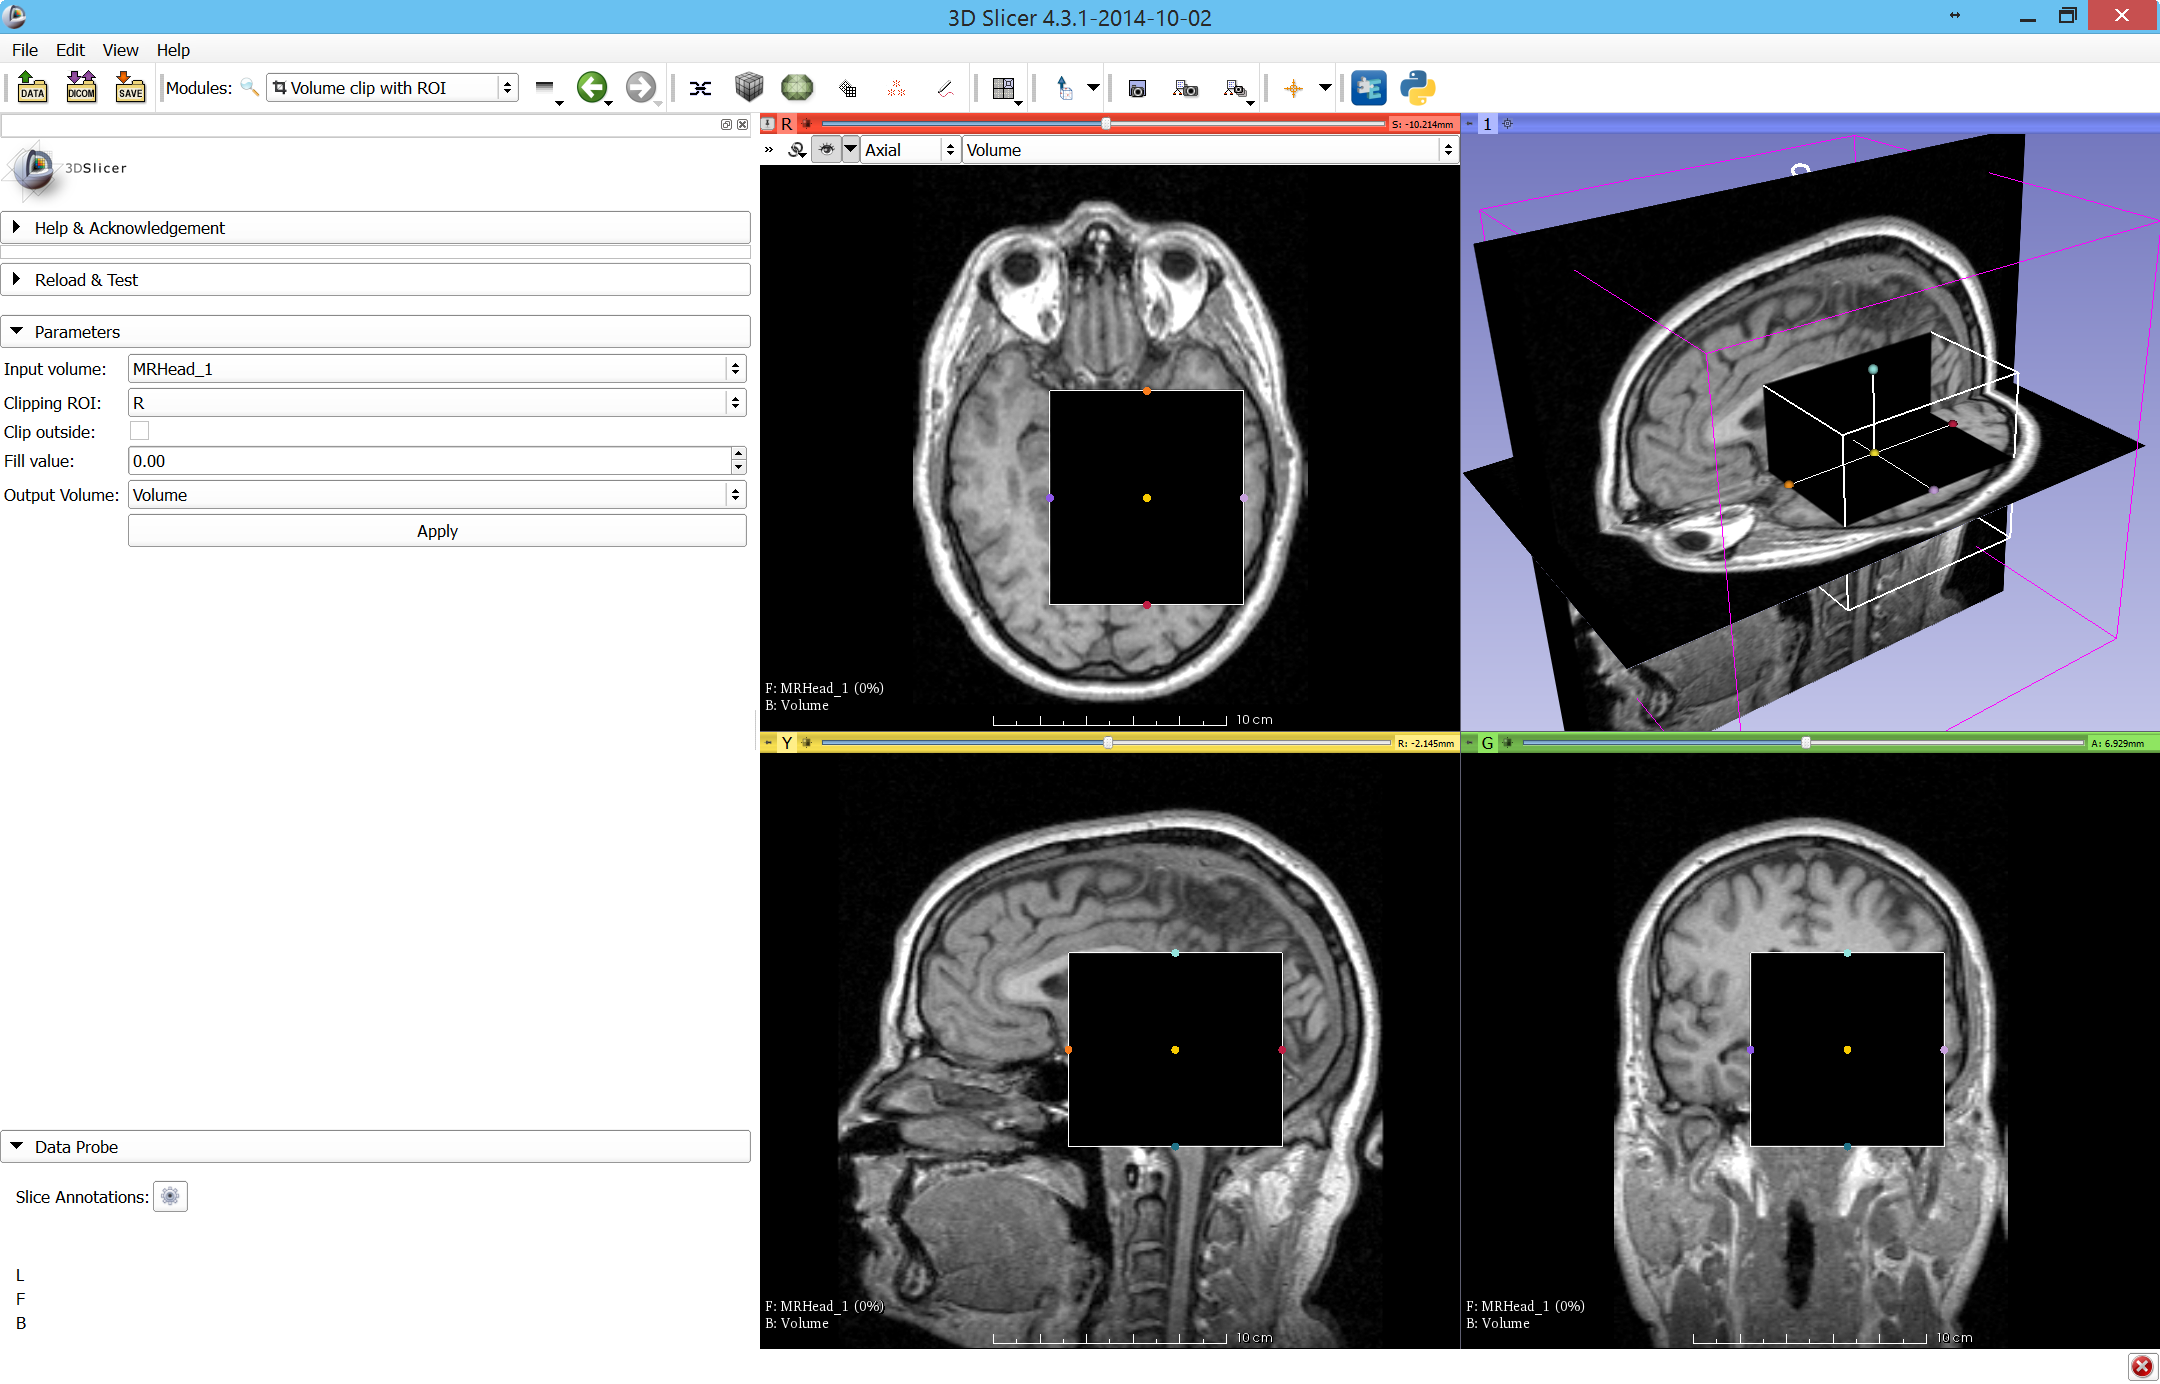
| 06:41, 18 October 2014 | VolumeClipScreenshot3.png (file) |  |
800 KB | Simple volume clipping example with ROI box | 1 |
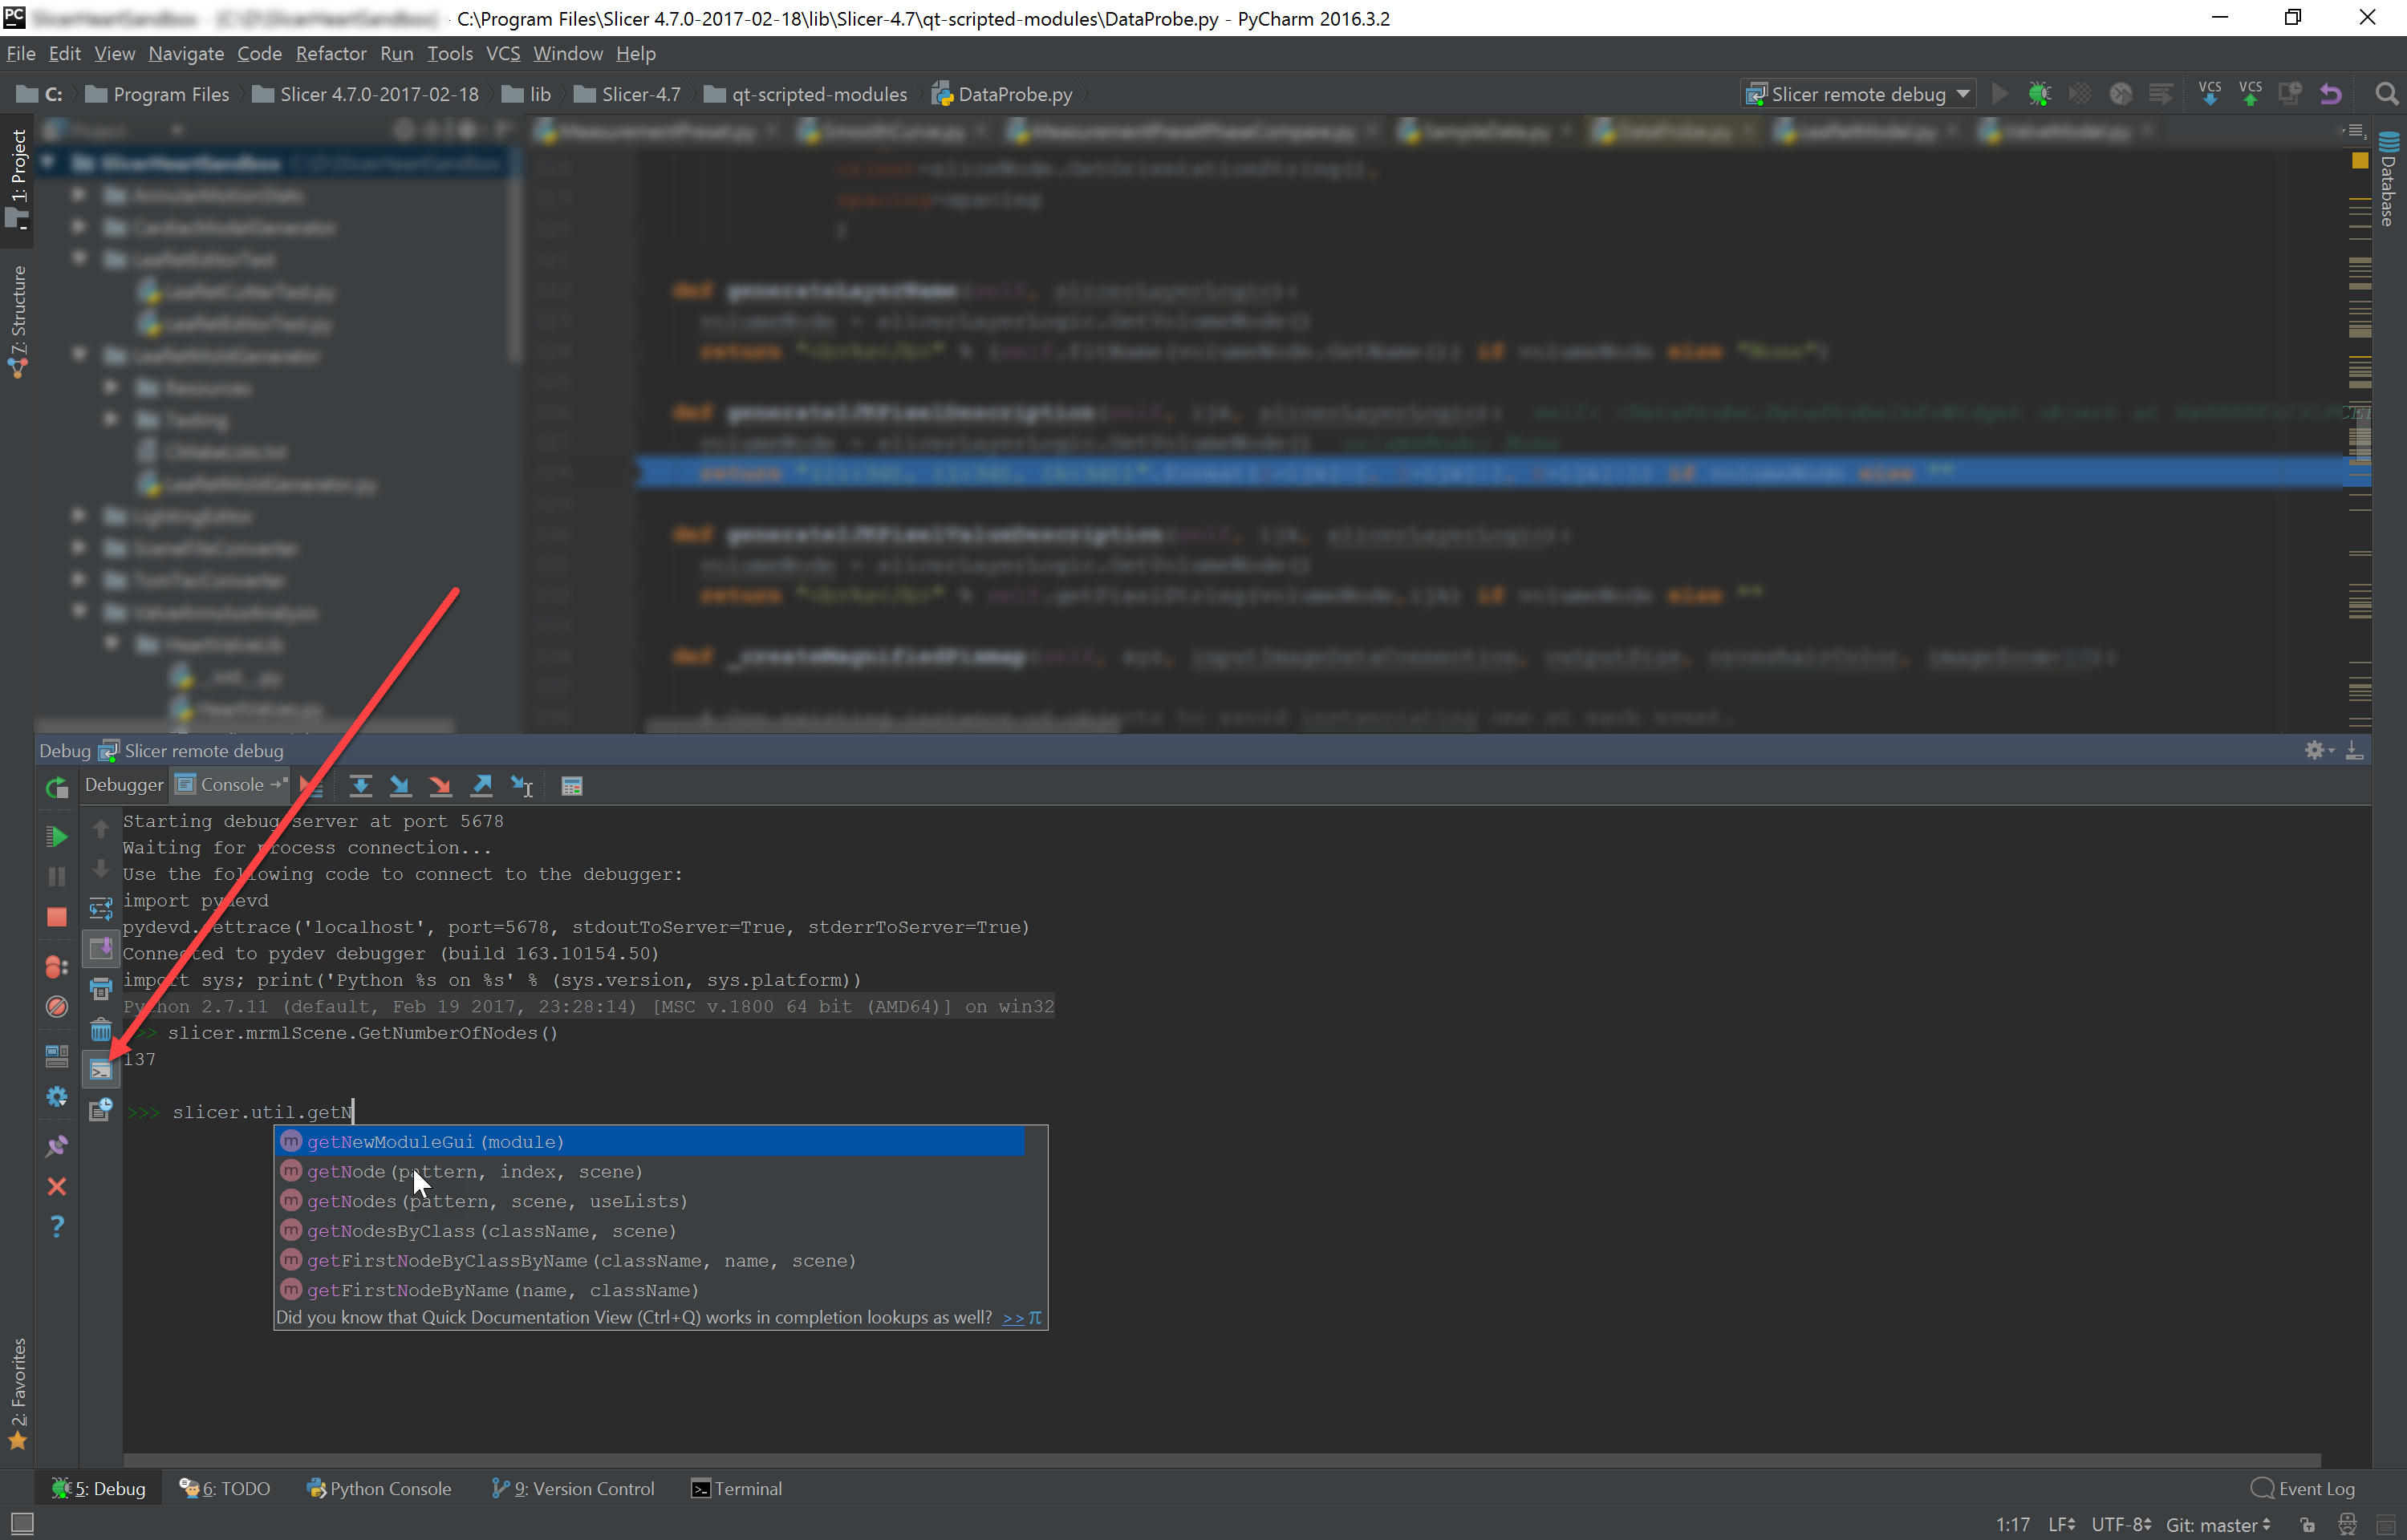
| 15:13, 28 February 2017 | PyCharmDebugConsole.png (file) |  |
766 KB | Once Slicer is paused at a breakpoint, you can open a terminal, where you can enter Python commands (you have access to all Slicer variables, it has auto-complete, etc). Click the small terminal icon Show Python Prompt to open the Python console. | 1 |
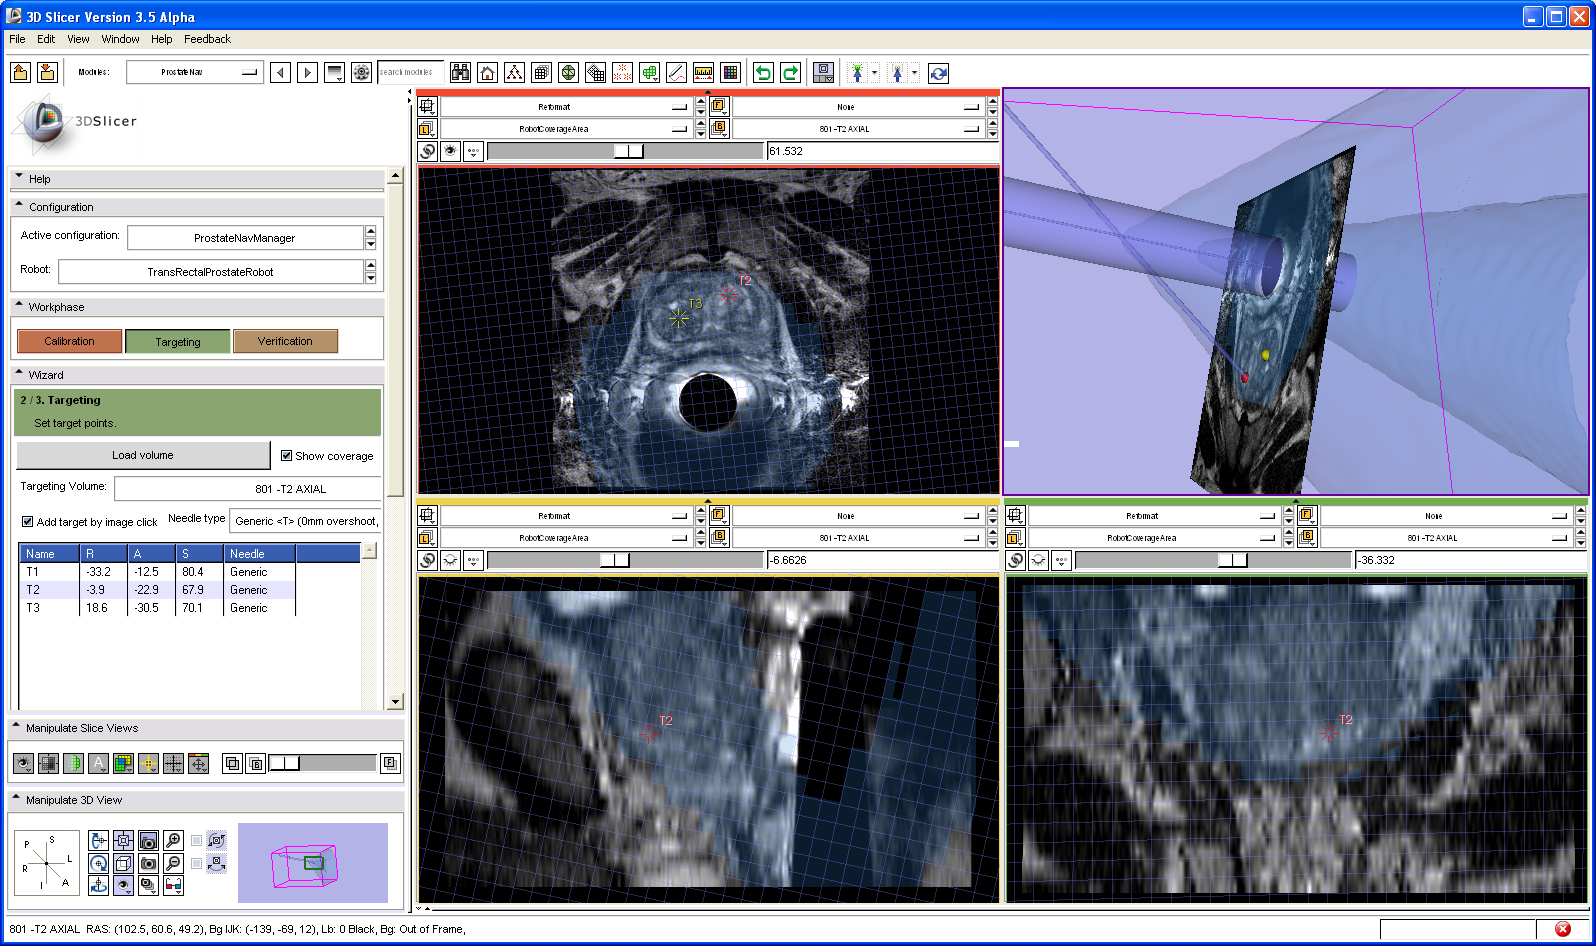
| 15:12, 26 April 2010 | ProstateNav gallery.png (file) |  |
707 KB | Sample screenshot of the ProstateNav module: targeting using the transrectal robot device. Slicer3 visualizes the target planning image, target point, needle trajectory, transrectal probe, and robot coverage area. | 1 |
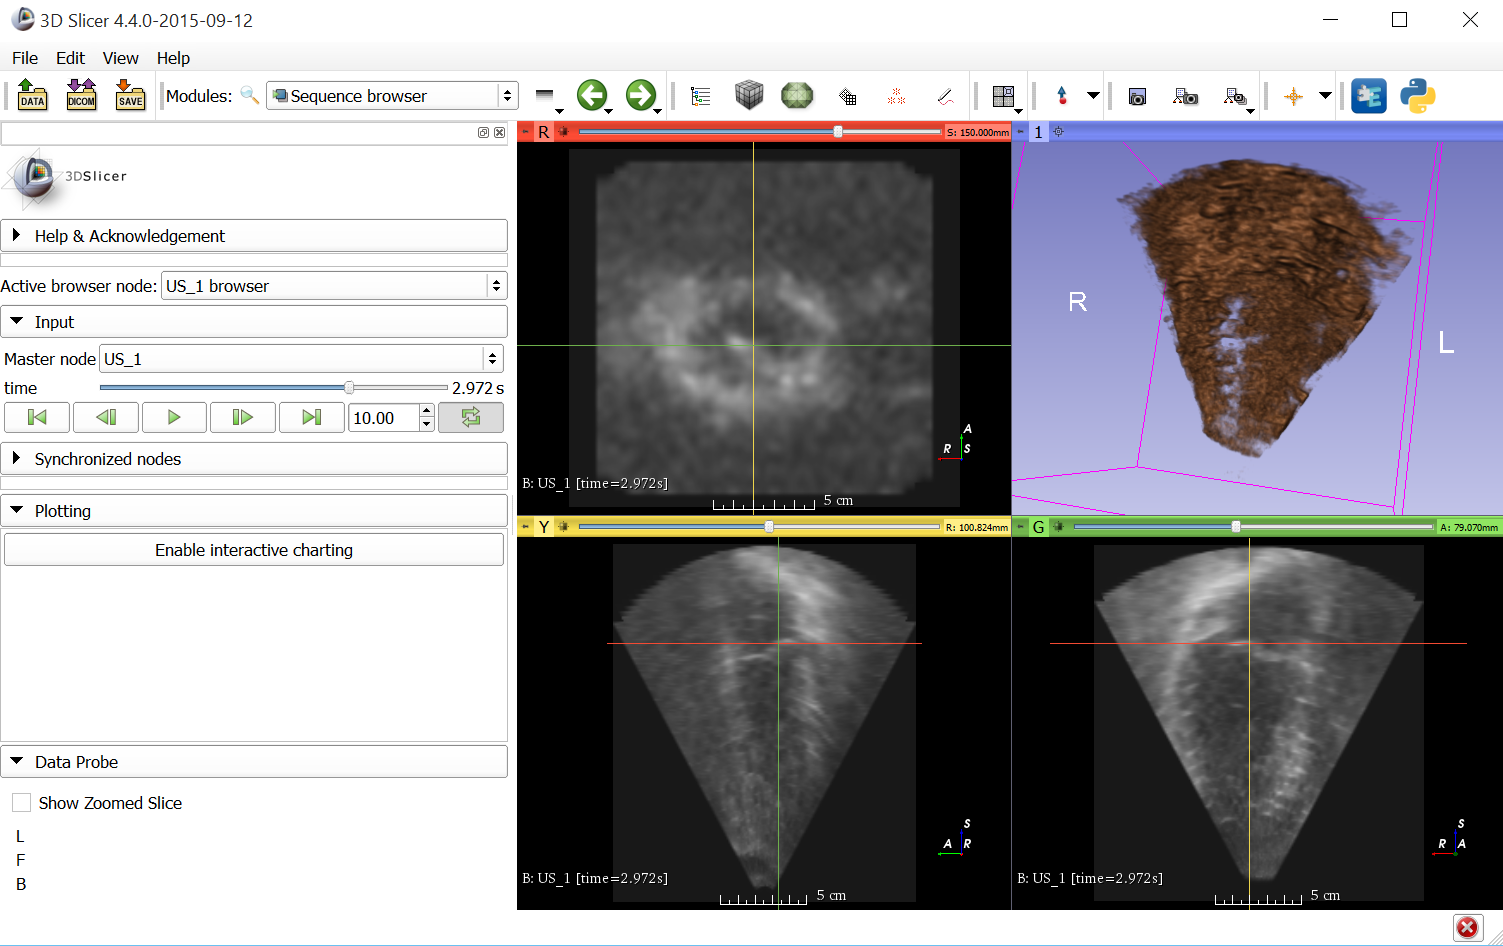
| 04:56, 21 January 2014 | UltrasoundToolGuidance3dOnly.gif (file) |  |
668 KB | Replay of an ultrasound-guided needle insertion image and tracking data using the Multidimensional Data extension. Multiple different sequences (tracking data, imaging data) are replayed synchronously. | 1 |
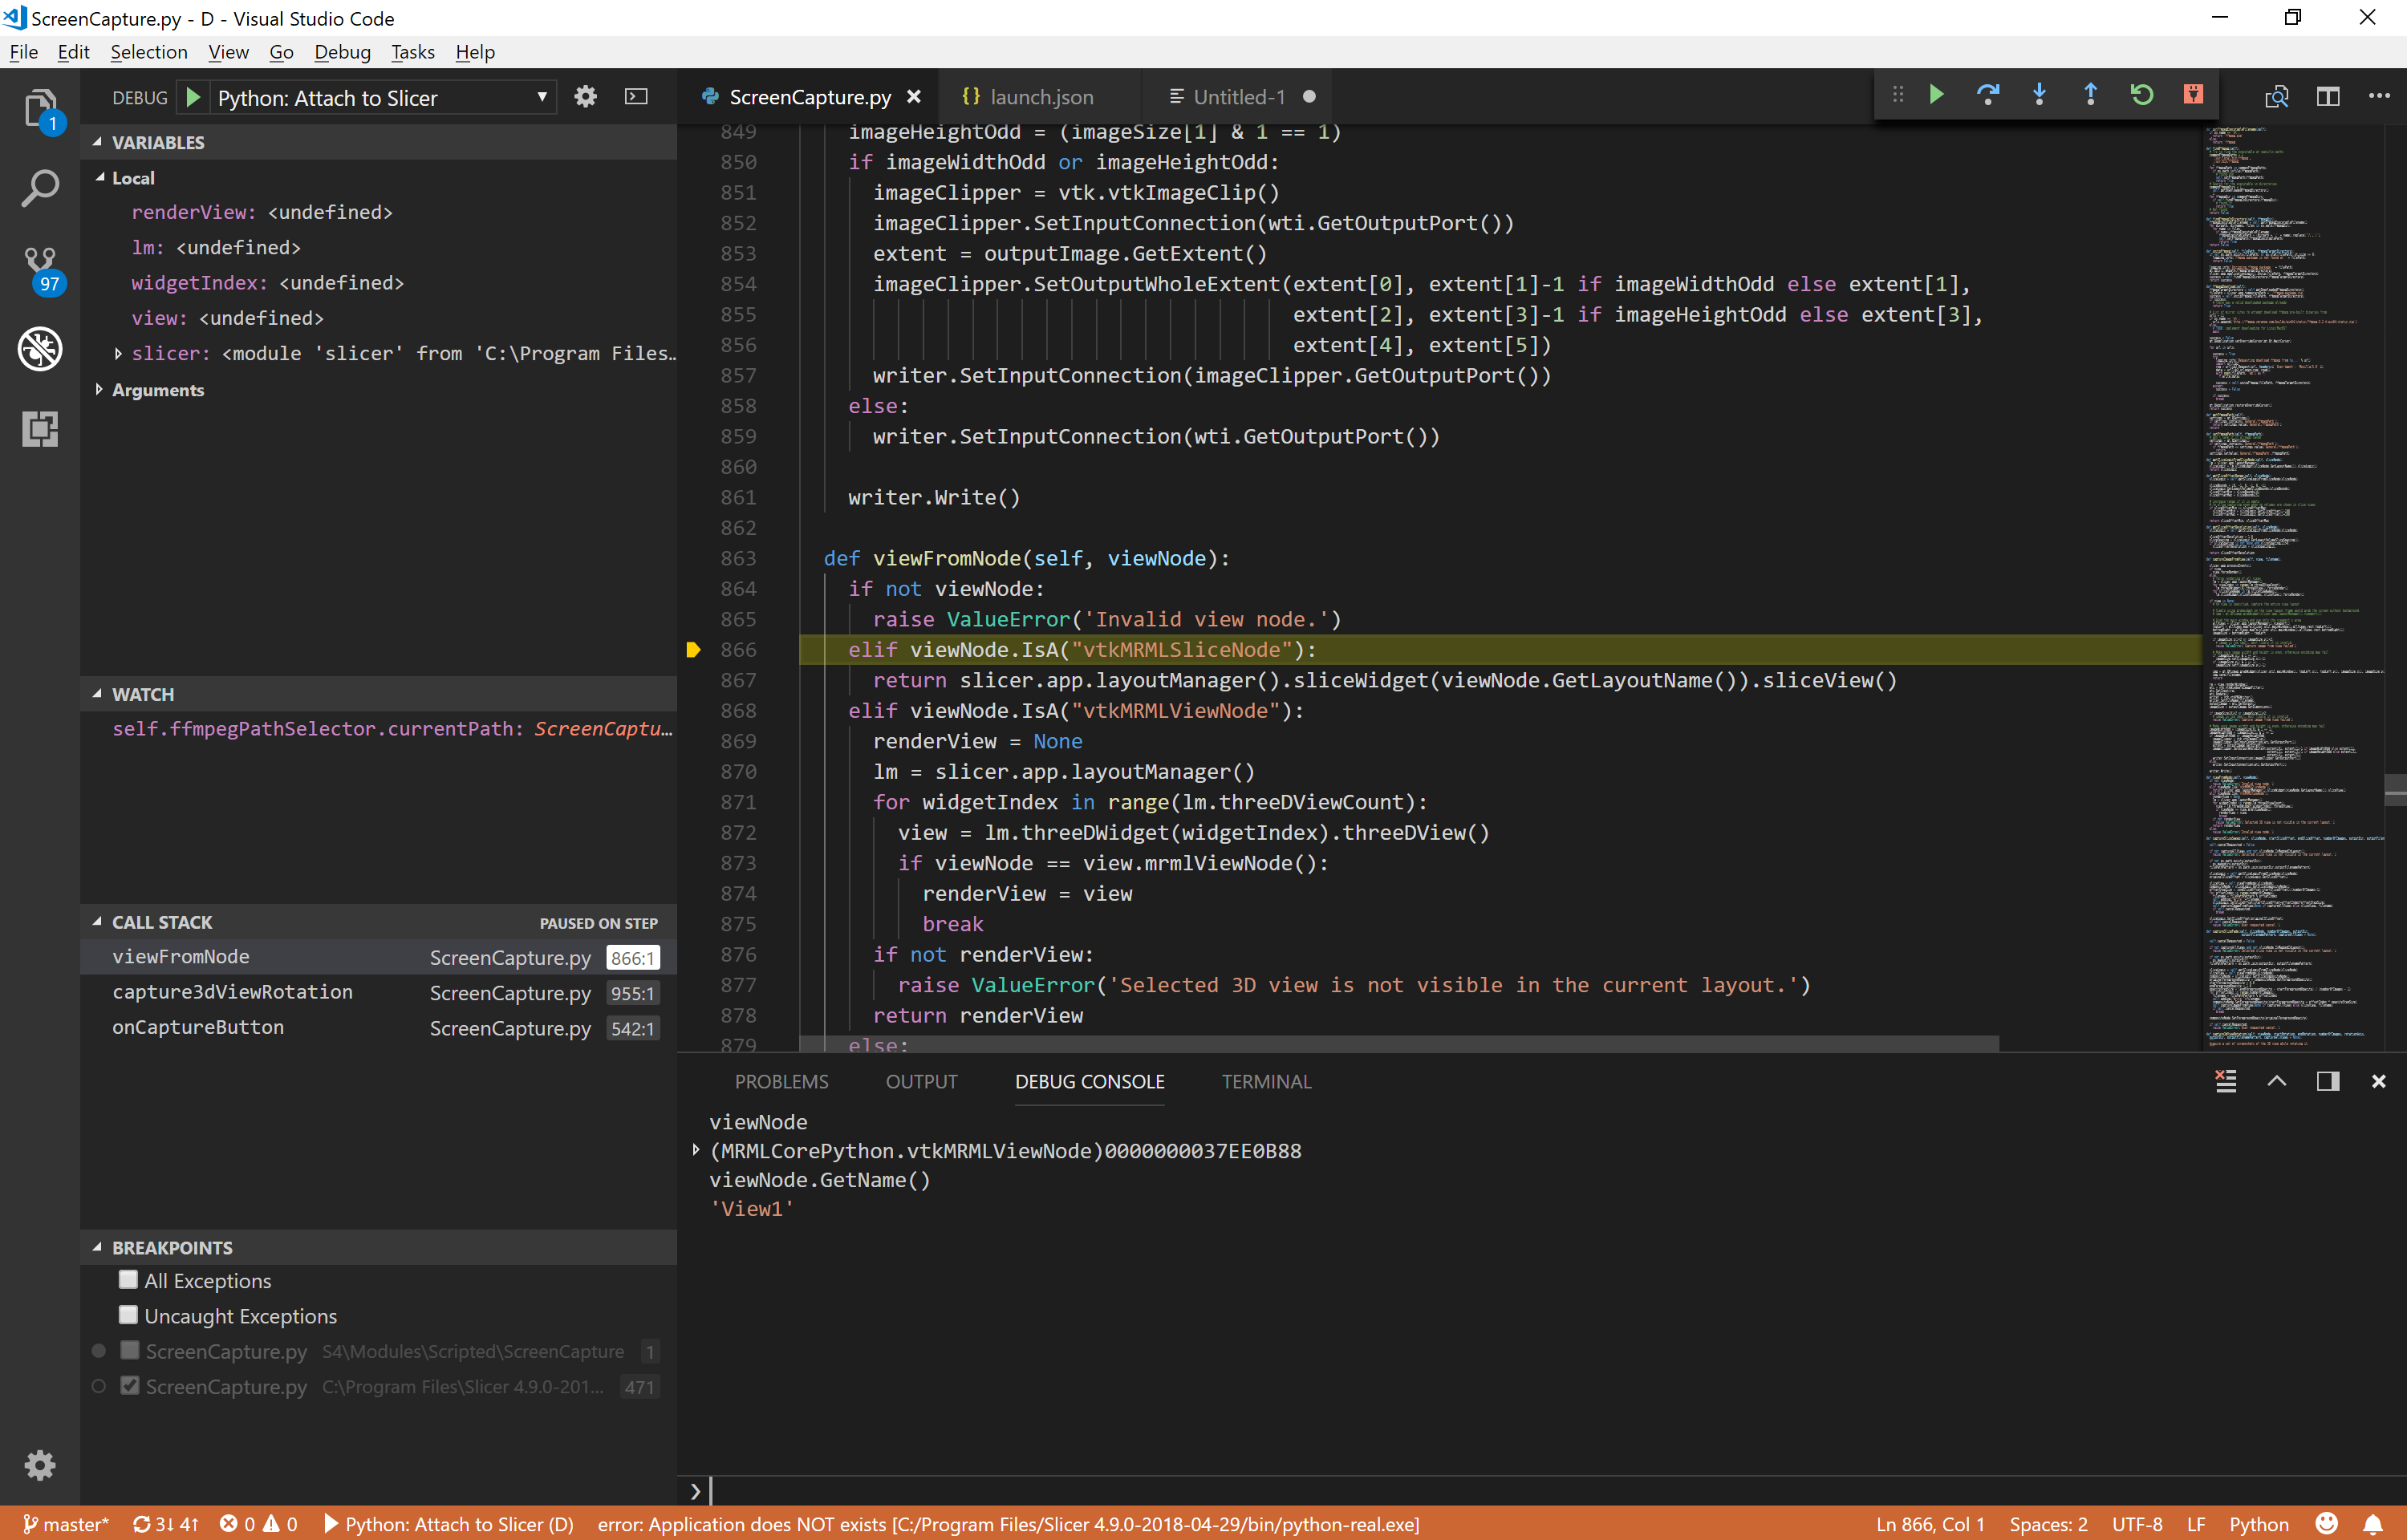
| 05:38, 25 May 2018 | VisualStudioCodePythonDebuggerExample.png (file) |  |
658 KB | 1 | |
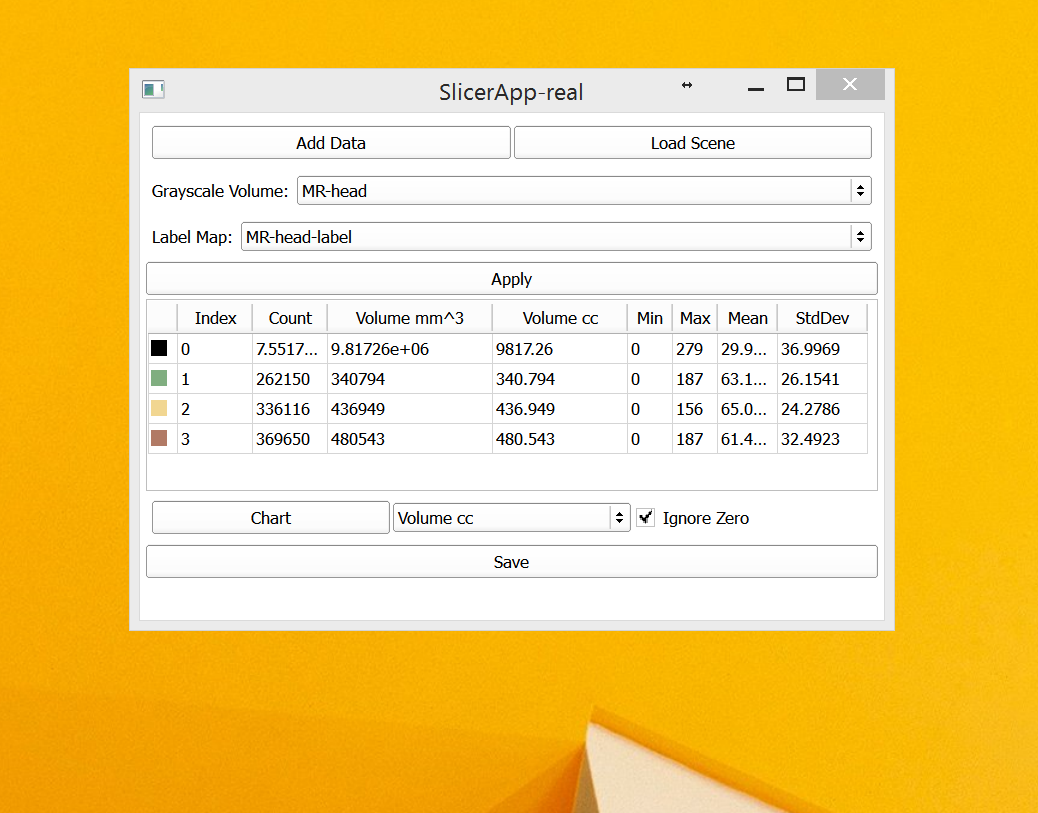
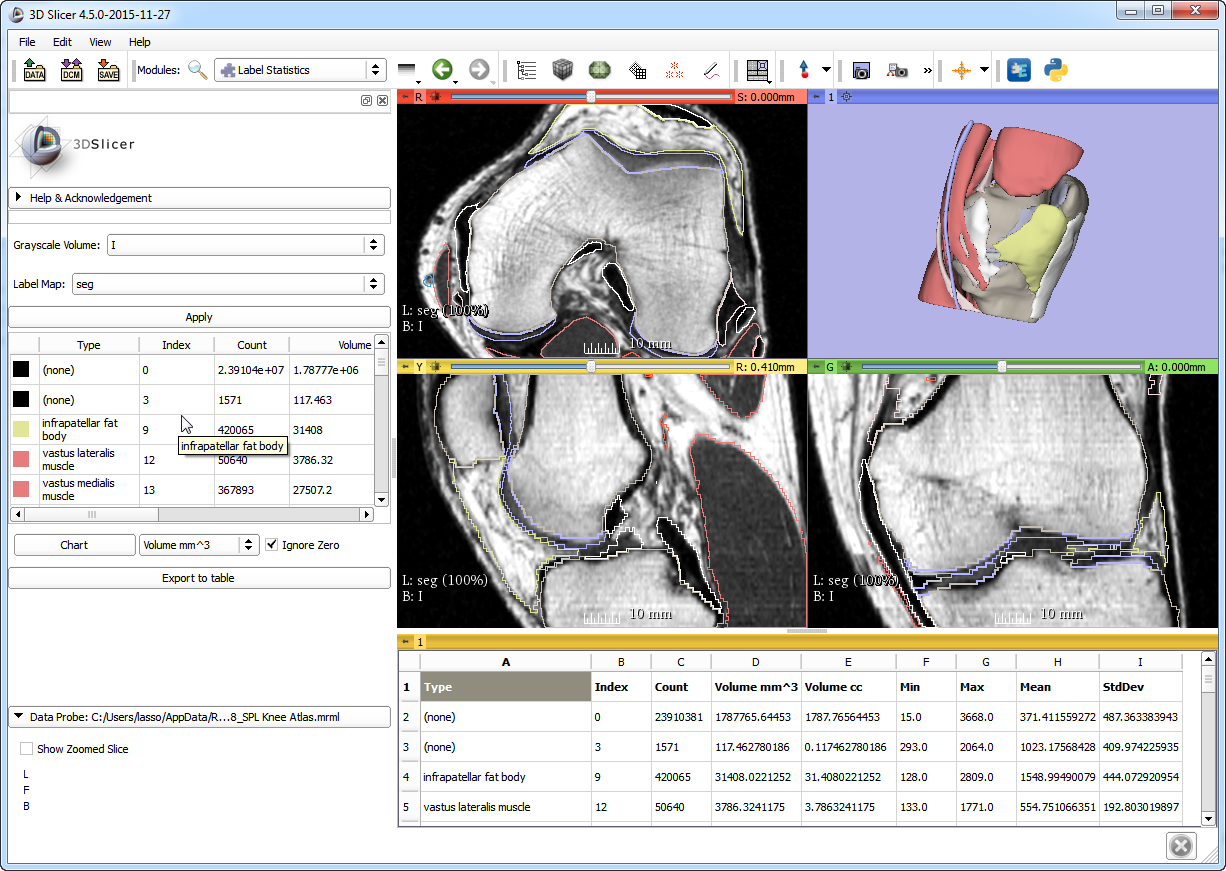
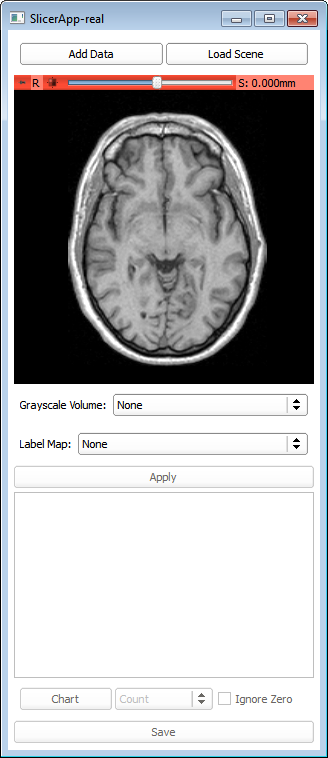
| 19:24, 16 August 2014 | LabelStatisticsSlicelet.png (file) |  |
468 KB | 1 | |
| 22:30, 14 September 2015 | BasicHeartView.png (file) |  |
460 KB | 1 | |
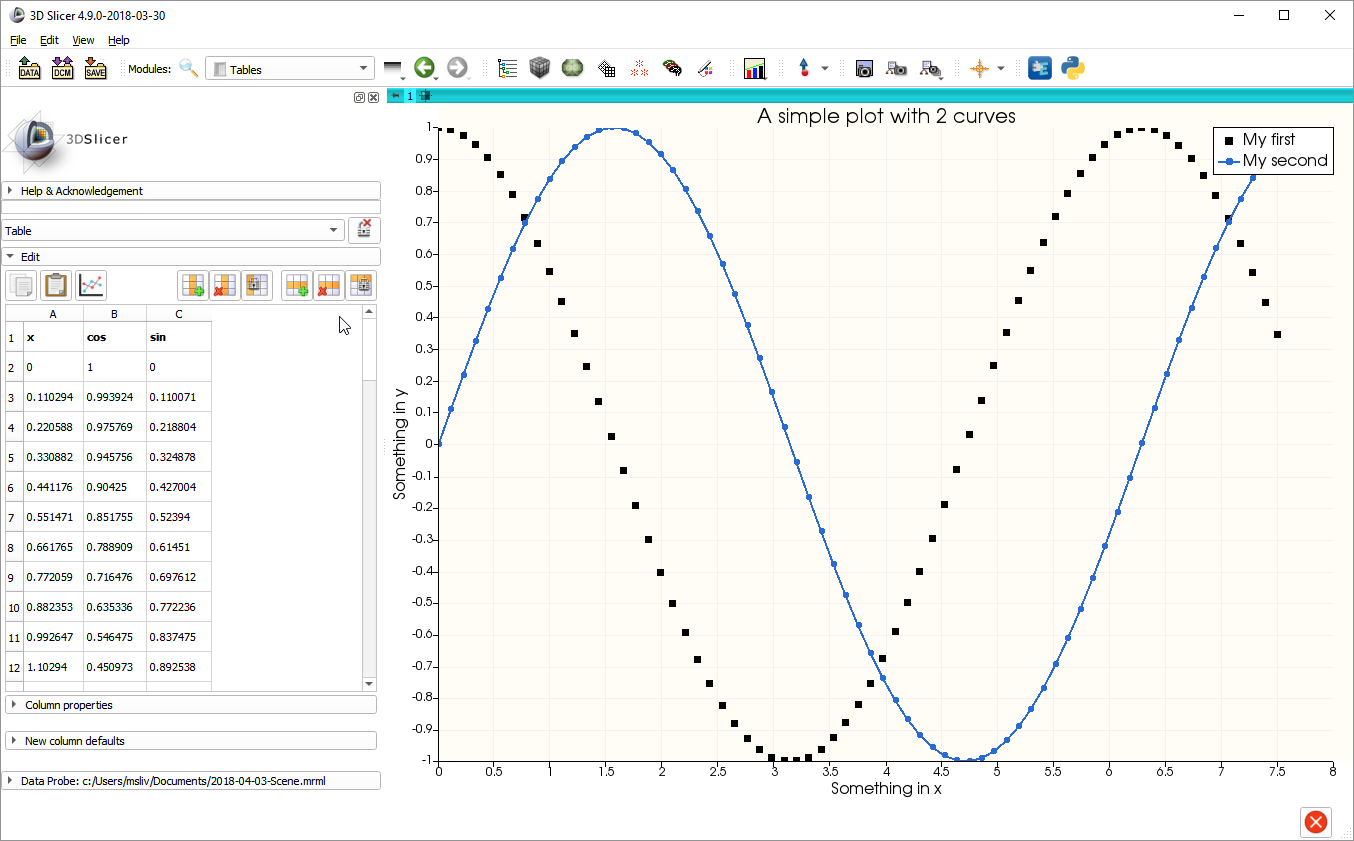
| 11:41, 1 December 2015 | Slicer45-Tables-TableView.png (file) |  |
444 KB | 1 | |
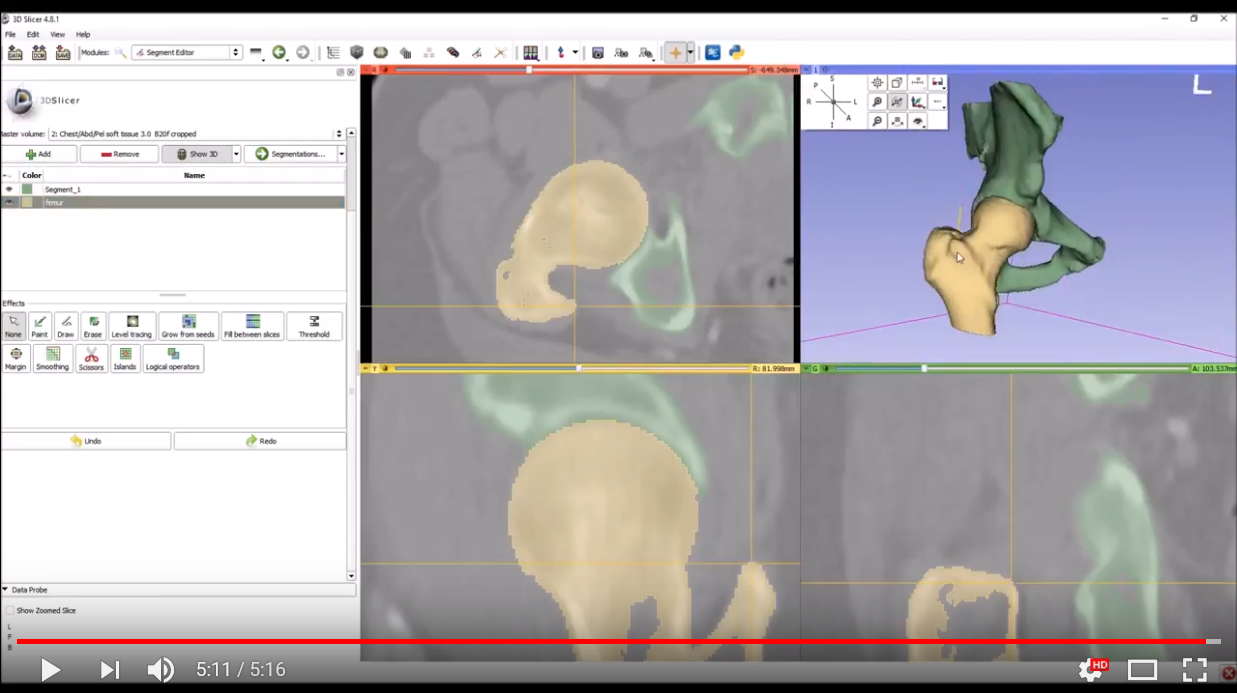
| 16:47, 22 January 2018 | FemurSegmentationYoutube.png (file) |  |
440 KB | 1 | |
| 20:59, 12 September 2016 | SlicerCaptureFade.gif (file) |  |
413 KB | 2 | |
| 04:53, 21 January 2014 | CardiacCtReplay.gif (file) |  |
389 KB | Replay of a cardiac CT study using the Multidimensional Data extension | 1 |
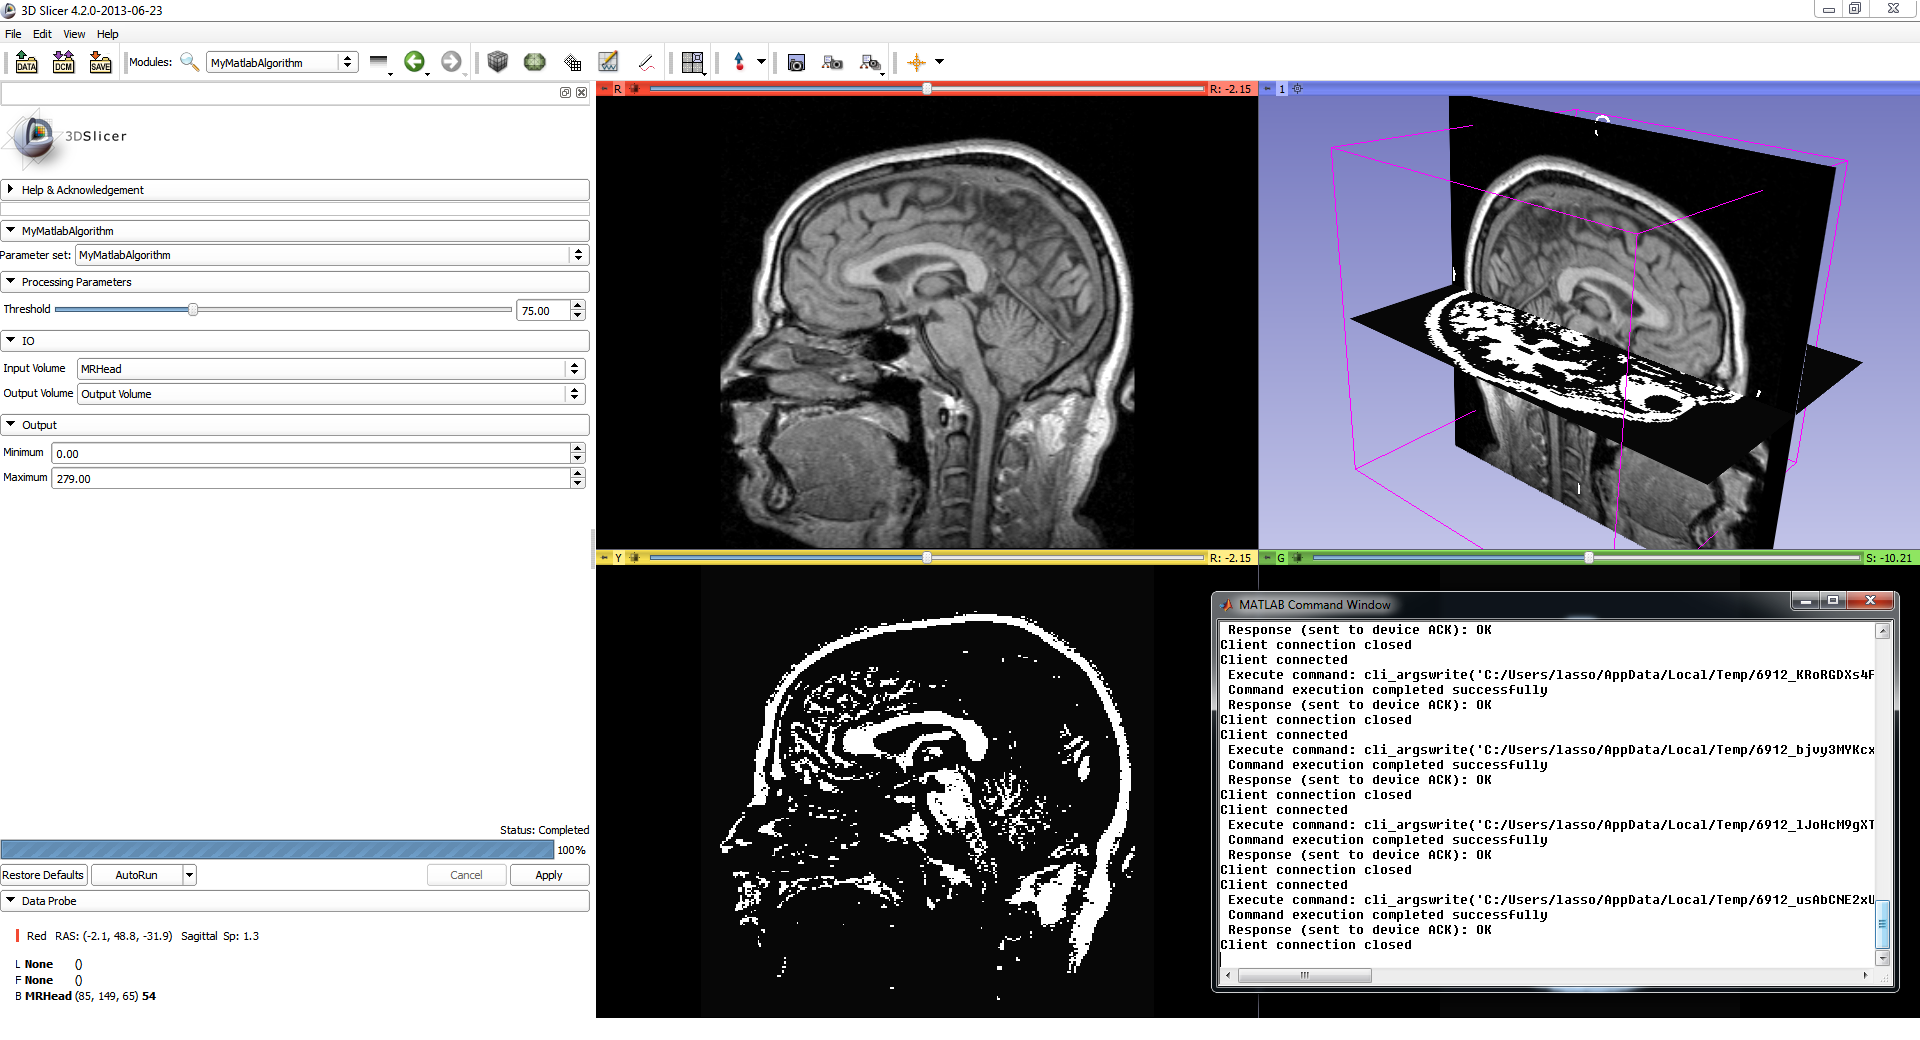
| 19:19, 24 June 2013 | MatlabBridgeScreenshot1.png (file) |  |
379 KB | Example of a Matlab module user interface as it appears in 3D Slicer. No programming is needed to create the user interface, as it is generated automatically from the command-line interface definition XML file. | 1 |
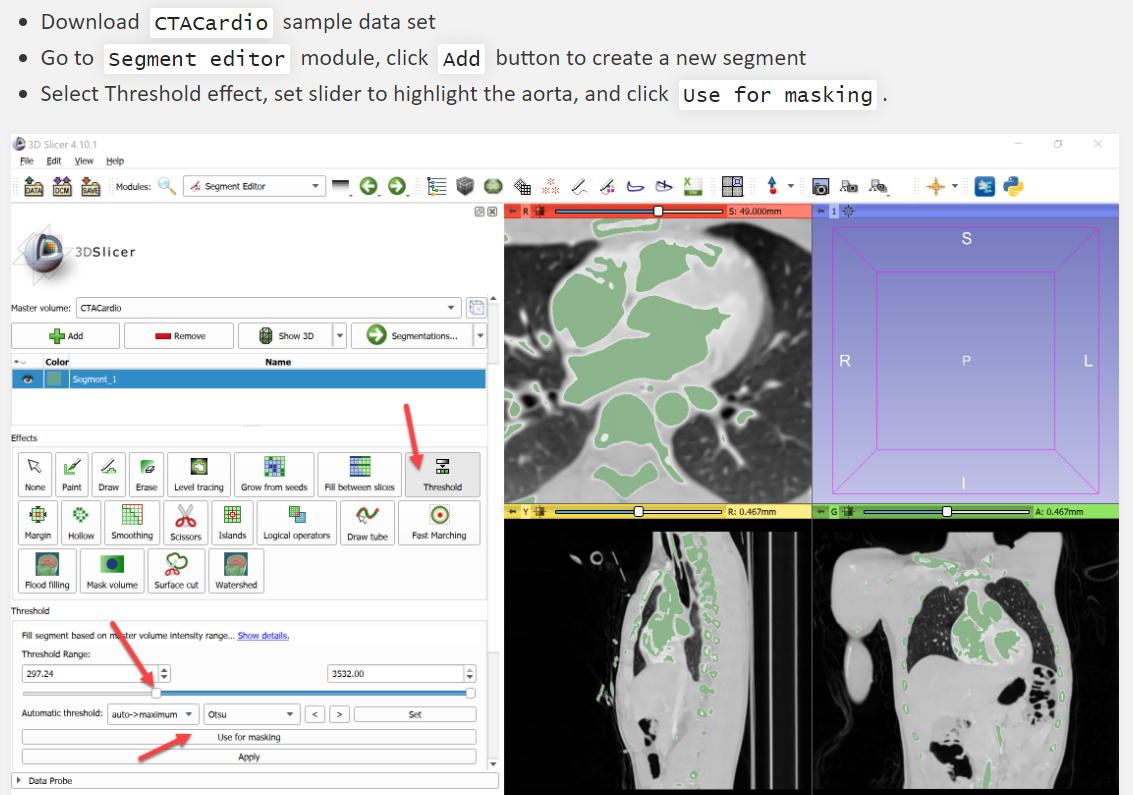
| 19:41, 11 December 2020 | SegmentationRecipes.png (file) |  |
376 KB | Screenshot from Segmentation Recipes website. https://lassoan.github.io/SlicerSegmentationRecipes/AortaMaskedGrowFromSeeds/ | 1 |
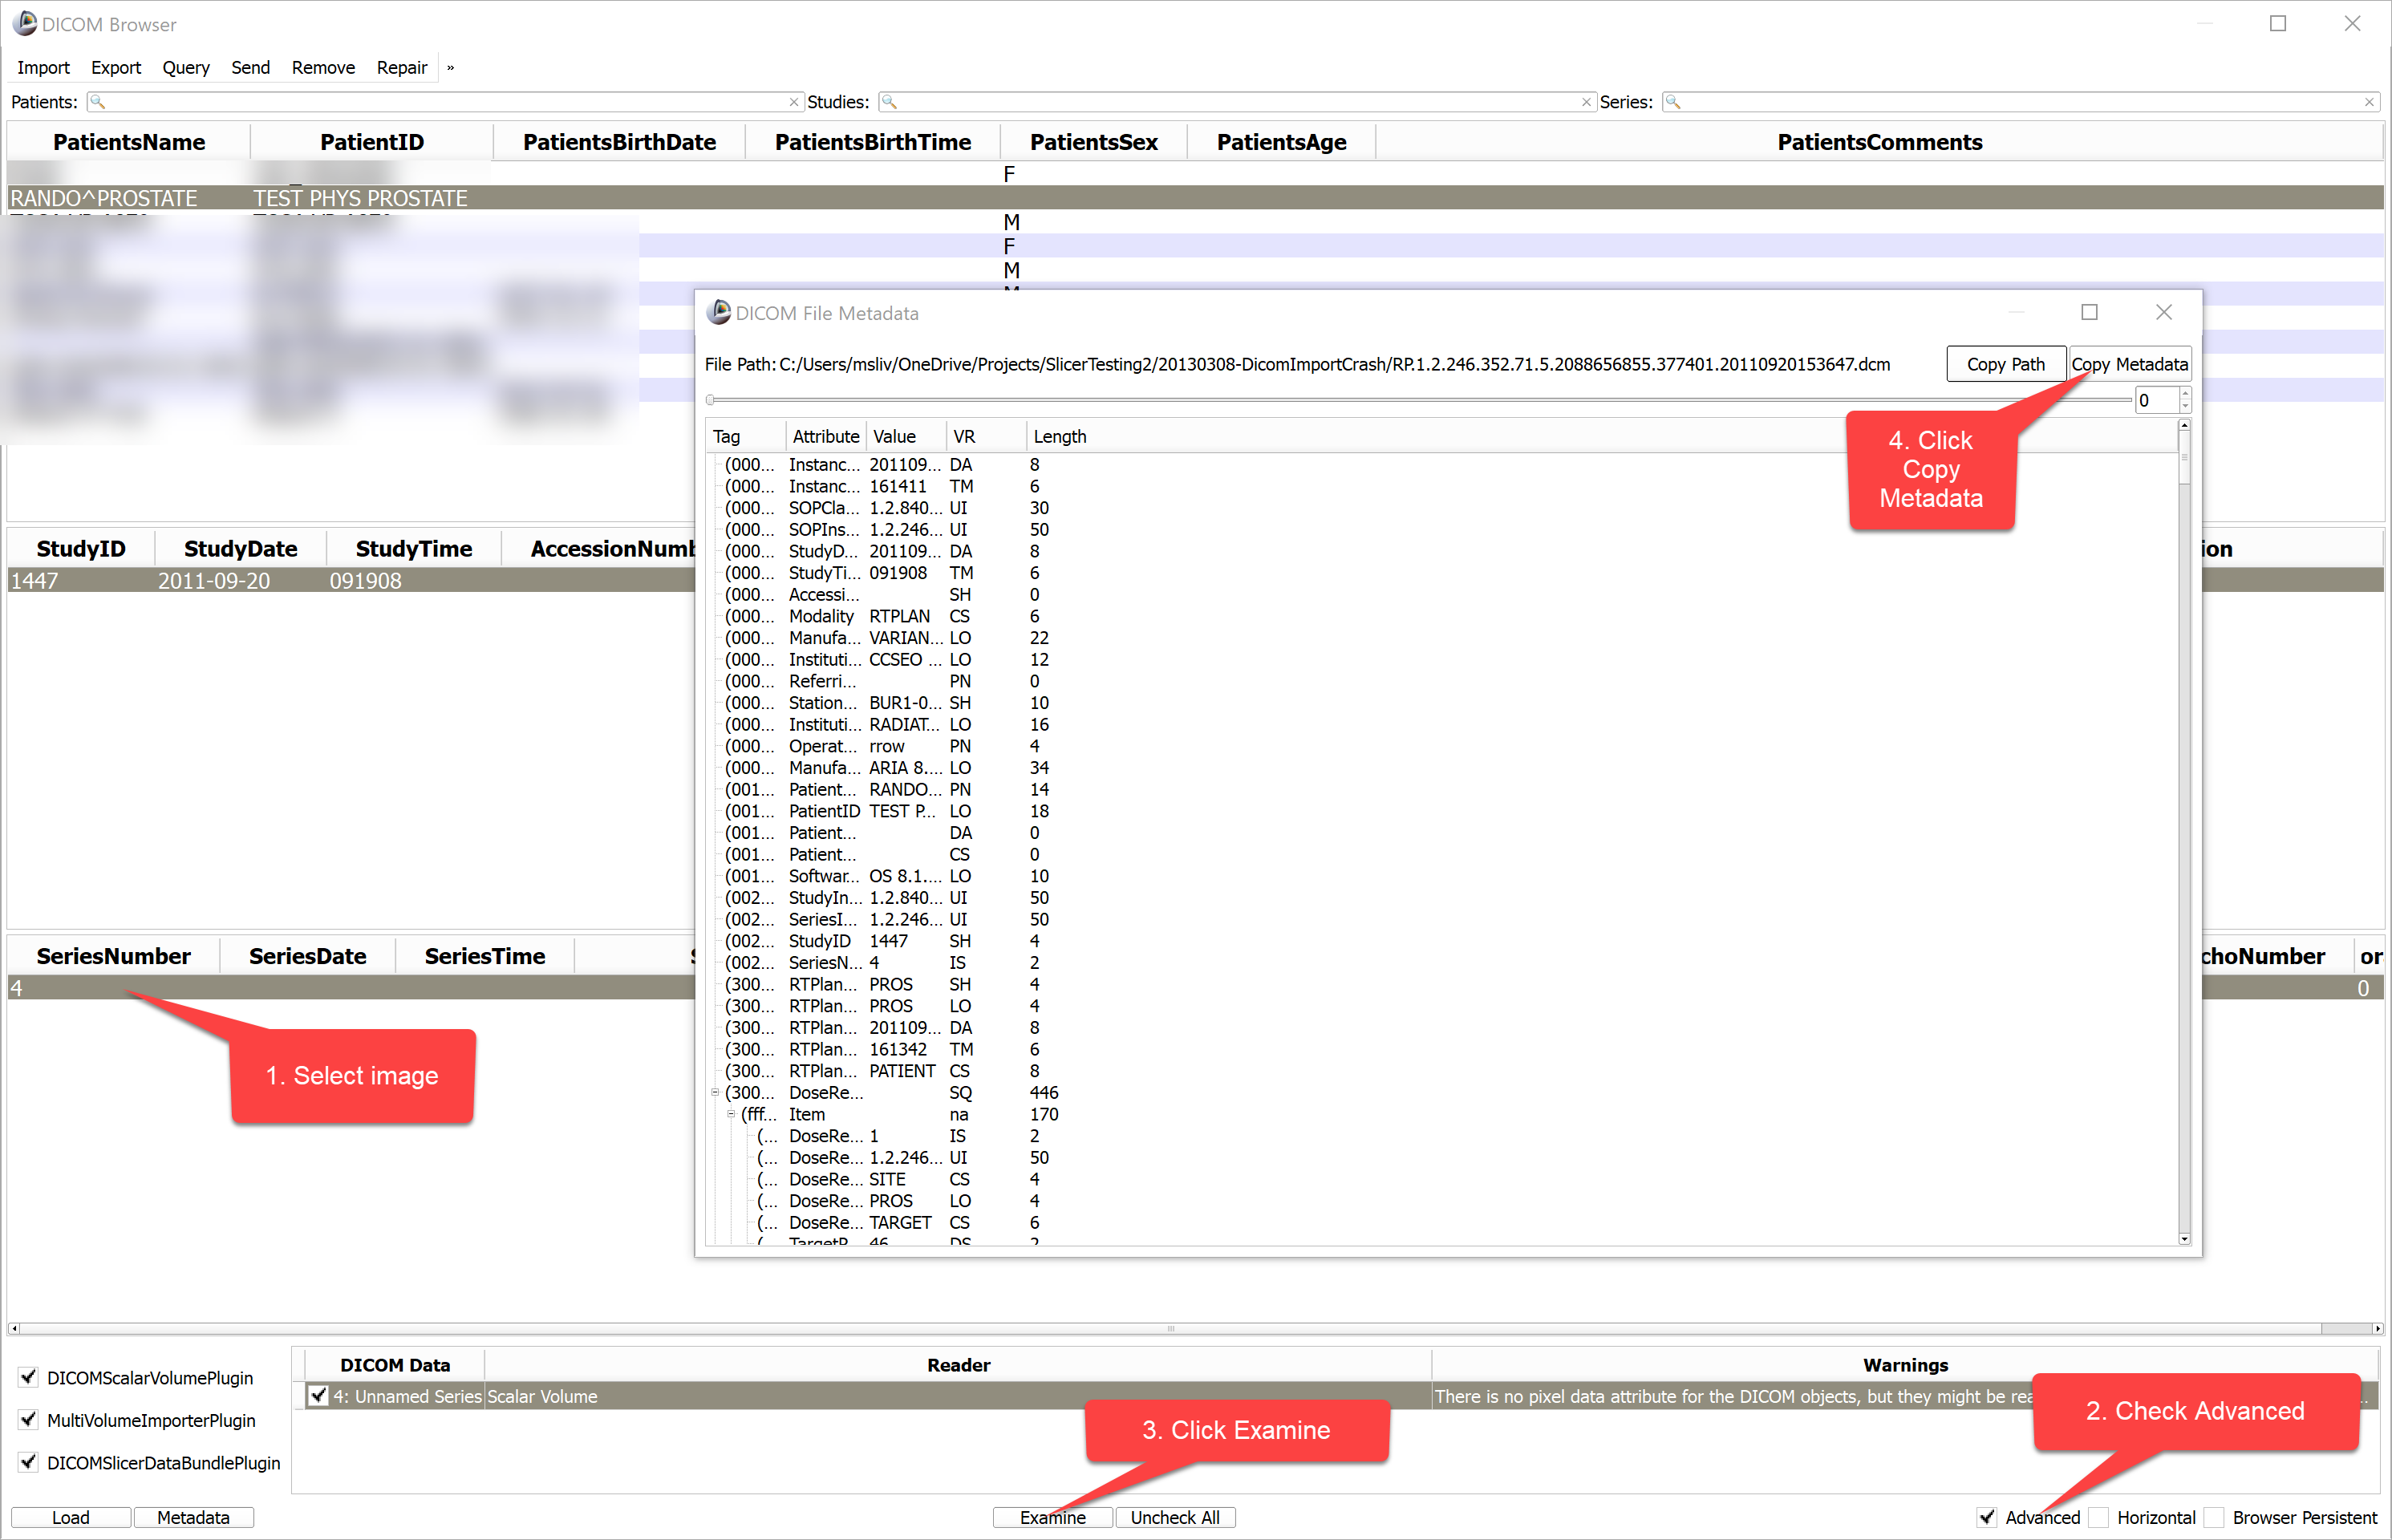
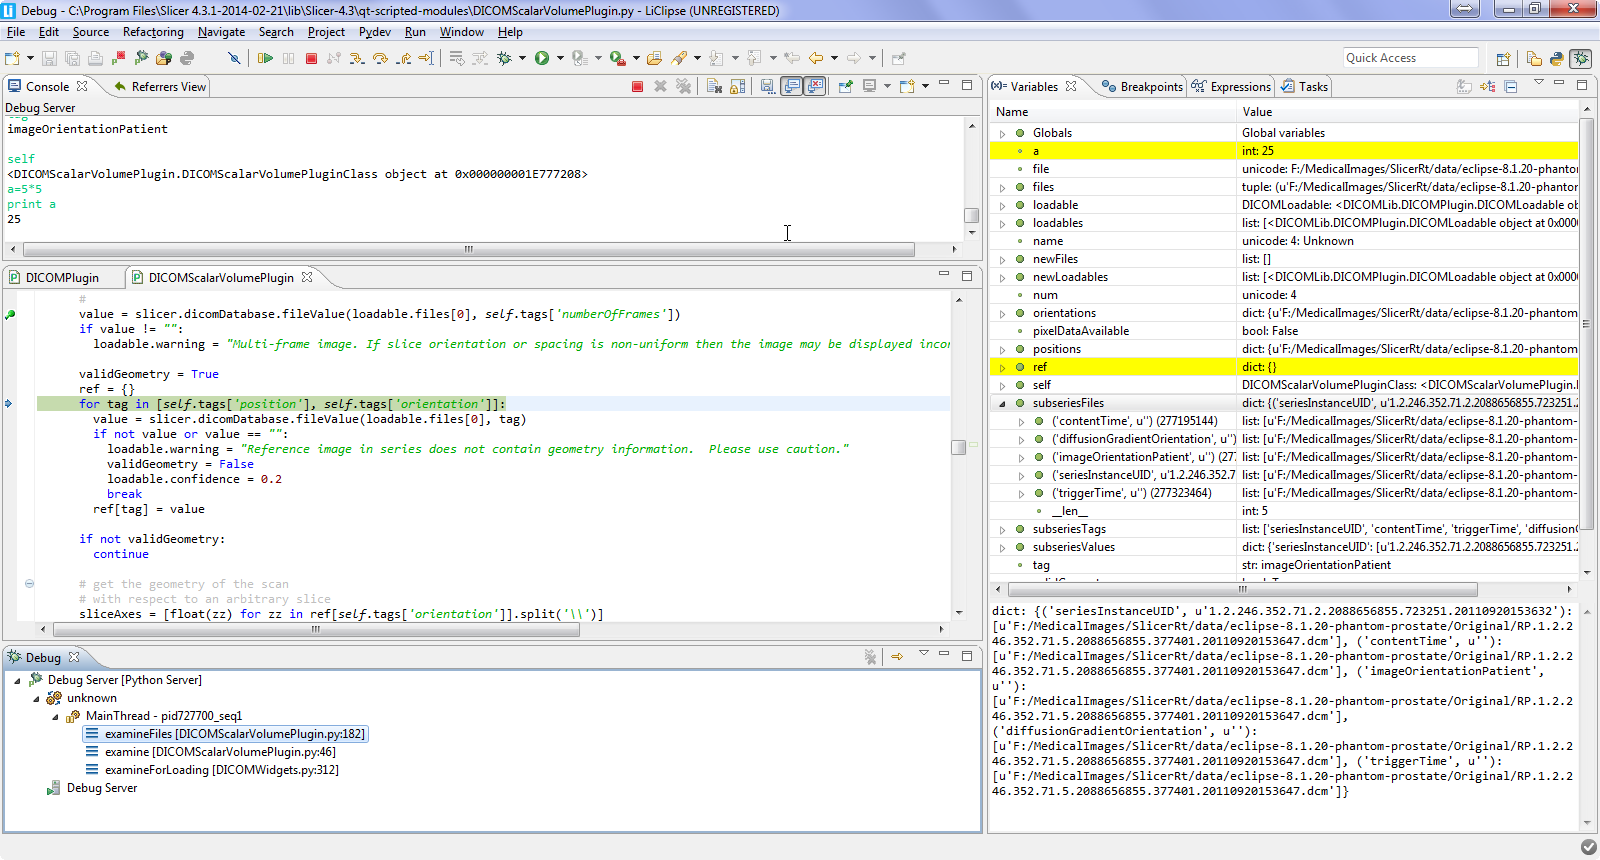
| 20:19, 29 November 2017 | DicomMetadataExamine.png (file) |  |
360 KB | 1 | |
| 17:32, 21 April 2017 | SlicerModulesProgrammingBeyondBasics.pptx (file) | 339 KB | Python scripted module design - beyond basics (role of widget, logic, MRML classes, using MRML node for storing module parameters, etc.) | 1 | |
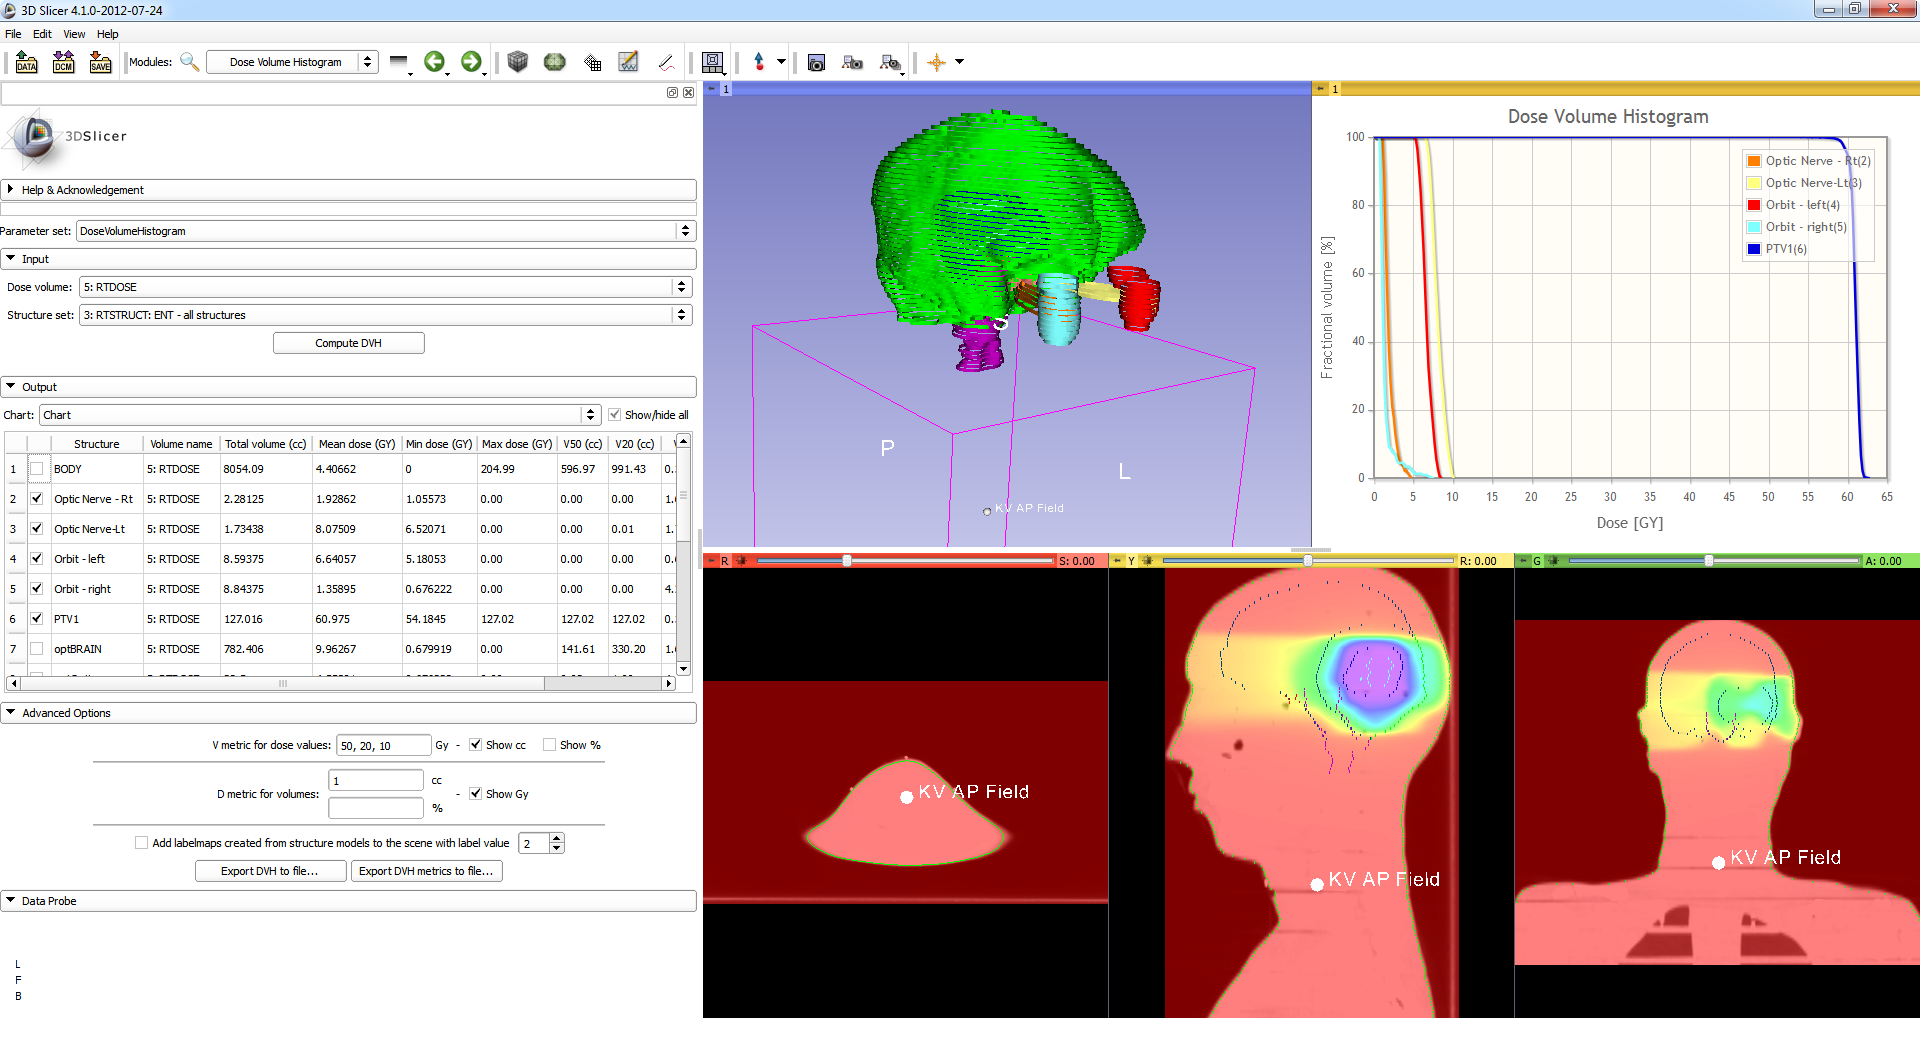
| 23:27, 24 July 2012 | SlicerRtDvh.png (file) |  |
296 KB | Screenshot of dose volume histogram computation using SlicerRT | 1 |
| 20:39, 12 September 2016 | SlicerCaptureSweep.gif (file) |  |
296 KB | Example of recording created by ScreenCapture module | 1 |
| 20:33, 12 September 2016 | SlicerCaptureRotation.gif (file) |  |
289 KB | Reverted to version as of 20:25, 12 September 2016 | 4 |
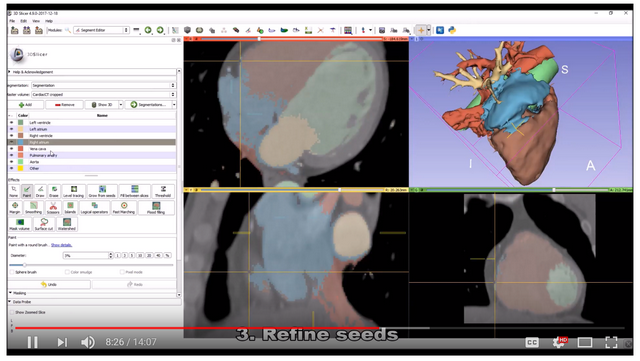
| 04:21, 27 December 2017 | WholeHeartSegYoutube.png (file) |  |
281 KB | 1 | |
| 14:28, 3 July 2019 | SliceletSimpleGUI.png (file) |  |
229 KB | Demonstration of simple user interface created by slicelet in https://github.com/lassoan/SlicerSimpleWorkflows/tree/master/QuickSegment | 1 |
| 18:22, 28 February 2014 | PyDevRemoteDebugSlicer.png (file) |  |
189 KB | Visual debugging of Python scripts within Slicer | 1 |
| 21:13, 12 September 2016 | SlicerCaptureSequence.gif (file) |  |
184 KB | Example of recording created by ScreenCapture module | 1 |
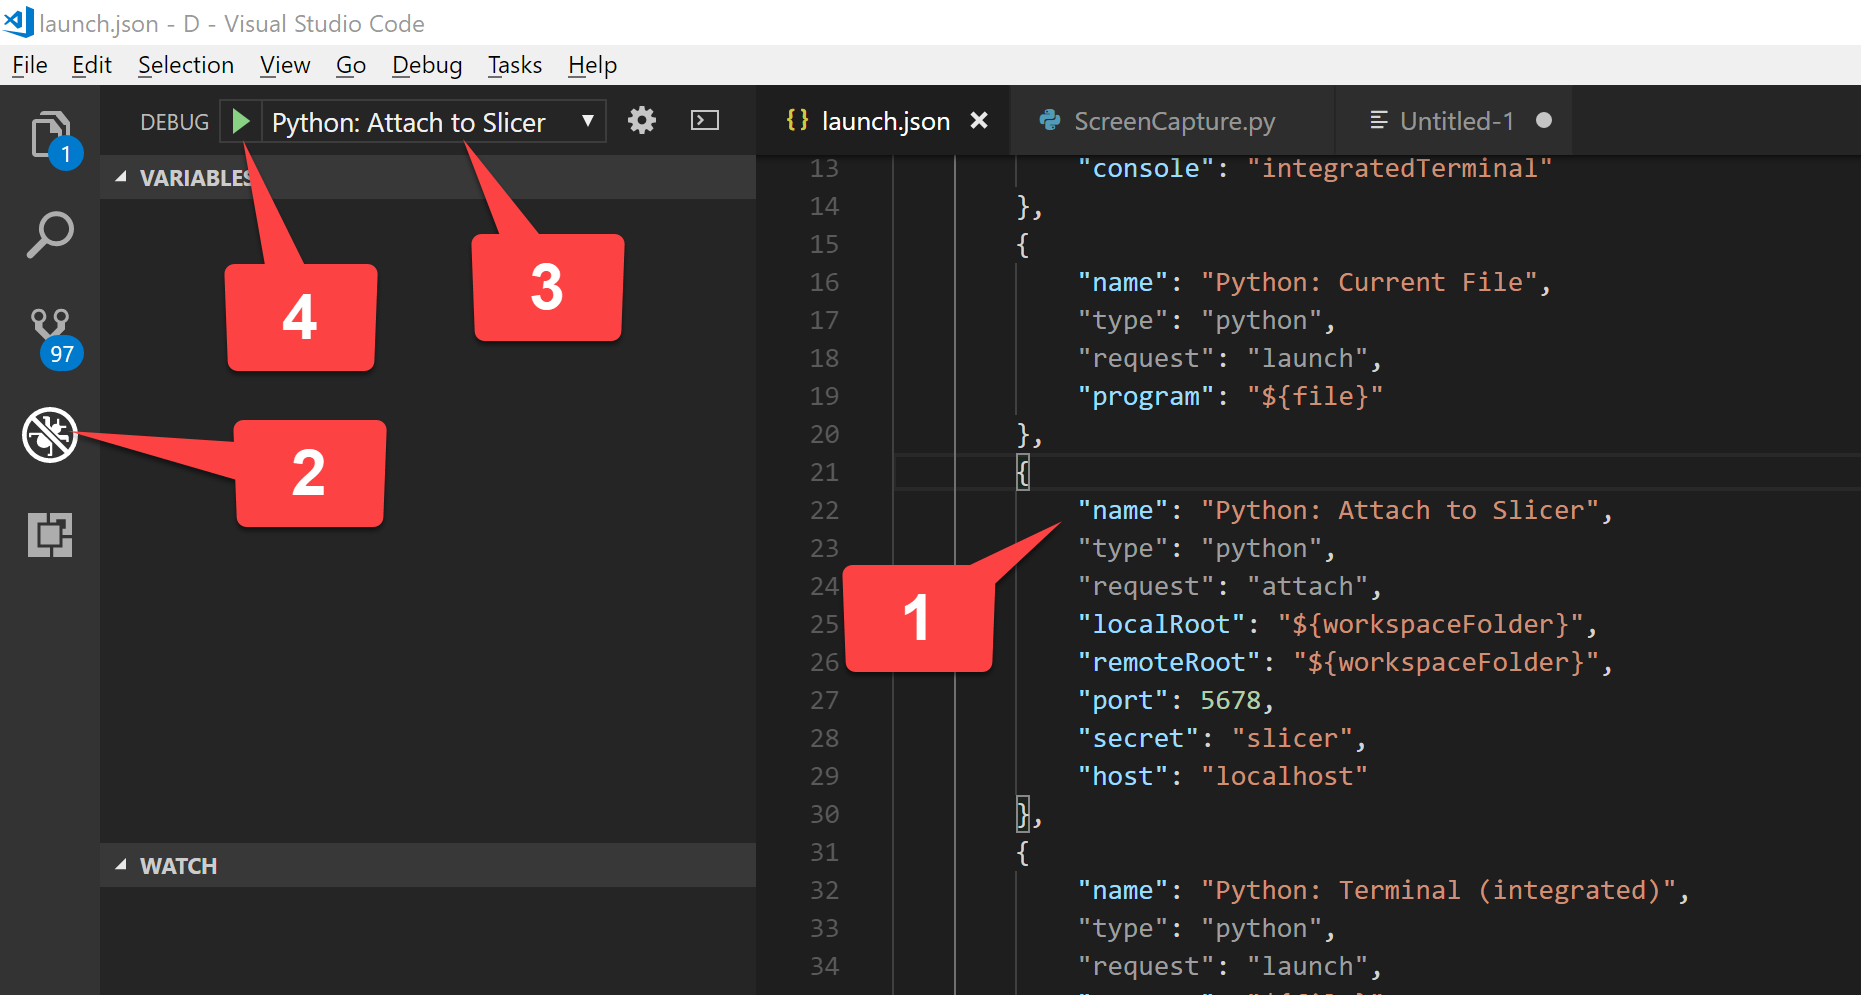
| 05:24, 25 May 2018 | VisualStudioCodePythonDebuggerSetup.png (file) |  |
167 KB | 1 | |
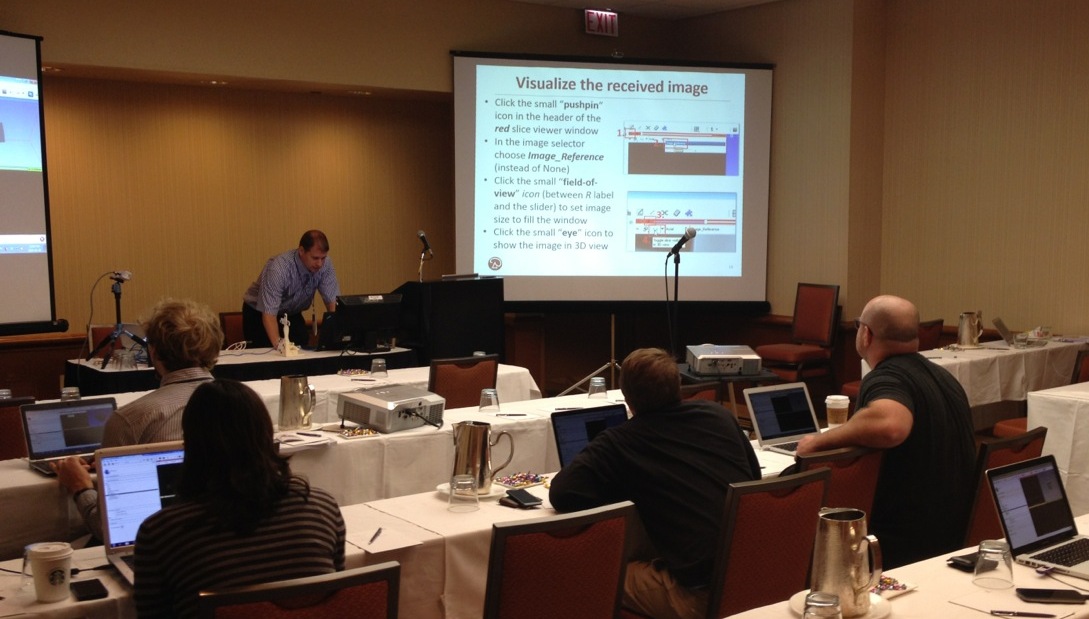
| 19:39, 27 August 2014 | 2014-08-26-SlicerIGT-EMBC2014Tutorial.png (file) |  |
155 KB | 2 | |
| 04:59, 21 January 2014 | ShapeModelSequenceBrowsing3dOnly.gif (file) |  |
150 KB | Visualzation of a model deformation using the Multidimensional Data extension | 1 |
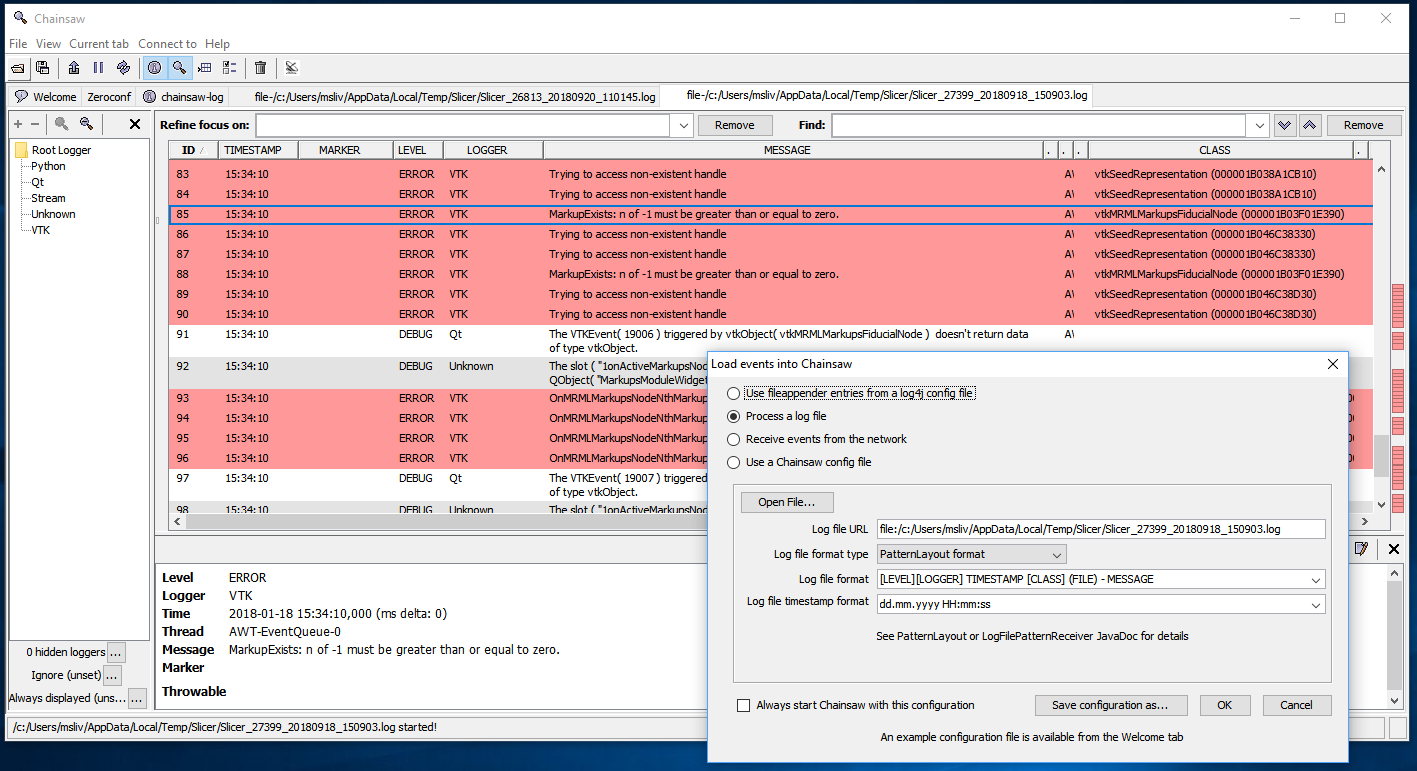
| 16:23, 25 September 2018 | ApacheChainsawLogAnalysis.png (file) |  |
134 KB | Screenshot of Slicer log analysis using http://logging.apache.org/chainsaw/2.x/ | 1 |
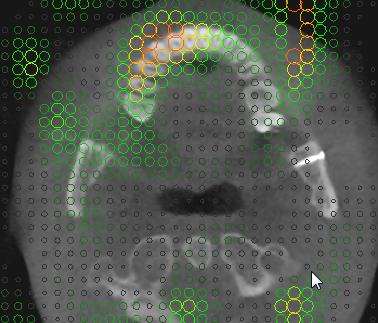
| 16:10, 17 April 2014 | GlyphSphere2d.png (file) |  |
114 KB | 2 | |
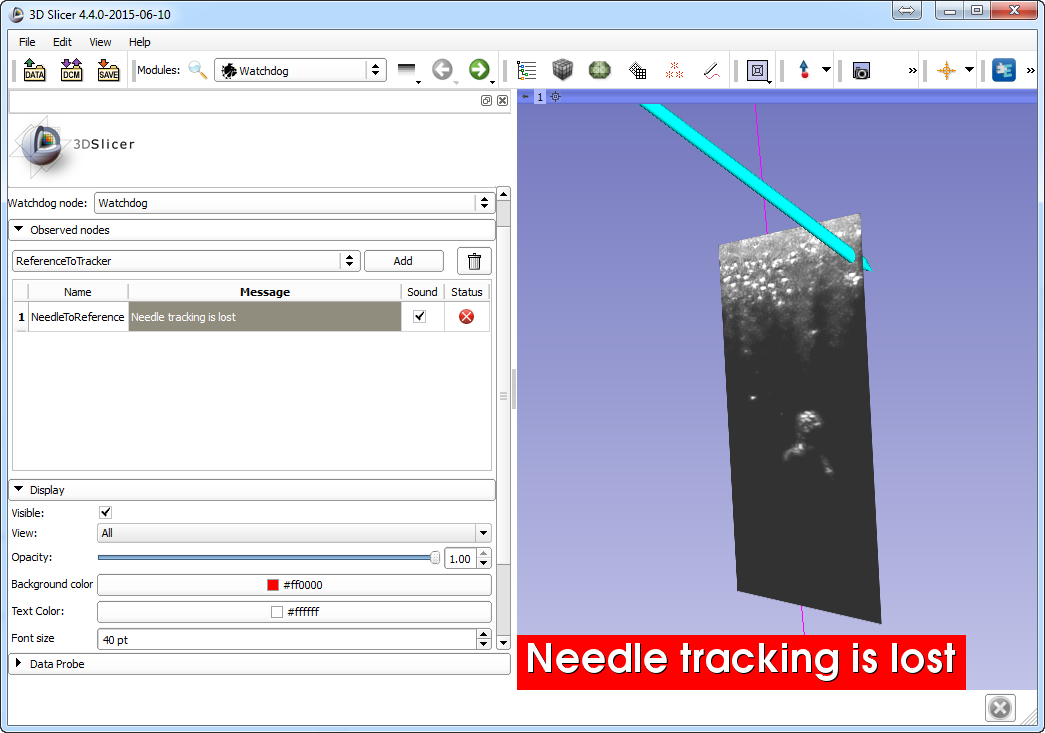
| 21:23, 12 June 2015 | Watchdog 01.png (file) |  |
112 KB | 1 | |
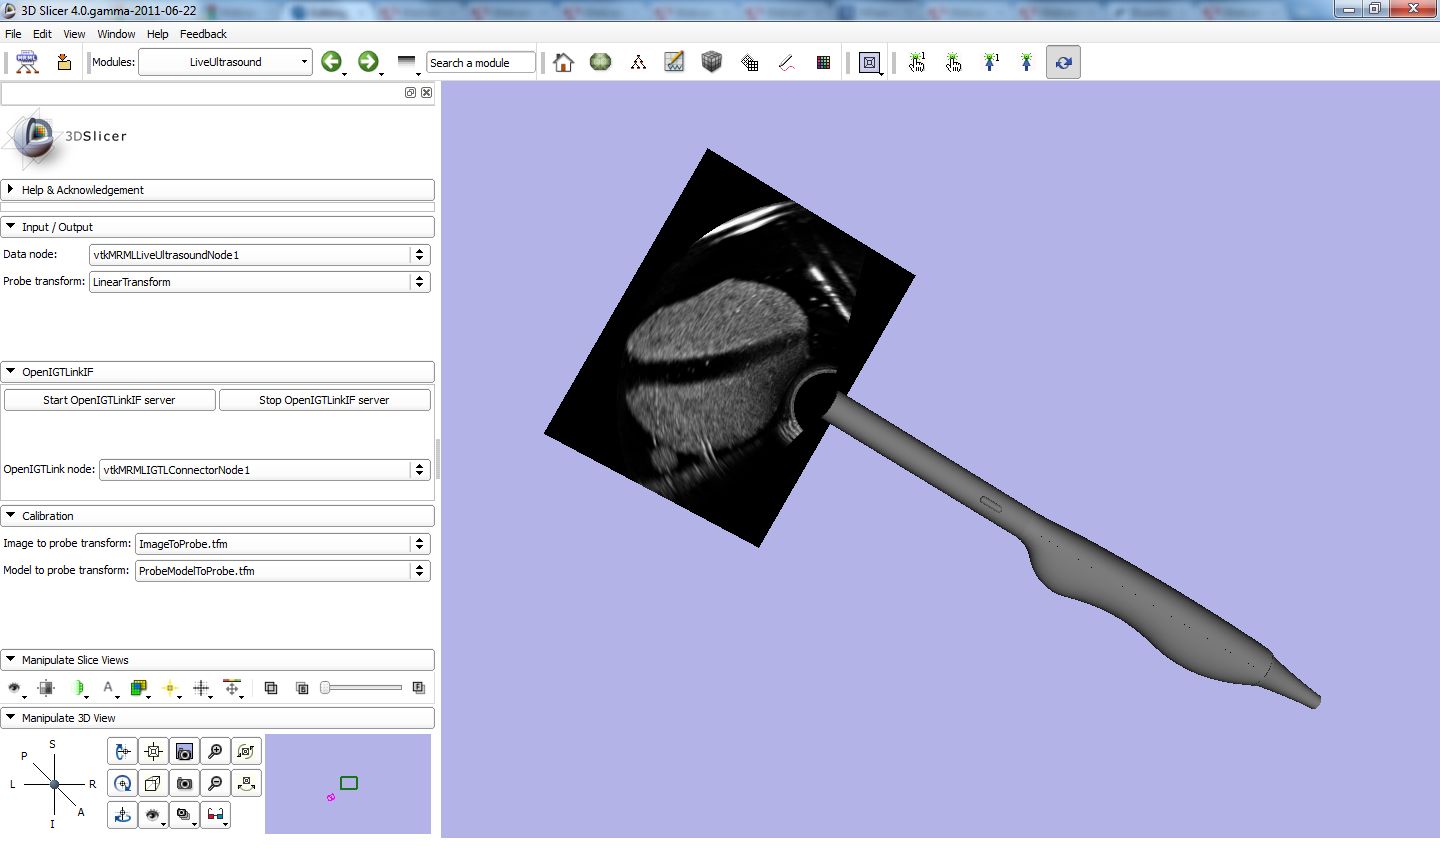
| 21:32, 12 November 2011 | LiveUltrasoundModule-Slicer4 2.jpg (file) |  |
100 KB | Screenshot of the Live ultrasound display module in Slicer4. See more details at http://www.na-mic.org/Wiki/index.php/2011_Summer_Project_Week_Live_Tracked_Ultrasound | 1 |
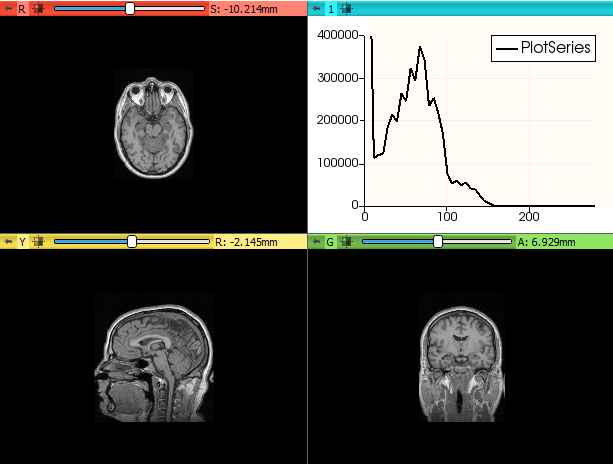
| 13:43, 6 April 2018 | VtkPlot.png (file) |  |
97 KB | Use scatter plot type | 3 |
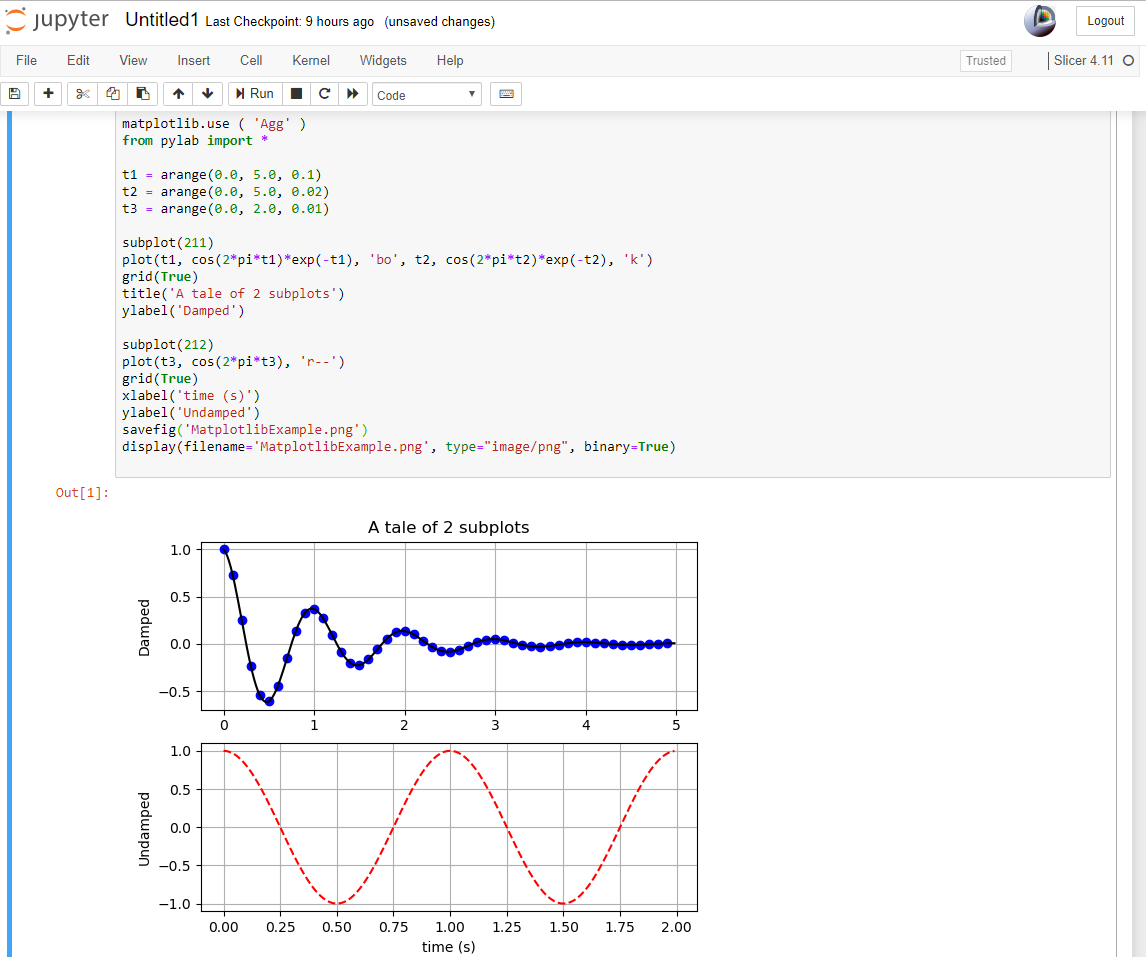
| 04:59, 7 September 2019 | JupyterNotebookMatplotlibExample.png (file) |  |
95 KB | 1 | |
| 13:53, 22 November 2018 | PerkLabSlicerProgrammingTutorial.png (file) |  |
92 KB | 1 | |
| 21:31, 12 November 2011 | LiveUltrasoundModule-Slicer4.jpg (file) |  |
87 KB | Screenshot of the Live ultrasound display module in Slicer4. See more details at http://www.na-mic.org/Wiki/index.php/2011_Summer_Project_Week_Live_Tracked_Ultrasound | 1 |
| 05:16, 7 September 2019 | SlicerPlot.png (file) |  |
79 KB | 1 | |
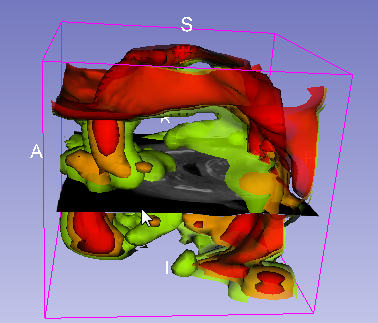
| 16:29, 17 April 2014 | Contour3dVolume.png (file) |  |
79 KB | Transform display: contour mode, in 3D, using a volume as region of interest | 1 |
| 16:08, 17 April 2014 | GlyphCone2d.png (file) |  |
75 KB | Transform display: glyph mode, cone type, in 2D | 1 |
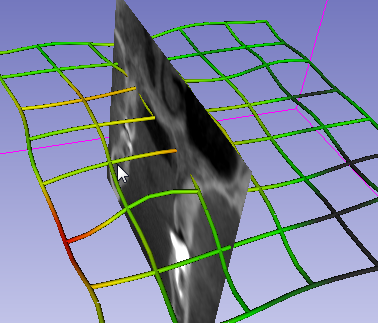
| 16:25, 17 April 2014 | Grid3dSlice.png (file) |  |
75 KB | Transform display: grid mode, in 3D, using a slice as region of interest | 1 |
| 16:20, 17 April 2014 | GlyphSphere3dVolume.png (file) |  |
72 KB | Transform display: glyph mode, sphere type, in 3D, using a volume as region of interest, only glyphs with a magnitudes in a specific range are displayed | 1 |
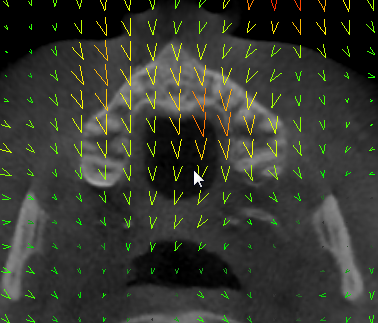
| 16:03, 17 April 2014 | GlyphArrow2d.png (file) |  |
71 KB | Transform display: glyph mode, arrow type, in 2D | 1 |
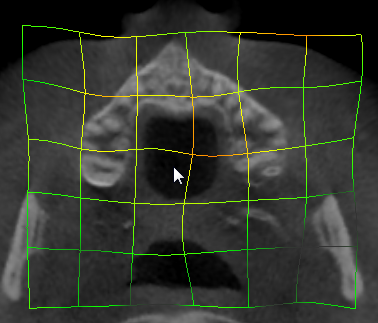
| 16:24, 17 April 2014 | Grid2d.png (file) |  |
67 KB | Transform display: grid mode, in 2D | 1 |
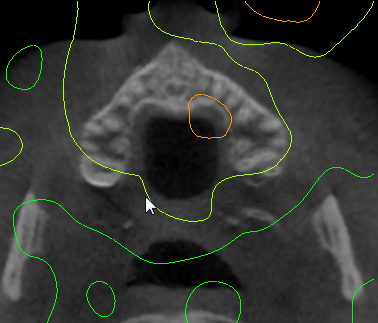
| 16:28, 17 April 2014 | Contour2d.png (file) |  |
67 KB | Transform display: contour mode, in 2D | 1 |
| 19:25, 16 August 2014 | SliceletSampleScreenshot.png (file) |  |
63 KB | 1 | |
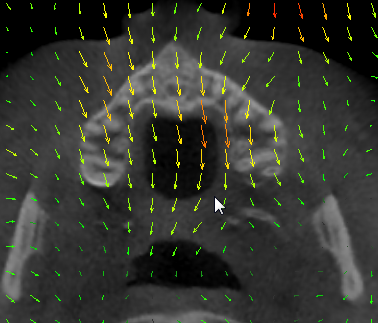
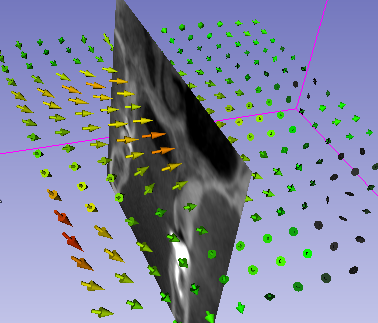
| 16:17, 17 April 2014 | GlyphArrow3dSlice.png (file) |  |
58 KB | Transform display: glyph mode, arrow type, in 3D, using a slice as region of interest | 1 |