Difference between revisions of "Documentation/Nightly/Modules/MultiVolumeExplorer"
m (Text replacement - "\[http:\/\/www\.slicer\.org\/slicerWiki\/images\/([^ ]+) ([^]]+)]" to "[http://www.slicer.org/w/img_auth.php/$1 $2]") |
|||
| (24 intermediate revisions by 4 users not shown) | |||
| Line 1: | Line 1: | ||
| − | {{ | + | <noinclude>{{documentation/versioncheck}}</noinclude> |
| − | |||
| − | |||
| − | |||
| − | |||
| − | |||
| − | |||
| − | |||
| − | |||
| − | }} | ||
<!-- ---------------------------- --> | <!-- ---------------------------- --> | ||
| Line 41: | Line 32: | ||
Most frequently used for these scenarios: | Most frequently used for these scenarios: | ||
* visualization of a DICOM dataset that contains multiple frames that can be separated based on some tag (e.g., DCE MRI data, where individual temporally resolved frames are identified by Trigger Time tag (0018,1060) | * visualization of a DICOM dataset that contains multiple frames that can be separated based on some tag (e.g., DCE MRI data, where individual temporally resolved frames are identified by Trigger Time tag (0018,1060) | ||
| − | * visualization of multiple frames defined in the same coordinate frame, saved as individual volumes in NRRD, NIfTI, or any other [[Documentation/ | + | * visualization of multiple frames defined in the same coordinate frame, saved as individual volumes in NRRD, NIfTI, or any other [[Documentation/{{documentation/version}}/SlicerApplication/SupportedDataFormat|image format supported by 3D Slicer]] |
* exploration of the multivolume data (cine mode visualization, plotting, volume rendering) | * exploration of the multivolume data (cine mode visualization, plotting, volume rendering) | ||
| − | |||
<!-- ---------------------------- --> | <!-- ---------------------------- --> | ||
{{documentation/{{documentation/version}}/module-section|Tutorials}} | {{documentation/{{documentation/version}}/module-section|Tutorials}} | ||
| − | + | {|style="width: 100%" | |
| + | | | ||
| + | [[Image:MultiVolumeExplorer_youtube_demo.png| 435px |link=http://www.youtube.com/watch?v=zqZIx77Z4VI]] | ||
| + | | | ||
| + | * [http://youtu.be/zqZIx77Z4VI Screencast tutorial] | ||
* Sample datasets are available: | * Sample datasets are available: | ||
| − | ** [http:// | + | ** Anonymized prostate DCE MRI DICOM series: |
| + | *** [http://www.slicer.org/w/img_auth.php/5/56/Case1_DCE.tgz tgz version] | ||
| + | *** [http://www.slicer.org/w/img_auth.php/c/c2/DCE_series.zip zip version] | ||
| + | *** The same series saved in MultiVolume-specific 4d NRRD format using Slicer: [[File:DCE_series.nrrd.zip]] | ||
** [[File:Cardiac_ECGg_CT.tgz]] (ECG-gated contrast-enhanced cardiac CT) (use "User-defined non-DICOM" parameter option to load it into MultiVolumeImporter). Short [[media:BeatingHeart.mov|movie]] | ** [[File:Cardiac_ECGg_CT.tgz]] (ECG-gated contrast-enhanced cardiac CT) (use "User-defined non-DICOM" parameter option to load it into MultiVolumeImporter). Short [[media:BeatingHeart.mov|movie]] | ||
| + | *Tutorial: Meysam Torabi and Andrey Fedorov, [http://www.slicer.org/w/img_auth.php/8/8d/MultiVolumeExplorer_Meysam_SNR-April2013-v4.pdf Exploration and Study of MultiVolume Image Data using 3D Slicer] | ||
| + | |} | ||
| + | {{#ev:youtube|zqZIx77Z4VI}} | ||
<!-- ---------------------------- --> | <!-- ---------------------------- --> | ||
{{documentation/{{documentation/version}}/module-section|Panels and their use}} | {{documentation/{{documentation/version}}/module-section|Panels and their use}} | ||
| − | MultiVolume | + | '''Input data''' Before the module can be used, you should import the data into a MultiVolume node that you can choose as input in this module. There are two options to do this: |
| − | + | # If your data is in DICOM format, you should first import it into Slicer DICOM database using [[Documentation/{{documentation/version}}/Modules/DICOM|DICOM]] module. Once imported, you should click on the series containing the multi-frame data in the DICOM browser. If DICOM module detects multi-frame dataset in the series, you should see the MultiVolume option in the list of load options for the series. | |
| − | + | # If your data is stored as a collection of NRRD/NIFTI/etc volumes per time-point, you should use [[Documentation/{{documentation/version}}/Modules/MultiVolumeImporter|MultiVolume Importer]] module to first create a MultiVolume node from your file collection, and then use the resulting MultiVolume node as input for the Explorer module. | |
{|style="width: 100%" | {|style="width: 100%" | ||
| Line 68: | Line 68: | ||
** ''Current frame copy'': you can create and select a conventional scalar volume node in this selector. If ''Enable current frame copying'' button is pressed, each time the currently shown frame is updated, it will be copied to the volume selected. This is useful in situations when you want to do processing of an individual frame (e.g., segmentation), or if you want to show volume rendering of the currently active frame. | ** ''Current frame copy'': you can create and select a conventional scalar volume node in this selector. If ''Enable current frame copying'' button is pressed, each time the currently shown frame is updated, it will be copied to the volume selected. This is useful in situations when you want to do processing of an individual frame (e.g., segmentation), or if you want to show volume rendering of the currently active frame. | ||
* '''Plotting''': there are two modes of plotting that are supported by the module: | * '''Plotting''': there are two modes of plotting that are supported by the module: | ||
| − | ** ''Interactive plotting'': this mode of plotting is enabled by default and is facilitated by the chart area located in the ''Plotting'' panel. When enabled, the chart will display the intensity values at the spatial location defined by the current position of the mouse pointer. This mode can be disable from the ''Plotting'' GUI panel. | + | ** ''Interactive plotting'': this mode of plotting is enabled by default and is facilitated by the chart area located in the ''Plotting'' panel. When enabled, the chart will display the intensity values at the spatial location defined by the current position of the mouse pointer. This mode can be disable from the ''Plotting'' GUI panel. The range of the Y axis can be either fixed to the maximum intensity over all of the voxels/all frames of the dataset (if the fixed axis extent checkbox is selected), or otherwise will be adjusted dynamically to the signal range of the probed voxel curve. |
| − | ** ''Static plotting'': This mode of plotting is enabled by the [[Documentation/ | + | ** ''Static plotting'': This mode of plotting is enabled by the [[Documentation/{{documentation/version}}/SlicerApplication/MainApplicationGUI#Chart_Viewers | Charts]] infrastructure of Slicer, which is exposed in any of the ''Quantitive layouts''. To use this mode, follow these steps: |
**# Extract a representative frame from your multivolume dataset, as discussed above. | **# Extract a representative frame from your multivolume dataset, as discussed above. | ||
| − | **# Use the [[Documentation/ | + | **# Use the [[Documentation/{{documentation/version}}/Modules/Editor|Editor]] module to create labels for the regions of interest. |
**# Select the prepared label volume in the ''Probed label volume'' selector in the ''Plotting'' panel. The ''Charts'' viewer in the Slicer Quantitative layout will be updated with the average intensity values for each of the contoured ROIs. The colors of the plots will be the same as the colors of ROI labels. | **# Select the prepared label volume in the ''Probed label volume'' selector in the ''Plotting'' panel. The ''Charts'' viewer in the Slicer Quantitative layout will be updated with the average intensity values for each of the contoured ROIs. The colors of the plots will be the same as the colors of ROI labels. | ||
| | | | ||
| align="right" | | | align="right" | | ||
| | | | ||
| − | [[Image:Slicer4- | + | [[Image:Slicer4-MultiVolumeExplorer_4.2.png|thumb|400px|Settings panel and interactive plotting chart]] |
|} | |} | ||
| Line 88: | Line 88: | ||
<!-- ---------------------------- --> | <!-- ---------------------------- --> | ||
{{documentation/{{documentation/version}}/module-section|Related Modules}} | {{documentation/{{documentation/version}}/module-section|Related Modules}} | ||
| − | Before multivolume data can be viewed/explored, it has to be loaded using [[Documentation/ | + | Before multivolume data can be viewed/explored, it has to be loaded using either [[Documentation/{{documentation/version}}/Modules/DICOM|DICOM]] (if the dataset is in DICOM format) or [[Documentation/{{documentation/version}}/Modules/MultiVolumeImporter|MultVolumeImporter]] modules. |
| + | |||
| + | [[Documentation/Nightly/Modules/PkModeling]] extension can be used for pharmacokinetic analysis of the DCE MRI data. | ||
<!-- ---------------------------- --> | <!-- ---------------------------- --> | ||
| Line 97: | Line 99: | ||
{{documentation/{{documentation/version}}/module-section|Information for Developers}} | {{documentation/{{documentation/version}}/module-section|Information for Developers}} | ||
This module is an external Slicer module. The source code is available on Github here: https://github.com/fedorov/MultiVolumeExplorer | This module is an external Slicer module. The source code is available on Github here: https://github.com/fedorov/MultiVolumeExplorer | ||
| − | |||
| − | |||
| − | |||
| − | |||
| − | |||
| − | |||
| − | |||
| − | |||
| − | |||
| − | |||
| − | |||
==Features to be implemented== | ==Features to be implemented== | ||
| − | |||
* allow the user to speed-up or slow-down the playback, and also turn off "loop" | * allow the user to speed-up or slow-down the playback, and also turn off "loop" | ||
* report to the user the actual, measured, frame rate | * report to the user the actual, measured, frame rate | ||
| − | |||
==Features under consideration== | ==Features under consideration== | ||
* can we use chart viewer for interactive plotting? -- Discussed with Jim, speedup is possible, but not a priority right now | * can we use chart viewer for interactive plotting? -- Discussed with Jim, speedup is possible, but not a priority right now | ||
| − | |||
* interactive update of the active frame based on the point selected in the chart viewer | * interactive update of the active frame based on the point selected in the chart viewer | ||
| − | |||
* add GUI elements to update the current frame at the exact time intervals specified in multivolume. If the intervals are non-uniform, I am not sure I can use the timer anymore, so this would require some extra thought. | * add GUI elements to update the current frame at the exact time intervals specified in multivolume. If the intervals are non-uniform, I am not sure I can use the timer anymore, so this would require some extra thought. | ||
* import multivolumes from ITK 4d images | * import multivolumes from ITK 4d images | ||
| − | |||
| − | |||
<!-- ---------------------------- --> | <!-- ---------------------------- --> | ||
{{documentation/{{documentation/version}}/module-footer}} | {{documentation/{{documentation/version}}/module-footer}} | ||
<!-- ---------------------------- --> | <!-- ---------------------------- --> | ||
Revision as of 12:40, 27 November 2019
Home < Documentation < Nightly < Modules < MultiVolumeExplorer
|
For the latest Slicer documentation, visit the read-the-docs. |
Introduction and Acknowledgements
|
This work is supported by NA-MIC, NAC, NCIGT, and the Slicer Community. This work is partially supported by the following grants: P41EB015898, P41RR019703, R01CA111288 and U01CA151261. | |||||||||||
|


Module Description
This module provides support for exploring multivolume (multiframe) data.
Use Cases
Most frequently used for these scenarios:
- visualization of a DICOM dataset that contains multiple frames that can be separated based on some tag (e.g., DCE MRI data, where individual temporally resolved frames are identified by Trigger Time tag (0018,1060)
- visualization of multiple frames defined in the same coordinate frame, saved as individual volumes in NRRD, NIfTI, or any other image format supported by 3D Slicer
- exploration of the multivolume data (cine mode visualization, plotting, volume rendering)
Tutorials
|
|
|
Panels and their use
Input data Before the module can be used, you should import the data into a MultiVolume node that you can choose as input in this module. There are two options to do this:
- If your data is in DICOM format, you should first import it into Slicer DICOM database using DICOM module. Once imported, you should click on the series containing the multi-frame data in the DICOM browser. If DICOM module detects multi-frame dataset in the series, you should see the MultiVolume option in the list of load options for the series.
- If your data is stored as a collection of NRRD/NIFTI/etc volumes per time-point, you should use MultiVolume Importer module to first create a MultiVolume node from your file collection, and then use the resulting MultiVolume node as input for the Explorer module.
|

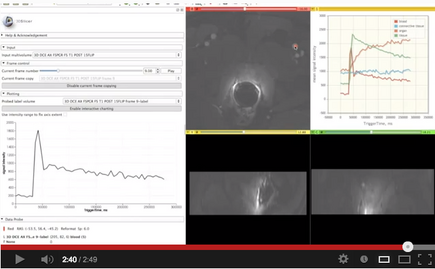
 Illustration of the static plotting from the explorer module. Note the label overlay in slice viewer with the ROIs corresponding to the femoral artery and an area in the prostate peripheral zone (blue arrow). The label corresponds to the segmentation done for the extracted volume of the 17th frame of the multivolume (green arrow). The same label is selected in the Plotting panel of the module. The corresponding colors are assigned to the plots in the Chart viewer in the layout (yellow arrow). |
Related Modules
Before multivolume data can be viewed/explored, it has to be loaded using either DICOM (if the dataset is in DICOM format) or MultVolumeImporter modules.
Documentation/Nightly/Modules/PkModeling extension can be used for pharmacokinetic analysis of the DCE MRI data.
References
- Development of this module was initiated at the 2012 NA-MIC Project week at SLC (see http://wiki.na-mic.org/Wiki/index.php/2012_Project_Week:4DImageSlicer4)
Information for Developers
This module is an external Slicer module. The source code is available on Github here: https://github.com/fedorov/MultiVolumeExplorer
Features to be implemented
- allow the user to speed-up or slow-down the playback, and also turn off "loop"
- report to the user the actual, measured, frame rate
Features under consideration
- can we use chart viewer for interactive plotting? -- Discussed with Jim, speedup is possible, but not a priority right now
- interactive update of the active frame based on the point selected in the chart viewer
- add GUI elements to update the current frame at the exact time intervals specified in multivolume. If the intervals are non-uniform, I am not sure I can use the timer anymore, so this would require some extra thought.
- import multivolumes from ITK 4d images