Difference between revisions of "Documentation/Nightly/Modules/DCMapping"
Acsenrafilho (talk | contribs) (Created page with "<noinclude>{{documentation/versioncheck}}</noinclude> <!-- ---------------------------- --> {{documentation/{{documentation/version}}/module-header}} <!-- -----------------...") Tag: 2017 source edit |
Acsenrafilho (talk | contribs) (Adding general information) Tag: 2017 source edit |
||
| Line 8: | Line 8: | ||
{{documentation/{{documentation/version}}/module-introduction-start|{{documentation/modulename}}}} | {{documentation/{{documentation/version}}/module-introduction-start|{{documentation/modulename}}}} | ||
{{documentation/{{documentation/version}}/module-introduction-row}} | {{documentation/{{documentation/version}}/module-introduction-row}} | ||
| − | Extension: [[Documentation/{{documentation/version}}/Extensions/ | + | Extension: [[Documentation/{{documentation/version}}/Extensions/DiffusionComplexityMap|Diffusion Complexity Map]]<br> |
| − | Webpage: | + | Webpage: https://loamri.com/<br> |
| − | Author: Antonio Carlos da S. Senra Filho, | + | Author: Antonio Carlos da S. Senra Filho, LOAMRI Laboratory (University of Campinas, Department of Cosmic Rays and Chronology)<br> |
| − | Contact: Antonio Carlos da S. Senra Filho, | + | Contact: Antonio Carlos da S. Senra Filho, email: acsenrafilho@alumni.usp.br<br> |
{{documentation/{{documentation/version}}/module-introduction-row}} | {{documentation/{{documentation/version}}/module-introduction-row}} | ||
{{documentation/{{documentation/version}}/module-introduction-logo-gallery | {{documentation/{{documentation/version}}/module-introduction-logo-gallery | ||
| − | |Image:CSIM-logo.png|CSIM Laboratory | + | |Image:CSIM-logo.png| CSIM Laboratory |
| + | |Image:LOAMRI-logo.png| LOAMRI Laboratory | ||
| + | |Image:Unicamp-logo.png| University of Campinas | ||
|Image:USP-logo.png|University of Sao Paulo | |Image:USP-logo.png|University of Sao Paulo | ||
| − | |||
}} | }} | ||
{{documentation/{{documentation/version}}/module-introduction-end}} | {{documentation/{{documentation/version}}/module-introduction-end}} | ||
| Line 22: | Line 23: | ||
<!-- ---------------------------- --> | <!-- ---------------------------- --> | ||
{{documentation/{{documentation/version}}/module-section|Module Description}} | {{documentation/{{documentation/version}}/module-section|Module Description}} | ||
| − | This module offer | + | This module offer the Diffusion Complexity (DC) scalar map, which is able to calculate the diffusion complexity measure using several statistical physics approaches. This method assumes the standard diffusion MRI acquisition protocol for DTI images. Detail about the method can be found at the paper<ref>Manuscript in revire process.</ref> |
<!-- ---------------------------- --> | <!-- ---------------------------- --> | ||
{{documentation/{{documentation/version}}/module-section|Use Cases}} | {{documentation/{{documentation/version}}/module-section|Use Cases}} | ||
| − | * Use Case 1: | + | * Use Case 1: Obtain a complementary scalar information using clinical DTI image acquisition protocol (DC Map) |
| − | ** | + | **The DC map is a new scalar mapping that can give an additional information to analyse diffusion image sequences, without changing the MRI imaging protocol. |
| − | * Use Case 2: | + | * Use Case 2: Gain focus on Gray Matter analysis using diffusion images |
| − | ** | + | **DC map has a signal peak in GM tissue, which can be important to discriminate brain diseases in this particular brain tissue that is challenging to other classical DTI maps (e.g. FA and ADC) |
| − | * Use Case 3: | + | * Use Case 3: Interpret the diffusion data in light of statistical physics information theory |
| − | ** | + | **The DC map is based on the López-Ruiz, Mancini, and Calbet (LMC) information theory definition, giving the contribution of classical entropy (Shannon's entropy) and the disequilibrium function. Hence, another way to interpret the diffusion data can be given by this new technique. |
<gallery widths="300px" perrow="3"> | <gallery widths="300px" perrow="3"> | ||
| − | Image: | + | Image:FA_diff_example.png|Axial slice FA map example |
| − | Image: | + | Image:ADC_diff_example.png|Axial slice ADC map example |
| + | Image:DC_diff_example.png|Axial slice DC map example | ||
</gallery> | </gallery> | ||
| Line 42: | Line 44: | ||
{{documentation/{{documentation/version}}/module-section|Panels and their use}} | {{documentation/{{documentation/version}}/module-section|Panels and their use}} | ||
| − | [[Image: | + | [[Image:dc_map_gui.png|thumb|380px|User Interface]] |
'''IO:''' | '''IO:''' | ||
| − | *'''Input Volume''' | + | *'''Input DWI Volume''' |
| − | ** | + | **Input DWI sequence volume. (Tip: Use DWiConvert module to create an NRRD DWI sequence file from other image file types) |
| − | *''' | + | *'''Brain Mask''' |
| − | ** | + | **Brain mask volume informing the image regions that should be assumed as the total image space were the complexity calculations should be made. If left blank, the entire input image will be used as input. |
| + | *'''DC Mapping''' | ||
| + | **Output Volume representing the Diffusion Complexity (DC) map. | ||
| − | ''' | + | '''Additional Parameters:''' |
| − | *''' | + | *'''Disequilibrium Function''' |
| − | **The | + | **A set of disequilibrium functions that could be used. (Tip: The LMC complexity measure uses the Euclidean function) |
| − | *''' | + | *'''Q Value''' |
| − | ** | + | **A double value that defines the q-Statistics probability distribution function which is used in the image entropy calculation. For Q=1, the Shannon's entropy function is adopted (default). |
| − | + | *'''Use Manual Number of Bins''' | |
| − | + | **Choose if you want to use set manually the number of bins to represent the diffusion histogram estimate. If not, an automatic adjustment is adopted. | |
| − | *'''Number of | + | *'''Number of Bins''' |
| − | ** | + | **A integer value that defines the number of bins used in the histogram estimate. This parameter is used only when the --useManualBins is True |
| − | *''' | ||
| − | ** | ||
| − | |||
| − | |||
<!-- ---------------------------- --> | <!-- ---------------------------- --> | ||
{{documentation/{{documentation/version}}/module-section|Similar Modules}} | {{documentation/{{documentation/version}}/module-section|Similar Modules}} | ||
| − | *[[Documentation/{{documentation/version}}/Modules/ | + | *[[Documentation/{{documentation/version}}/Modules/DiffusionTensorScalarMeasurements|Diffusion Tensor Scalar Measurements]] |
| − | |||
<!-- ---------------------------- --> | <!-- ---------------------------- --> | ||
{{documentation/{{documentation/version}}/module-section|References}} | {{documentation/{{documentation/version}}/module-section|References}} | ||
| − | * | + | * Manuscript in review process |
| − | |||
| − | |||
| − | |||
<!-- ---------------------------- --> | <!-- ---------------------------- --> | ||
Revision as of 11:43, 13 March 2024
Home < Documentation < Nightly < Modules < DCMapping
|
For the latest Slicer documentation, visit the read-the-docs. |
Introduction and Acknowledgements
|
Extension: Diffusion Complexity Map | |||||||||
|
Module Description
This module offer the Diffusion Complexity (DC) scalar map, which is able to calculate the diffusion complexity measure using several statistical physics approaches. This method assumes the standard diffusion MRI acquisition protocol for DTI images. Detail about the method can be found at the paper[1]
Use Cases
- Use Case 1: Obtain a complementary scalar information using clinical DTI image acquisition protocol (DC Map)
- The DC map is a new scalar mapping that can give an additional information to analyse diffusion image sequences, without changing the MRI imaging protocol.
- Use Case 2: Gain focus on Gray Matter analysis using diffusion images
- DC map has a signal peak in GM tissue, which can be important to discriminate brain diseases in this particular brain tissue that is challenging to other classical DTI maps (e.g. FA and ADC)
- Use Case 3: Interpret the diffusion data in light of statistical physics information theory
- The DC map is based on the López-Ruiz, Mancini, and Calbet (LMC) information theory definition, giving the contribution of classical entropy (Shannon's entropy) and the disequilibrium function. Hence, another way to interpret the diffusion data can be given by this new technique.
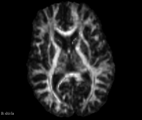
Axial slice FA map example
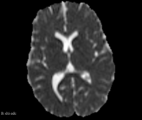
Axial slice ADC map example
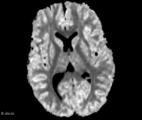
Axial slice DC map example


Panels and their use

IO:
- Input DWI Volume
- Input DWI sequence volume. (Tip: Use DWiConvert module to create an NRRD DWI sequence file from other image file types)
- Brain Mask
- Brain mask volume informing the image regions that should be assumed as the total image space were the complexity calculations should be made. If left blank, the entire input image will be used as input.
- DC Mapping
- Output Volume representing the Diffusion Complexity (DC) map.
Additional Parameters:
- Disequilibrium Function
- A set of disequilibrium functions that could be used. (Tip: The LMC complexity measure uses the Euclidean function)
- Q Value
- A double value that defines the q-Statistics probability distribution function which is used in the image entropy calculation. For Q=1, the Shannon's entropy function is adopted (default).
- Use Manual Number of Bins
- Choose if you want to use set manually the number of bins to represent the diffusion histogram estimate. If not, an automatic adjustment is adopted.
- Number of Bins
- A integer value that defines the number of bins used in the histogram estimate. This parameter is used only when the --useManualBins is True
Similar Modules
References
- Manuscript in review process
Information for Developers
| Section under construction. |
- ↑ Manuscript in revire process.