Difference between revisions of "Documentation/Nightly/Extensions/DebuggingTools"
From Slicer Wiki
(Created page with '<noinclude>{{documentation/versioncheck}}</noinclude> <!-- ---------------------------- --> {{documentation/{{documentation/version}}/module-header}} <!-- -----------------------…') |
|||
| Line 21: | Line 21: | ||
| | | | ||
Python Debugger is an extension of 3D Slicer to allow debugging of Python scripts in the Eclipse integrated development environment using PyDev. | Python Debugger is an extension of 3D Slicer to allow debugging of Python scripts in the Eclipse integrated development environment using PyDev. | ||
| + | |||
| + | Visual debugging (setting breakpoints, execute code step-by-step, view variables, stack, etc.) of Python scripted module is possible by using [http://pydev.org/ PyDev]. | ||
| | | | ||
| Line 34: | Line 36: | ||
<gallery widths="200px" perrow="4"> | <gallery widths="200px" perrow="4"> | ||
| − | Image: | + | Image:PyDevRemoteDebugSlicer.png|Debugging Slicer in PyDev |
| − | |||
</gallery> | </gallery> | ||
<!-- ---------------------------- --> | <!-- ---------------------------- --> | ||
| − | |||
{{documentation/{{documentation/version}}/extension-section|Tutorials}} | {{documentation/{{documentation/version}}/extension-section|Tutorials}} | ||
| − | - | + | |
| + | ===Setup=== | ||
| + | * Install PyDev: the simplest is to use the standalone [http://brainwy.github.io/liclipse/ LiClipse] package | ||
| + | * Run PyDev and enable the remote debugger tool (if you have trouble following these steps then you can find detailed instructions [http://pydev.org/manual_adv_remote_debugger.html here]): | ||
| + | ** Enable PyDev server: in the menu Window > Customize perspective > Command groups availability > PyDev debug | ||
| + | ** Open the debug window: in the menu Window > Open Perspective > Other > Debug | ||
| + | * In Slicer: install the Python debugger extension | ||
| + | |||
| + | ===Start debugging=== | ||
| + | * In PyDev | ||
| + | ** Start the server: on the toolbar click the button "PyDev: start the pydev server" | ||
| + | * In Slicer: | ||
| + | ** Open the ''Python debugger'' module (in ''Developer Tools'' category) | ||
| + | ** Click on ''Connect'' | ||
| + | ** If the debugger is successfully attached, then it will pause Slicer, so Slicer becomes unresponsive (until its execution is resumed in PyDev) | ||
| + | * In PyDev. | ||
| + | ** Slicer execution is now paused, so resume by pressing the "Resume" button on the toolbar | ||
| + | ** Change the console to allow auto-complete and better formatting (optional): click on "Open Console" (small button at the top of the console view) then chose "PyDev Console" and then "PyDev Debug Console" (after this the title of the console should be "PyDev Debug Console" instead of the default "Debug Server"). | ||
| + | |||
<!-- ---------------------------- --> | <!-- ---------------------------- --> | ||
<!-- | <!-- | ||
Revision as of 05:18, 3 March 2014
Home < Documentation < Nightly < Extensions < DebuggingTools
|
For the latest Slicer documentation, visit the read-the-docs. |
Introduction and Acknowledgements
Author: Andras Lasso (PerkLab, Queen's University)
Contact: Andras Lasso, <email>lasso@queensu.ca</email>
Project website: http://www.slicerrt.org
License: Slicer license
|


Extension Description

|
Python Debugger is an extension of 3D Slicer to allow debugging of Python scripts in the Eclipse integrated development environment using PyDev. Visual debugging (setting breakpoints, execute code step-by-step, view variables, stack, etc.) of Python scripted module is possible by using PyDev. |
Modules
- Python debugger (in the module list: Developer Tools)
Use Cases
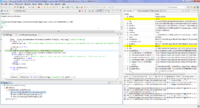
Debugging Slicer in PyDev

Tutorials
Setup
- Install PyDev: the simplest is to use the standalone LiClipse package
- Run PyDev and enable the remote debugger tool (if you have trouble following these steps then you can find detailed instructions here):
- Enable PyDev server: in the menu Window > Customize perspective > Command groups availability > PyDev debug
- Open the debug window: in the menu Window > Open Perspective > Other > Debug
- In Slicer: install the Python debugger extension
Start debugging
- In PyDev
- Start the server: on the toolbar click the button "PyDev: start the pydev server"
- In Slicer:
- Open the Python debugger module (in Developer Tools category)
- Click on Connect
- If the debugger is successfully attached, then it will pause Slicer, so Slicer becomes unresponsive (until its execution is resumed in PyDev)
- In PyDev.
- Slicer execution is now paused, so resume by pressing the "Resume" button on the toolbar
- Change the console to allow auto-complete and better formatting (optional): click on "Open Console" (small button at the top of the console view) then chose "PyDev Console" and then "PyDev Debug Console" (after this the title of the console should be "PyDev Debug Console" instead of the default "Debug Server").
Information for Developers
- Source code: https://subversion.assembla.com/svn/slicerrt/trunk/PyDevRemoteDebug
- Issue tracker: open issues and enhancement requests