Documentation/4.1/Developers/Charts

Charting in radiation therapy.
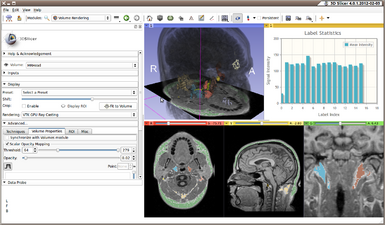
Charting regional statistics


Contents
Slicer Charting Overview
Slicer provides Charting facilities that include a special Chart View that can be packed in the layout, similar to the Slice Views and 3D Views. The architecture also includes nodes that represent the data to be displayed in the chart as well as nodes to represent the display properties of the data and the chart itself. Charts can be serialized with the MRML scene, including the chart data and display properties.
Chart capabilities
- Charts are represented in the MRML scene
- Charts can be serialized with the MRML scene
- Multiple Chart Views can be in a layout
- Each Chart View can display any Chart in the MRML scene
- Each Chart can display multiple Arrays of data
- Chart Views can emit signals back to the application as the user interacts with a Chart
- Multiple chart types (Line, Bar, Scatter)
- Data can be quantitative or categorical
- Zooming using the mouse
- Highlighting data points under the mouse
- Axis labels
- Legends
- Color tables can be used to define the cycle of colors assigned to arrays in a chart
- Colors can be assigned individually to each Array in a Chart
- Bar charts with categorical data can use a color table to define colors and labels for each data point in the chart.
Chart View
- qMRMLChartWidget
- The toplevel charting widget that is packed in layout. Subclass of qMRMLWidget. Contains a qMRMLChartView and a qMRMLChartViewControllerWidget. There can be several Chart Widgets in a single layout.
- qMRMLChartView
- Display canvas of the chart. This is currently a subclass of QWebView as the charting facilities is based on a jQuery library called jqPlot.
- qMRMLChartViewControllerWidget
- Widget to control the content and display of a chart.
MRML Nodes
- vtkMRMLChartViewNode
- Node associated with a Chart View. Keeps track of which chart to display in a Chart View. There can be multiple charts in a scene and a given Chart View can display any of the charts.
- vtkMRMLChartNode
- Represents the content and properties of a chart. Manages a list of Array Nodes to display in the chart. Provides methods to set the properties of a chart or the properties of each Array Node.
- vtkMRMLDoubleArrayNode
- Represents the data that can be displayed in a chart. Array nodes contain a series of 3-tuples representing the (X, Y, Error) measurement values.
Constructing a chart
Below is an example in python to construct and display a chart communicating completely at the level of MRML.
import slicer
import math

# Switch to a layout (24) that contains a Chart View to initiate the construction of the widget and Chart View Node
lns = slicer.mrmlScene.GetNodesByClass('vtkMRMLLayoutNode')
lns.InitTraversal()
ln = lns.GetNextItemAsObject()
ln.SetViewArrangement(24)

# Get the Chart View Node
cvns = slicer.mrmlScene.GetNodesByClass('vtkMRMLChartViewNode')
cvns.InitTraversal()
cvn = cvns.GetNextItemAsObject()

# Create an Array Node and add some data
dn = slicer.mrmlScene.AddNode(slicer.vtkMRMLDoubleArrayNode())
a = dn.GetArray()
a.SetNumberOfTuples(600)
x = range(0, 600)
for i in range(len(x)):
    a.SetComponent(i, 0, x[i]/50.0)
    a.SetComponent(i, 1, math.sin(x[i]/50.0))
    a.SetComponent(i, 2, 0)

# Create a second Array node
dn2 = slicer.mrmlScene.AddNode(slicer.vtkMRMLDoubleArrayNode())
a = dn2.GetArray()
a.SetNumberOfTuples(600)
x = range(0, 600)
for i in range(len(x)):
    a.SetComponent(i, 0, x[i]/50.0)
    a.SetComponent(i, 1, math.cos(x[i]/50.0))
    a.SetComponent(i, 2, 0)

# Create a Chart Node.
cn = slicer.mrmlScene.AddNode(slicer.vtkMRMLChartNode())

# Add the Array Nodes to the Chart. The first argument is a string used for the legend and to refer to the Array when setting properties.
cn.AddArray('A double array', dn.GetID())
cn.AddArray('Another double array', dn2.GetID())

# Set a few properties on the Chart. The first argument is a string identifying which Array to assign the property.
# 'default' is used to assign a property to the Chart itself (as opposed to an Array Node).
cn.SetProperty('default', 'title', 'A simple chart with 2 curves')
cn.SetProperty('default', 'xAxisLabel', 'Something in x')
cn.SetProperty('default', 'yAxisLabel', 'Something in y')

# Tell the Chart View which Chart to display
cvn.SetChartNodeID(cn.GetID())
This code produces the chart below.

Properties
Properties can be assigned to a Chart or to a specific Array in the Chart. The API for setting a property on a Chart Node is
void SetProperty(const char *arrname, const char *property, const char *value);
The first argument is a string for the name of the Array to apply the property. This name was established when the array was added to the Chart using the AddArray(name, array) method. The array name 'default' is used to specify (1) properties that apply to the Chart and not to an Array, and (2) to establish a default setting for a property for all Arrays. Default properties assigned to Arrays can be overridden by properties assigned to a specific array.
Chart level properties
- type
- Line, Bar, Scatter
- title
- title displayed on the chart
- showTitle
- show title "on" or "off"
- xAxisLabel
- label displayed on the x-axis
- showXAxisLabel
- show x-axis label "on" or "off"
- xAxisType
- type of data on x-axis, "quantitative", "categorical", "date"
- yAxisLabel
- label displayed on the y-axis
- showYAxisLabel
- show y-axis label "on" or "off"
- yAxisType
- type of data on y-axis, "quantitative", "categorical", "date"
- showGrid
- show grid "on" or "off"
- showLegend
- show legend "on" or "off"
- lookupTable
- MRMLID of a ColorNode to use to color series
Array level properties
Array level properties (can be assigned to "default" to apply to entire chart.
- showLines
- show lines "on" or "off"
- showMarkers
- show markers "on" or "off"
- color
- color to use for the array lines and points (#RRGGBB)
- lookupTable
- MRMLID of a ColorNode to use to color individual bars in bar chart (useful with categorical data)
Signals
Chart Views provide signals that allow Slicer to respond to user interactions with the Chart canvas.
- void dataMouseOver(const char *mrmlArrayID, int pointidx, double x, double y)
- Signal emitted when the mouse moves over a data point. Returns the id of the MRMLDoubleArrayNode, the index of the point, and the values.
- void dataPointClicked(const char *mrmlArrayID, int pointidx, double x, double y)
- Signal emitted when a data point has been clicked. Returns the id of the MRMLDoubleArrayNode, the index of the point, and the values.
Bar charts with categorical data
When the x-axis data in an Array is categorical, for example when the Array represents the average intensity of an image region under specific labels in a label map, a bar chart of the Array can extract information automatically from a color table assigned as a property of the Array in the Chart. Here, the Charting will interpret the x-axis values in the Array as "labels" and cross-reference the "labels" in the color table to extract the label as well as the color assigned to each bar in the chart.
chartNode.SetProperty('default', 'type', 'Bar')
chartNode.SetProperty('default', 'xAxisType', 'categorical')
chartNode.SetProperty('My Array', 'lookupTable', colorNodeID)

Currently, this capability is not provided for line charts.
Under the hood
The architecture of the Charting is divided into two layers. The first layer is the public layer available to Slicer developers consisting of the MRML nodes and associated Widgets. The second layer is the rendering architecture for the Chart. The rendering of Chart utilizes a jQuery library called jqPlot to generate a plot. The Chart View is actually a QWebView Widget that displays a web page that is generated on the fly by Slicer to display a Chart.
The method qMRMLChartViewPrivate::updateWidgetFromMRML() generates the HTML and javascript to display a Chart, passes the generated code to the QWebView, calls the QWebView::show() method, and then exposes a Qt object to the javascript layer to support signals and slots. The HTML and javascript generation includes
- HTML page header, css, javascript
- Div element to hold the chart
- Script element for the chart
- Conversion of the Array nodes to javascript arrays suitable for jqPlot
- Construction of the plot options from the Chart properties
- Call to jqPlot to generate the plot
- Slots and hooks for resizing the Chart and handling the mouse over and data point click signals
- HTML page postscript, additional javascript references
Resources
jqPlot is package into the Slicer executable as Qt Resources. Only the jqPlot and jQuery javascript files and css files needed to implement the current features are embedded as Qt Resources. If additional jqPlot or jQuery features are needed in the future, the associated javascript and css files will need to be added to the Qt Resources.
Build process
jqPlot is downloaded and installed locally in the Slicer build tree as part of the SuperBuild process.
To do
- Refactor the generation of the javascript representation of the chart to allow data to be modified without recreating the page.
- Add more signals
- Write a bar chart renderer, improving the layout.
- Add error bars
- Add tags to Array nodes specify a "label" which will allow line plots to be automatically colored based on a color table. Similar to how bar charts can automatically color the bars in a plot when the x-axis data is categorical.
- Presentation quality printing