Documentation/4.5/Modules/DataProbe
From Slicer Wiki
Home < Documentation < 4.5 < Modules < DataProbe
|
For the latest Slicer documentation, visit the read-the-docs. |
Introduction and Acknowledgements
|
Information on NA-MIC can be obtained from the NA-MIC website. | |||||||
|
Module Description
Display information about the volume data at the location of the mouse pointer in the Slice views.
Use Cases
Examples:
- Use Case 1: Compare image intensity for two volumes before and after filtering by putting one in the foreground and one in the background.
- Use Case 2: Get a textual description of the label value of a segmented structure.
- Use Case 3: Determine the patient and voxel coordinates of a structure.
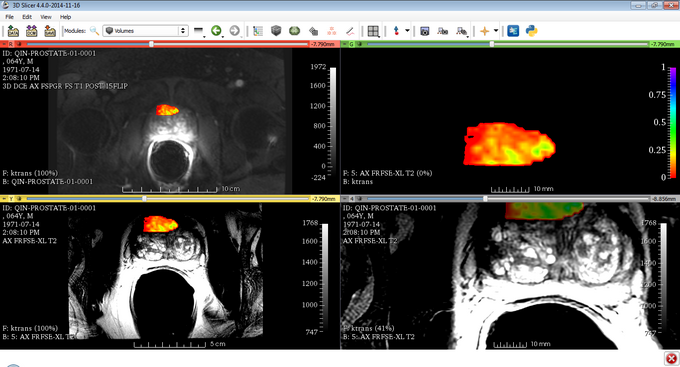
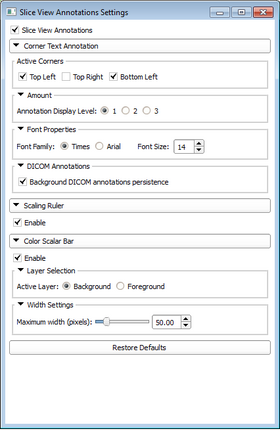
- Use Case 4: Control slice view corner text annotations, color scalar bar and interactive ruler.
Tutorials
Panels and their use
The Data probe shows two blocks of data
- The first line displays:
- color and name of the Slice view that the mouse pointer is currently over
- the patient-space location corresponding to the mouse pointer in RAS (Right/Anterior/Superior space - see the page on Coordinate Systems for more information)
- the orientation of the slice view
- the spacing between slices for the slice view
- The lower block of three lines displays:
- L, F, or B for Label, Foreground, and Background respectively
- the name of the volume (or None if nothing is selected)
- the IJK coordinates corresponding to the mouse pointer (see the page on Coordinate Systems for more information)
- or Label volumes, the name corresponding to the label value (as defined by the current color table)
- the value of the volume at that coordinate (a single value for scalar volumes or the number or components for non-scalar volumes)
Slice Annotations
Slice view annotations part provides the following information for each of the slice views:
- Information about the volume node in different layers (background, foreground and label) in the form of corner text annotations. For image volumes which are loaded through the DICOM module, a summary of some of the DICOM values would also be available on the slice view.
- Interactive color scalar bar with tick marks that indicates to the viewer the correspondence between color value and data value. The color scalar bar is responsive to the changes of window/level of the volume. It can be assigned to either background or foreground layer.
- Interactive ruler.
Slice view annotations can be controlled using the setting dialog box by clicking the gear button located at the Dataprobe panel.
Similar Modules
References
N/A
Information for Developers
This module is written in python.
| Section under construction. |


