|
The Colors Module manages color look up tables.
Tables are used by mappers to translate between an integer and a colour value for display of models and volumes.
Slicer supports three kinds of tables:
- Continuous scales, like the greyscale table.
- Parametric tables, defined by an equation, such as the FMRIPA table.
- Discrete tables, such as those read in from a file.
You can create a duplicate of a color table to allow editing the names, values and color by clicking on the folder+ icon. You can then save the new color table via the File -> Save interface.
You can load a color table file from the File -> Add Data dialog.
File format
The color file format is a plain text file with the .txt or .ctbl extension. Each line in the file has:
label name R G B A
label is an integer, name a string, and RGBA are 0-255.
File example:
# Comments if the line start with #
0 air 0 0 0 0
1 bone 255 255 255 255 whatever after the Alpha value is discarded
2 tumor 255 128 0 255
...
Custom LUTs
You can create custom LUTs by creating a table with the colors on the wiki.
Categories
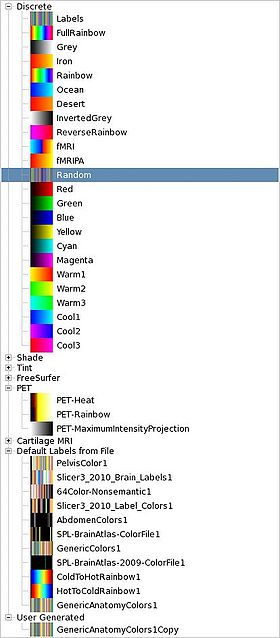
The colors are divided up into categories:
- Discrete
 Labels: A legacy colour table that contains some anatomical mapping Labels: A legacy colour table that contains some anatomical mapping FullRainbow: A full rainbow of 256 colors, goes from red to red with all rainbow colors in between. Useful for colourful display of a label map FullRainbow: A full rainbow of 256 colors, goes from red to red with all rainbow colors in between. Useful for colourful display of a label map Grey: A grey scale ranging from black at 0 to white at 255. Useful for displaying MRI volumes. Grey: A grey scale ranging from black at 0 to white at 255. Useful for displaying MRI volumes. Iron: A scale from red to yellow, 157 colours, useful for Iron: A scale from red to yellow, 157 colours, useful for Rainbow: Goes from red to purple, passing through the colors of the rainbow in between. Useful for a colorful display of a label map Rainbow: Goes from red to purple, passing through the colors of the rainbow in between. Useful for a colorful display of a label map Ocean: A lighter blue scale of 256 values, useful for showing registration results. Ocean: A lighter blue scale of 256 values, useful for showing registration results. Desert: Red to yellow/orange scale, 256 colours, useful for Desert: Red to yellow/orange scale, 256 colours, useful for InvertedGrey: A white to black scale, 256 colours, useful to highlight negative versions, or to flip intensities of signal values. InvertedGrey: A white to black scale, 256 colours, useful to highlight negative versions, or to flip intensities of signal values. ReverseRainbow: A colourful display option, 256 colours going from purple to red ReverseRainbow: A colourful display option, 256 colours going from purple to red fMRI: A combination of Ocean (0-22) and Desert (23-42), useful for displaying functional MRI volumes (highlights activation) fMRI: A combination of Ocean (0-22) and Desert (23-42), useful for displaying functional MRI volumes (highlights activation) fMRIPA: A small fMRI positive activation scale going from red to yellow from 0-19, useful for displaying functional MRI volumes when don't need the blue of the fMRI scale. fMRIPA: A small fMRI positive activation scale going from red to yellow from 0-19, useful for displaying functional MRI volumes when don't need the blue of the fMRI scale. Random: A random selection of 256 rgb colours, useful to distinguish between a small number of labeled regions (especially outside of the brain) Random: A random selection of 256 rgb colours, useful to distinguish between a small number of labeled regions (especially outside of the brain)- UserDefined: A user defined colour table, use the editor to specify it
 Red: A red scale of 256 values. Useful for layering with Cyan Red: A red scale of 256 values. Useful for layering with Cyan Green: A green scale of 256 values, useful for layering with Magenta Green: A green scale of 256 values, useful for layering with Magenta Blue: A blue scale of 256 values from black to pure blue, useful for layering with Yellow Blue: A blue scale of 256 values from black to pure blue, useful for layering with Yellow Yellow: A yellow scale of 256 values, from black to pure yellow, useful for layering with blue (it's complementary, layering yields gray) Yellow: A yellow scale of 256 values, from black to pure yellow, useful for layering with blue (it's complementary, layering yields gray) Cyan: A cyan ramp of 256 values, from black to cyan, complementary ramp to red, layering yeilds gray Cyan: A cyan ramp of 256 values, from black to cyan, complementary ramp to red, layering yeilds gray Magenta: A magenta scale of 256 colors from black to magenta, complementary ramp to green, layering yeilds gray Magenta: A magenta scale of 256 colors from black to magenta, complementary ramp to green, layering yeilds gray Warm1: A scale from yellow to red, of 256 colors, ramp of warm colours that's complementary to Cool1 Warm1: A scale from yellow to red, of 256 colors, ramp of warm colours that's complementary to Cool1 Warm2: A scale from green to yellow, 256 colours, ramp of warm colours that's complementary to Cool2 Warm2: A scale from green to yellow, 256 colours, ramp of warm colours that's complementary to Cool2 Warm3: A scale from cyan to green, 256 colours, ramp of warm colours that's complementary to Cool3 Warm3: A scale from cyan to green, 256 colours, ramp of warm colours that's complementary to Cool3 Cool1: A scale from blue to cyan, 256 colours, ramp of cool colours that's complementary to Warm1 Cool1: A scale from blue to cyan, 256 colours, ramp of cool colours that's complementary to Warm1 Cool2: A scale from magenta to blue, 256 colours, ramp of cool colours that's complementary to Warm2 Cool2: A scale from magenta to blue, 256 colours, ramp of cool colours that's complementary to Warm2 Cool3: A scale from red to magenta, ramp of cool colours that's complementary to Warm3 Cool3: A scale from red to magenta, ramp of cool colours that's complementary to Warm3 RandomIntegers: A random scale RandomIntegers: A random scale
- Shade:
 WarmShade1: A scale from black to red, of 256 colors, ramp of warm colors with variation in value that's complementary to CoolShade1 WarmShade1: A scale from black to red, of 256 colors, ramp of warm colors with variation in value that's complementary to CoolShade1 WarmShade2: A scale from black to yellow, through green, of 256 colors, ramp of warm colors with variation in value that's complementary to CoolShade2 WarmShade2: A scale from black to yellow, through green, of 256 colors, ramp of warm colors with variation in value that's complementary to CoolShade2 WarmShade3: A scale from black to green, of 256 colours, ramp of warm colors with variation in value that's complementary to CoolShade3 WarmShade3: A scale from black to green, of 256 colours, ramp of warm colors with variation in value that's complementary to CoolShade3 CoolShade1: A scale from black to cyan, 256 colours, ramp of cool colours with variation in value that is complementary to WarmShade1 CoolShade1: A scale from black to cyan, 256 colours, ramp of cool colours with variation in value that is complementary to WarmShade1 CoolShade2: A scale from black to blue through purple, 256 colors, ramp of cool colours with variation in value that is complementary to WarmShade2 CoolShade2: A scale from black to blue through purple, 256 colors, ramp of cool colours with variation in value that is complementary to WarmShade2 CoolShade3: A scale from black to magenta, 256 colours, ramp of cool colours with variation in value that is complementary to WarmShade3 CoolShade3: A scale from black to magenta, 256 colours, ramp of cool colours with variation in value that is complementary to WarmShade3
- Tint:
 WarmTint1: A scale from white to red, 256 colours, ramp of warm colours with variation in saturation that's complementary to CoolTint1 WarmTint1: A scale from white to red, 256 colours, ramp of warm colours with variation in saturation that's complementary to CoolTint1 WarmTint2: A scale from white to yellow, 256 colours, ramp of warm colours with variation in saturation that's complementary to CoolTint2 WarmTint2: A scale from white to yellow, 256 colours, ramp of warm colours with variation in saturation that's complementary to CoolTint2 WarmTint3: A scale from white to green, 256 colours, ramp of warm colours with variation in saturation that's complementary to CoolTint3 WarmTint3: A scale from white to green, 256 colours, ramp of warm colours with variation in saturation that's complementary to CoolTint3 CoolTint1: A scale from white to cyan, 256 colours, ramp of cool colours with variations in saturation that's complementary to WarmTint1 CoolTint1: A scale from white to cyan, 256 colours, ramp of cool colours with variations in saturation that's complementary to WarmTint1 CoolTint2: A scale from white to blue, 256 colours, ramp of cool colours with variations in saturation that's complementary to WarmTint2 CoolTint2: A scale from white to blue, 256 colours, ramp of cool colours with variations in saturation that's complementary to WarmTint2 CoolTint3: A scale from white to magenta, 256 colours, ramp of cool colours with variations in saturation that's complementary to WarmTint3 CoolTint3: A scale from white to magenta, 256 colours, ramp of cool colours with variations in saturation that's complementary to WarmTint3
- FreeSurfer
 Heat: The Heat FreeSurfer colour table, shows hot spots with high activation Heat: The Heat FreeSurfer colour table, shows hot spots with high activation BlueRed: A FreeSurfer color scale, 256 colours, from blue to red BlueRed: A FreeSurfer color scale, 256 colours, from blue to red RedBlue: A FreeSurfer color scale, 256 colours, from red to blue RedBlue: A FreeSurfer color scale, 256 colours, from red to blue RedGreen: A FreeSurfer color scale, 256 colours, from red to green, used to highlight sulcal curvature RedGreen: A FreeSurfer color scale, 256 colours, from red to green, used to highlight sulcal curvature GreenRed: A FreeSurfer color scale, 256 colours, from green to red, used to highlight sulcal curvature GreenRed: A FreeSurfer color scale, 256 colours, from green to red, used to highlight sulcal curvature- FreeSurferLabels: A color table read in from a text file, each line of the format: IntegerLabel Name R G B Alpha
- PET
 PET-Heat: Useful for displaying colorized PET data. PET-Heat: Useful for displaying colorized PET data. PET-Rainbow: Useful for displaying colorized PET data. PET-Rainbow: Useful for displaying colorized PET data. PET-MaximumIntensityProjection: Useful for displaying inverse grey PET data. PET-MaximumIntensityProjection: Useful for displaying inverse grey PET data.
- Cartilage MRI
 dGEMRIC-1.5T: Useful for displaying 1.5 tesla delayed gadolinium-enhanced MRI of cartilage dGEMRIC-1.5T: Useful for displaying 1.5 tesla delayed gadolinium-enhanced MRI of cartilage dGEMRIC-3T: Useful for displaying 3 Tesla delayed gadolinium-enhanced MRI of cartilage dGEMRIC-3T: Useful for displaying 3 Tesla delayed gadolinium-enhanced MRI of cartilage
- Default Labels from File:
- a list of color nodes loaded from files, from the default Slicer color directory
 PelvisColor: useful for displaying segmented pelvic MRI volumes PelvisColor: useful for displaying segmented pelvic MRI volumes
 Slicer3_2010_Brain_Labels: a brain segementation table with 16 labels defined. Slicer3_2010_Brain_Labels: a brain segementation table with 16 labels defined.
 64Color-Nonsemantic: A color table with no semantic labels, pure color information 64Color-Nonsemantic: A color table with no semantic labels, pure color information Slicer3_2010_LabelColors: a table with 16 labels defined. Slicer3_2010_LabelColors: a table with 16 labels defined.- AbdomenColors: useful for displaying segmented abdominal MRI volumes
- SPL-BrainAtlas-ColorFile: useful for displaying segmented brain MRI volumes
- SPL-BrainAtlas-2009-ColorFile: an updated brain segmentation node
- ColdToHotRainbow: a shifted rainbow that runs from blue to red, useful when needing to display a volume for which larger values are hotter
- HotToColdRainbow: a shifted rainbow that runs from red to blue, useful when needing to display a volume for which larger values are colder
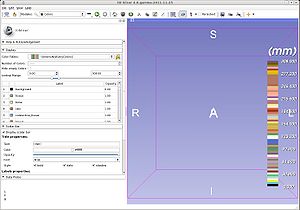
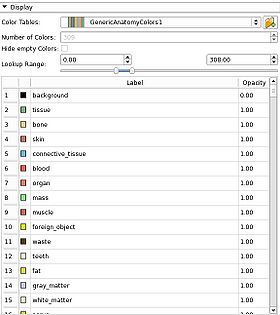
- GenericAnatomyColors: a list of whole body anatomy labels and useful colors for them, the default for the Editor module creating new label map volumes
- File
- If you load a color file from File -> Add Data, it will appear here
- User Generated
- If you create a new color node, it will appear here
|
|


