Difference between revisions of "Modules:Volumes-Documentation-3.6"
| Line 75: | Line 75: | ||
* '''Load:''' Load volumes into Slicer3 | * '''Load:''' Load volumes into Slicer3 | ||
* '''Display:''' Adjust volume display parameters | * '''Display:''' Adjust volume display parameters | ||
| − | * ''' | + | * '''Info:''' General information about volume |
* '''Save:''' Saves volume onto disk | * '''Save:''' Saves volume onto disk | ||
Revision as of 15:19, 29 April 2010
Home < Modules:Volumes-Documentation-3.6Return to Slicer 3.6 Documentation
Module Name
Volumes
General Information
Module Type & Category
Type: Interactive
Category: Base
Authors, Collaborators & Contact
- Alex Yarmarkovich, Isomics, SPL
- Steve Pieper, Isomics, SPL
- Contact: Alex Yarmarkovich, alexy@bwh.harvard.edu
Module Description
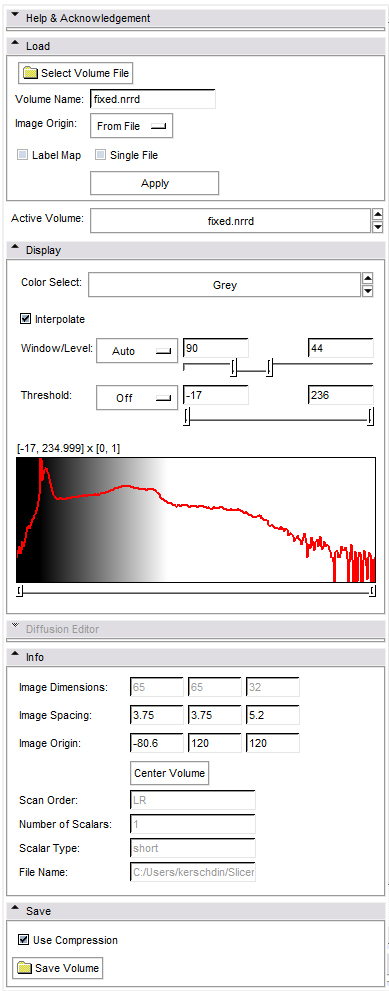
The Volumes Module loads, saves and adjusts display parameters of volume data.
Usage
- Load
- select the volume that you want to load
- If needed edit the name that will be displayed for this volume inside slicer
- If your volume is not a nrrd or dicom format, select "centered" for image origin, else select "from file".
- If this is a label map, click the box
- Active Volume: determines which volume is manipulated by the Display section. Make sure that you select the Volume that you intend to work on!
- Display
- Allows you to adjust the way that a volume is displayed
- Window/Level can be set manually or automatically.
- Threshold is a way to make the background black disappear in the 3D view, when slices are turned to visible.
- pressing the shift key allows fine control while adjusting the sliders
- For labelmaps you can select here the proper look-up table through the Color Select pull-down.
- For DWI volumes you can select a component of the volume to visualize.
- For DWI volumes you can edit the gradient directions and measurement frame using the Diffusion Editor described below.
- For DTI volumes you can select a scalar drived component of the tensor volume (such as FA) to visualize.
- For DTI volumes you can control the tensor glyphs visualization on the slice planes using the Glyph On Slices Display editor described below.
- Diffusion Editor
- For DWI
- editing gradients manually or load existing gradients from file (.txt or .nhdr).
- editing the measurement frame manually or simply rotate/swap/negate columns by selecting them.
- testing the parameters by estimating a tensor and displaying glyphs and tracts.
- For DTI
- editing the measurement frame as described above.
- testing by displaying glyphs and tracts.
- For DWI
- Glyph On Slices Display editor
- Controls the tensor glyphs visibility on individual slices in both 3D and 2D viewers.
- Selects the scalar to color the glyphs by and the color map to apply.
- Controls glyphs opacity, glyph type, scale and sampling rate.
- Info
- Provides some basic information about the Volume
- Save
- Lets you save a volume. Make sure to provide an extension (such as myvolume.nrrd)
Examples, Use Cases & Tutorials
- Tutorial about loading and viewing data.
Viewing individual voxels
The Slicer default view is to show images using trilinear interpolation. If you want to see the individual voxels, uncheck the "Interpolate" button in the Volume module. The example below shows images with and without interpolation.
Quick Tour of Features and Use
- Load: Load volumes into Slicer3
- Display: Adjust volume display parameters
- Info: General information about volume
- Save: Saves volume onto disk
Development
Notes from the Developer(s)
Dependencies
Other modules or packages that are required for this module's use.
Tests
On the Dashboard, these tests verify that the module is working on various platforms:
Known bugs
Follow this link to the Slicer3 bug tracker.
Usability issues
Follow this link to the Slicer3 bug tracker. Please select the usability issue category when browsing or contributing.
Source code & documentation
Follow this link to the Volumes source code in ViewVC.
Documentation generated by doxygen.

