Difference between revisions of "Modules:Color-Documentation-3.4"
| Line 51: | Line 51: | ||
* '''Display panel:''' | * '''Display panel:''' | ||
| + | This is a stand alone widget that can be popped up by other modules, for example the Editor. Here it lets you inspect the values of the colour look up table. | ||
Slicer supports three kinds of tables: | Slicer supports three kinds of tables: | ||
# Continuous scales, like the greyscale table. | # Continuous scales, like the greyscale table. | ||
# Parametric tables, defined by an equation, such as the FMRIPA table. | # Parametric tables, defined by an equation, such as the FMRIPA table. | ||
# Discrete tables, such as those read in from a file. | # Discrete tables, such as those read in from a file. | ||
| + | **''Color Select'': Choose from a drop down list of color nodes. | ||
| + | [[Image:SlicerColorNodes-3.4.jpg]] | ||
| + | **''Node Type'': a label updated to give the type of the node currently being displayed | ||
| + | **''Total Number of Colours in Table'': a label updated to display the number of entries in the color look up table. | ||
| + | **''Selected Color Label'': used especially in the Editor module, draw with the colour last clicked upon in the table. | ||
| + | **List box: The contents of the colou table, the entry is the integer label value, the name will show up in the label map layer of th 22d slice windows when you mouse over voxels with the corresponding value, the Color column shows how the voxel will be rendered. | ||
| + | **''Show Only Named Colors'': when this box is checked, the list box will only be populated by named colours. Some colour tables can have memtpy entries that have no name and default to black, this option lets you hide or show them. | ||
* '''Edit panel:''' | * '''Edit panel:''' | ||
Users are only allowed to edit User type tables. Use the Edit frame to create a new color table, and save it to a file. | Users are only allowed to edit User type tables. Use the Edit frame to create a new color table, and save it to a file. | ||
| + | [[Image:SlicerColorEditGUI-3.4.jpg]] | ||
== Development == | == Development == | ||
Revision as of 17:55, 24 February 2009
Home < Modules:Color-Documentation-3.4Return to Slicer 3.4 Documentation
Color Module
Color
General Information
Module Type & Category
Type: Interactive
Category: Base
Authors, Collaborators & Contact
- Nicole Aucoin: Brigham and Women's Hospital
- Sebastien Barre, Kitware Inc.
- Contact: Nicole Aucoin, nicole@bwh.harvard.edu
Module Description
The Color Module manages color look up tables.
Tables are used by mappers to translate between an integer and a colour value for display of models and volumes.
Usage
Examples, Use Cases & Tutorials
This module is used to change the color mapping of volumes, model scalar overlays.
- Note use cases for which this module is especially appropriate, and/or link to examples.
- Link to examples of the module's use
- Link to any existing tutorials
Quick Tour of Features and Use
- Load panel: The Select Color File button will let you choose a text color file to load.
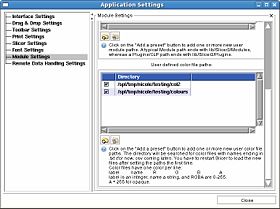
You can also specify a directory from which to read color files using the View -> Application Settings window, Module Settings frame. Click on the Add a preset button to add one or more new user color file paths. The directory will be searched for color files with names ending in .txt (for now, csv coming later). You have to restart Slicer to load the new files after setting the paths the first time.
Color files have one color per line:
label name R G B A
label is an integer, name a string, and RGBA are 0-255. A = 255 for opaque.
In a the binary directory of Slicer3, the default color files live in share/Slicer3/SlicerBaseLogic/Resources/ColorFiles.
- Display panel:
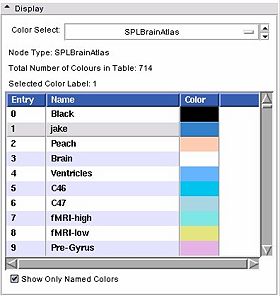
This is a stand alone widget that can be popped up by other modules, for example the Editor. Here it lets you inspect the values of the colour look up table. Slicer supports three kinds of tables:
- Continuous scales, like the greyscale table.
- Parametric tables, defined by an equation, such as the FMRIPA table.
- Discrete tables, such as those read in from a file.
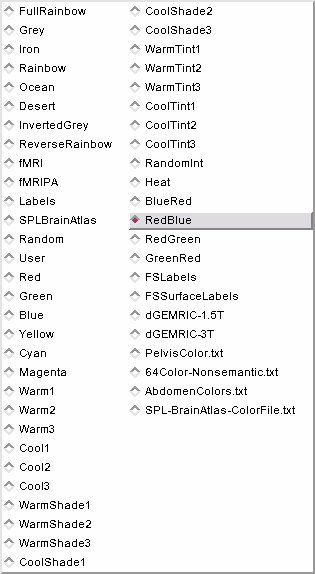
- Color Select: Choose from a drop down list of color nodes.
- Node Type: a label updated to give the type of the node currently being displayed
- Total Number of Colours in Table: a label updated to display the number of entries in the color look up table.
- Selected Color Label: used especially in the Editor module, draw with the colour last clicked upon in the table.
- List box: The contents of the colou table, the entry is the integer label value, the name will show up in the label map layer of th 22d slice windows when you mouse over voxels with the corresponding value, the Color column shows how the voxel will be rendered.
- Show Only Named Colors: when this box is checked, the list box will only be populated by named colours. Some colour tables can have memtpy entries that have no name and default to black, this option lets you hide or show them.
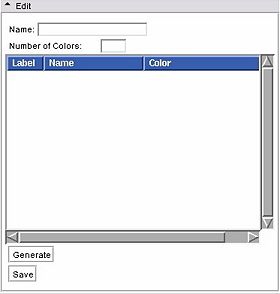
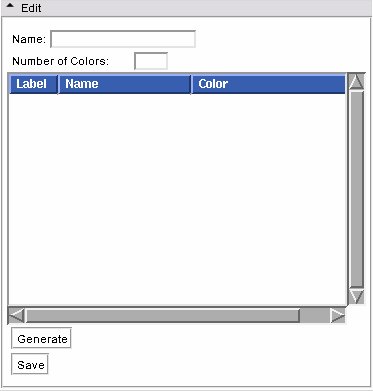
- Edit panel:
Users are only allowed to edit User type tables. Use the Edit frame to create a new color table, and save it to a file.
Development
Dependencies
The Volumes, Editor, and Models modules require this module.
Known bugs
Follow this link to the Slicer3 bug tracker.
Usability issues
Follow this link to the Slicer3 bug tracker. Please select the usability issue category when browsing or contributing.
Source code & documentation
Source code:
- vtkSlicerColorGUI.cxx
- vtkSlicerColorGUI.h
- vtkSlicerColorLogic.cxx
- vtkSlicerColorLogic.h
- vtkSlicerColorDisplayWidget.cxx
- vtkSlicerColorDisplayWidget.h
- vtkSlicerColorEditWidget.cxx
- vtkSlicerColorEditWidget.h
- vtkMRMLColorNode.cxx
- vtkMRMLColorNode.h
Documentation generated by doxygen.
- Color GUI
- Color Logic
- Color Display Widget
- Color Edit Widget
- MRML Color Node (superclass from which other color nodes are derived)
More Information
Acknowledgment
This work is part of the National Alliance for Medical Image Computing (NAMIC), funded by the National Institutes of Health through the NIH Roadmap for Medical Research, Grant U54 EB005149.
