Slicer4:VisualBlog
This is the Slicer 4 visual blog. Please click here if you are looking for the old Slicer 3 visual blog.
- 2013
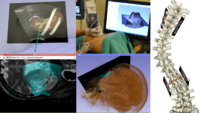
Some applications of the SlicerIGT extension for image-guided and navigated medical interventions. For more information see [IGT website].
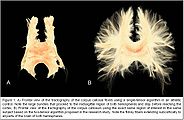
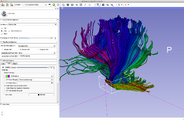
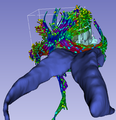
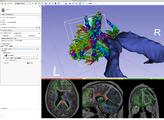
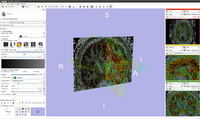
UKFTractography is a module for computing tractography of DWI images using an unscented Kalman filter. Because of its 2-tensor algorithm, it is able to model fiber crossings and capture many more fibers than a single tensor algorithm.
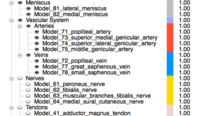
ShapePopulationViewer is an external tool that allows the user to dynamically interact with multiple surfaces at the same time : an interesting tool for shape visualisation and comparison. It now is available as a Slicer Extension.
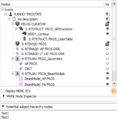
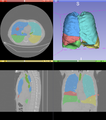
The Subject hierarchy module and mechanism organizes and handles loaded data in the RT extension package, providing processing and analysis features through plugins. It aspires to be a convenient central organizing point for many of the operations that 3D Slicer and its extensions perform.
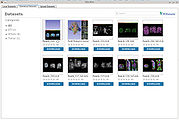
The Data Store allows a user to easily upload and download MRB files.
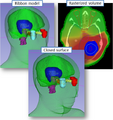
The Contours module manages contours in the RT extension package.
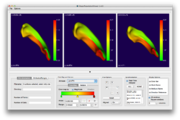
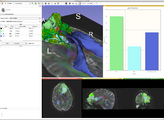
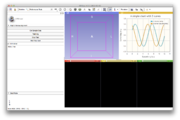
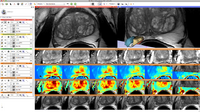
MultiVolumeExplorer module has been updated to include the capability to plot multivolume pixel values from 2 multivolumes at the same time. This feature is particularly helpful while visualizing the results of model fits, such as those produced by the updated PkModeling extension.
A new extension allows to run matlab scripts without having to recompile Slicer. For more information see here
The Cardiac MR Extension provides tools for segmentation and analysis of heart tissue and structure for treatment and diagnosis of Atrial Fibrillation.
- 2012
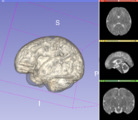
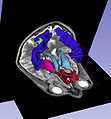
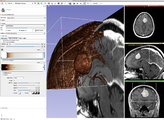
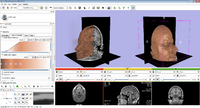
Fetal brain development. The visualization is using volume rendering and the Multivolume modules in Slicer 4. Click here for the full movie (~24mb). Data downloaded from Imperial College.
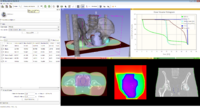
SlicerRT 0.2 has been released! SlicerRT is 3D Slicer with extensions for radiotherapy research, which is developed by SparKit project with the contributions from Slicer community.
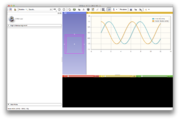
MultiVolumeExplorer with support for charting. See here for more information.
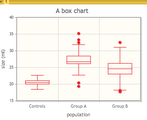
Label Statistics with charting and visualization
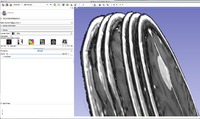
Frame from a movie of slicer code activity in 2011. See the full movie here. Made with gource. Inspired by a an ITKv4 gource movie
- 2011
- 2010
