Home < Slicer4:VisualBlogThis is the Slicer 4 visual blog. Please click here if you are looking for the old Slicer 3 visual blog.
- 2013
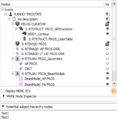
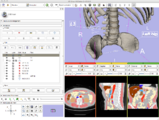
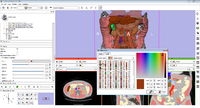
The Subject hierarchy module and mechanism organizes and handles loaded data in the RT extension package, providing processing and analysis features through plugins. It aspires to be a convenient central organizing point for many of the operations that 3D Slicer and its extensions perform.
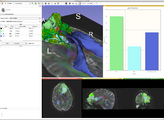
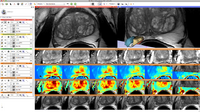
MultiVolumeExplorer module has been updated to include the capability to plot multivolume pixel values from 2 multivolumes at the same time. This feature is particularly helpful while visualizing the results of model fits, such as those produced by the updated PkModeling extension.
A new extension allows to run matlab scripts without having to recompile Slicer. For more information see here
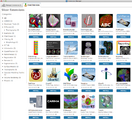
Extension Manager, the slicer multiplatform Appstore is open for business and free.
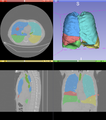
Semi-automatic lobe segmentation for regional lung disease analysis as part of the Chest Imaging Platform funded by NHLBI 1R01HL116931
- 2012
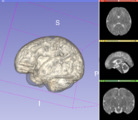
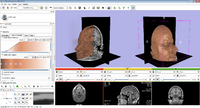
Fetal brain development. The visualization is using volume rendering and the Multivolume modules in Slicer 4. Click here for the full movie (~24mb). Data downloaded from Imperial College.
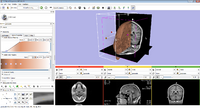
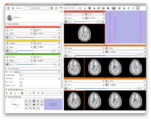
Leveraging multi viewer layout to arrange 6 slices in the 3D viewer
Visualization of complex query "motor system + mass + straight gyrus" using the faceted query module
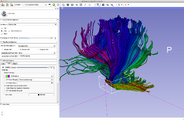
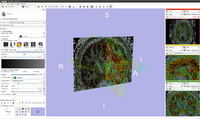
Fibers colored by their mean orientation is now available in the Tractography Display module
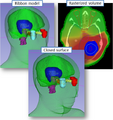
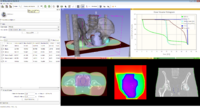
SlicerRT 0.2 has been released! SlicerRT is 3D Slicer with extensions for radiotherapy research, which is developed by SparKit project with the contributions from Slicer community.
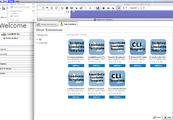
The new extension manager
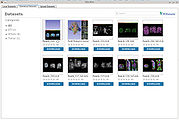
Up to date download statistics
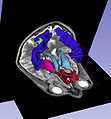
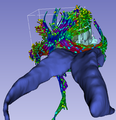
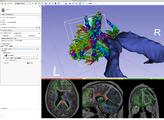
A combination of ROI cropping of streamlines, fiducial based seeding and labelmap seeding allows to assess the deformation of streamlines which are due to tumor based deformations.
New download page which highlights the operating system of the downloading system.
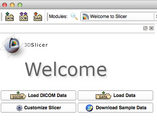
New look for the Welcome module and the "Load/Save" toolbar
Step one of the DWI to Full-brain tractography wizard
Improved 2-stage user interface for the Slice Viewer Controllers
Updated Icons for the Core Modules
Updated CompareViewers and Viewer Controler Module
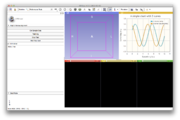
MultiVolumeExplorer with support for charting. See here for more information.
Image Quantification with Label Statistics, Charting, and Volume Rendering
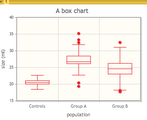
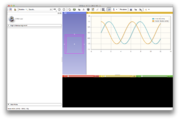
A ChartView using QWebView and jqPlot with plots defined in MRML
A ChartView using QWebView and jqPlot with plots defined in MRML
A bar chart tie MRML to a QWebView
- 2011
ChangeTracker visualization of analysis results
Volumerendering of a CT angiogram
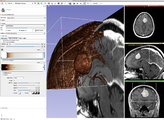
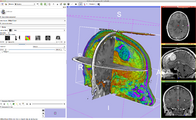
Volumerendering of a subvolume of a post Gadolinium T1 weighted image of a GBM. Note the relation of surrounding vessels to the tumor.
Note the deformation of the corpus callosum fibers
Using an ROI to crop streamlines from a whole brain tractography. The streamlines display color by orientation, the ellipsoids are displaying fractional anisotropy.
Annotation module 2011-11
Main Gui with pop-up slice controllers
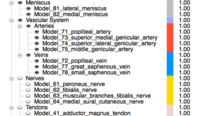
Models organized in a hierarchy
Dual camera, dual 3D viewer
After the facelift for the GUI
New models module appearance
Slicer4 with Volume Rendering
Slicer4 Annotation Module
Glyph display on cross-sections
First CompareView in Slicer4 2011
Slicer 4 Annotation Module 2011-01-24
Slicer 4 Annotation Module 2011-01-24
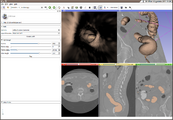
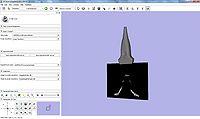
Slicer 4 Live ultrasound module for IGT spine procedures
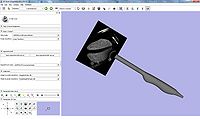
Slicer 4 Live ultrasound module for IGT prostate procedures
- 2010
Slicer 4 Annotation Module
