Difference between revisions of "Modules:EMDTIClustering-Documentation-3.5"
| Line 48: | Line 48: | ||
''Output Initial Centers'' [Optional] Selected initial cluster centers. | ''Output Initial Centers'' [Optional] Selected initial cluster centers. | ||
''Output Final Centers'' [Optional] Final cluster centers, colored by the mean FA value along the bundle | ''Output Final Centers'' [Optional] Final cluster centers, colored by the mean FA value along the bundle | ||
| − | if "Perform | + | if "Perform Quantitative Analysis" is flaged . |
''Perform Quantitative Analysis'' Flag that needs to be marked if quantitative analysis is desired to be done. | ''Perform Quantitative Analysis'' Flag that needs to be marked if quantitative analysis is desired to be done. | ||
''Output Directory'' A directory needs to be specified if performing quantitative analysis. | ''Output Directory'' A directory needs to be specified if performing quantitative analysis. | ||
Latest revision as of 16:57, 25 November 2009
Home < Modules:EMDTIClustering-Documentation-3.5Return to Slicer 3.5 Documentation
Module Name
EM Fiber Clustering Module
General Information
Module Type & Category
Type: CLI
Category: Clustering
Authors, Collaborators & Contact
- Mahnaz Maddah
- James Miller
- Contact: Mahnaz Maddah, maddah@ge.com
Module Description
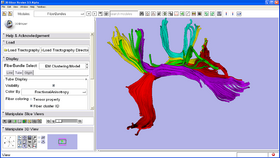
This module clusters a set of input trajectories into a number of bundles, generates arc length parameterization by establishing the point correspondences and reports diffusion parameters along the bundles as well as the membership probability of each trajectory in each cluster. The module requires specification of seed trajectories (or initial centerlines) as representatives of the desired bundles.
Usage
Examples, Use Cases & Tutorials
Tutorial and test data can be downloaded from here:
http://www.nitrc.org/projects/quantitativedti/
Quick Tour of Features and Use
Here is a list of the panels in the module:
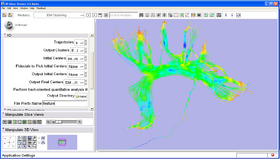
- IO panel:
 Trajectories                        Input trajectories to be clustered.
 Output Clusters                     Clustered trajecories labeled by their cluster ID.
 Initial Centers                     [optional] Initial center(s). Note that intial centers need
                                         to be provided by passing either a set of trajectories here or a fiducial list.
 Fiducials to Pick Initial Centers   [optional] A fiducial list to generate initial center(s). For each fiducial
                                         in the list the closest trajectory in the input is selected as the initial center.
 Output Initial Centers              [Optional] Selected initial cluster centers.
 Output Final Centers                [Optional] Final cluster centers, colored by the mean FA value along the bundle
                                         if "Perform Quantitative Analysis" is flaged .
 Perform Quantitative Analysis       Flag that needs to be marked if quantitative analysis is desired to be done.
 Output Directory                    A directory needs to be specified if performing quantitative analysis.
 File Prefix Name                    Prefix of the output files generated through tract-oriented analysis.
 Description of generated CSV files by EM Clustering Module
- Clustering Parameters:
 Compactness of Fiber Bundles        Parameter between 1 and 5 that specifies the extent of similarity between the
                                         trajectories of each cluster. Increase the value for more compact bundles.
- Advanced Parameters:
 Space Resolution                    Space resolution for distance map calculation.
 Iterations                          Maximum number of EM iterations.
 Maximum Distance                    Maximum distance in mm specifies an upper threshold on the distance of points that
                                         can contribute to new center formation.
Development
Dependencies
Known bugs
Follow this link to the Slicer3 bug tracker.
Usability issues
Follow this link to the Slicer3 bug tracker. Please select the usability issue category when browsing or contributing.
Source code & documentation
Source code link

